State of Physician and Pharmacist Oncology Workforce in the United States in 2019
- PMID: 33270520
- PMCID: PMC8189614
- DOI: 10.1200/OP.20.00600
State of Physician and Pharmacist Oncology Workforce in the United States in 2019
Abstract
Purpose: To examine the geographic distribution of physician and pharmacist workforce specialized in oncology in the United States.
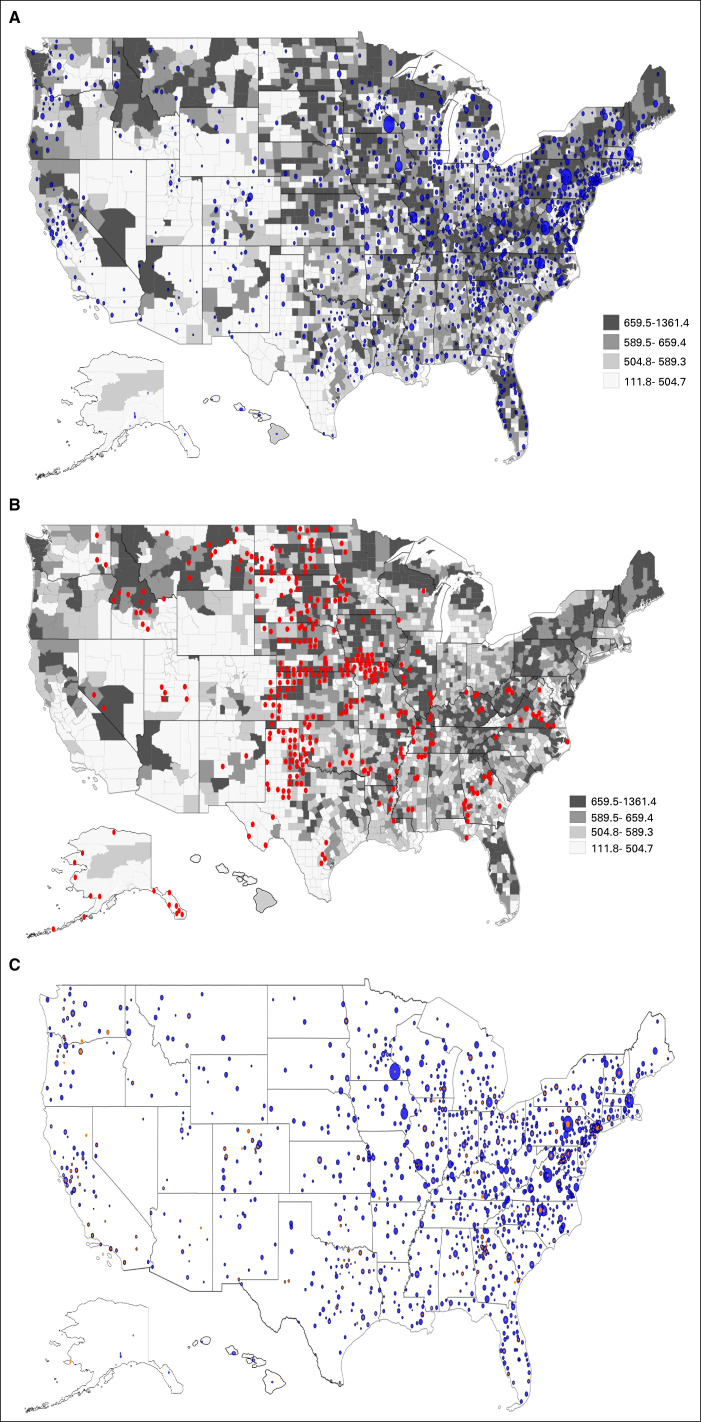
Methods: Using the National Provider Identifier data, we identified two types of oncology workforce via the healthcare provider taxonomy codes. Oncologists were physicians self-identified as providing oncologic care to patients. Oncology pharmacists were pharmacists with an oncology subspecialty. We calculated the geographic density of physician and pharmacist oncology workforce and used county-level cancer crude rates to quantify the demand for oncology workforce. We used spatial data to plot the density of oncology workforces relative to county-level cancer rates and compared the county-level density of oncologists and oncology pharmacists.
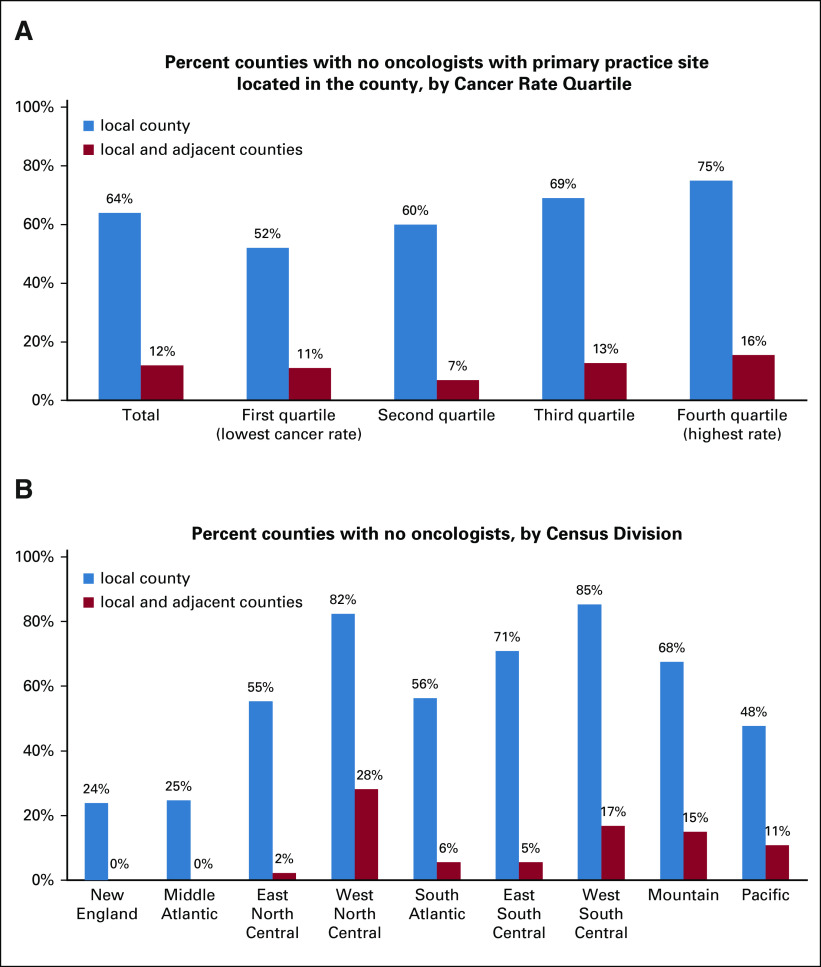
Results: Of the 30,553 members of the oncology workforce in 2019, 28,681 were oncologists and 1,090 were oncology pharmacists. The mean county-level density of oncologists was 2.94 (SD = 7.32) per 100,000 persons. Sixty-four percent of counties had no oncologists with primary practice location in that county and 12% had no oncologists in the local and adjacent counties. Counties in the top quartile of cancer rates had the highest percentage without any oncologists with primary practice location in the county (75%) and with no oncologists in the local as well as adjacent counties (16%).
Conclusion: Geographically mismatched demand and supply characterized the current oncology workforce. Wide discrepancies in the supply of oncologists across geographic regions highlight the importance of developing core competencies for health professions not specialized in oncology to deliver quality cancer care in areas with unmet need for oncology care.
Figures
Comment in
-
ASCO's Selection of Oncologist Workforce Data Source.JCO Oncol Pract. 2021 May;17(5):295-296. doi: 10.1200/OP.21.00081. JCO Oncol Pract. 2021. PMID: 33974814 No abstract available.
-
Response to "State of Physician and Pharmacist Oncology Workforce in the United States in 2019".JCO Oncol Pract. 2021 May;17(5):297-298. doi: 10.1200/OP.21.00152. Epub 2021 Apr 22. JCO Oncol Pract. 2021. PMID: 33974826 No abstract available.
-
Reply to M. K. Kirkwood et al.JCO Oncol Pract. 2021 May;17(5):296-297. doi: 10.1200/OP.21.00176. JCO Oncol Pract. 2021. PMID: 33974828 No abstract available.
References
-
- Shapiro E, Cooper CS, Greenfield S, et al. : The American Academy of Pediatrics Workforce Survey for the Section on Urology 2015. J Pediatr Urol 13:68-72, 2017 - PubMed
-
- Kim JS, Cooper RA, Kennedy DW: Otolaryngology-head and neck surgery physician work force issues: An analysis for future specialty planning. Otolaryngol Head Neck Surg 146:196-202, 2012 - PubMed
-
- AAMC : The 2019 Update: The Complexities of Physician Supply and Demand: Projections From 2017 to 2032. Washington, DC, AAMC, 2019
-
- Hortobagyi GN, American Society of Clinical Oncology : A shortage of oncologists? The American Society of Clinical Oncology workforce study. J Clin Oncol 25:1468-1469, 2007 - PubMed
Publication types
MeSH terms
Grants and funding
LinkOut - more resources
Full Text Sources
Other Literature Sources
Medical