

Editorial
doi: 10.1161/CIRCRESAHA.120.318317.
Epub 2020 Dec 3.
Large Artery Stiffness and New-Onset Diabetes
Affiliations
- PMID: 33270547
- PMCID: PMC7721077
- DOI: 10.1161/CIRCRESAHA.120.318317
Item in Clipboard
Editorial
Large Artery Stiffness and New-Onset Diabetes
Circ Res.
.
No abstract available
Keywords: Editorials; arterial pressure; capillaries; hemodynamics; obesity.
Figures
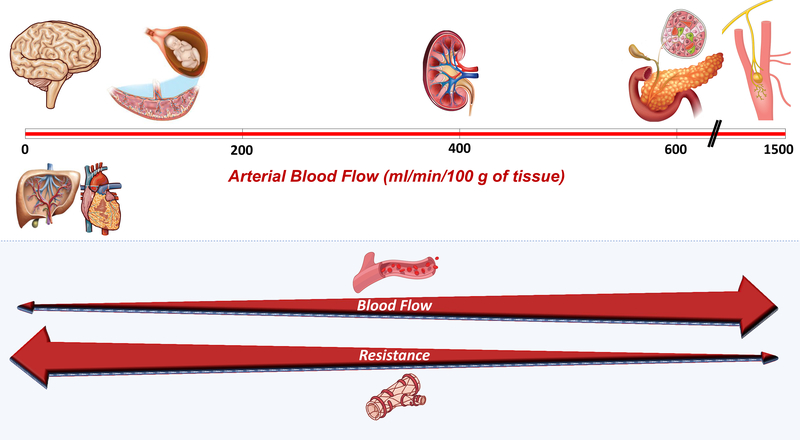
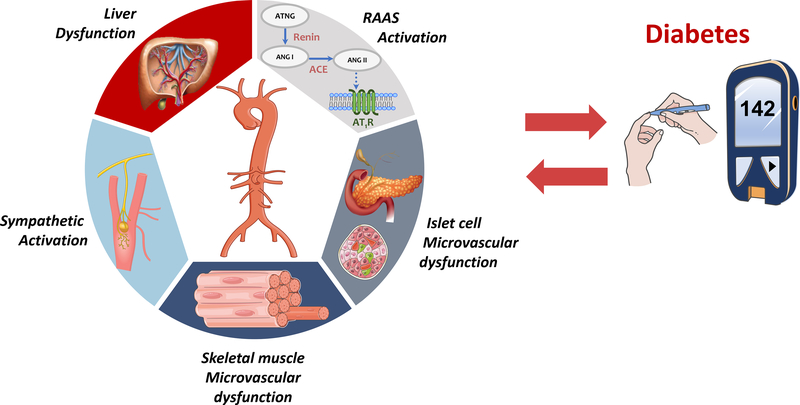
A. Arterial blood flow relative to tissue mass in low-resistance, high-flow organs. Organs are placed along a vertical axis in which higher flow rates per 100 g of tissue increase from left to right red bar). The lower panel demonstrates the inverse relationship between local flow and local resistance, which is largely a microvascular property. We note that although there is a wide range of resistance and blood flow as shown, organs in the figure are all considered to exhibit “low resistance-high flow” hemodynamics, compared to most other organs (such as the gut, the skin, subcutaneous tissue, or skeletal muscle at rest). Of note, measurements of bulk pancreatic blood flow in humans (used to estimate islet flow rates) vary in the literature. It should also be noted that liver blood flow is much higher to what is depicted in the figure, which only considers arterial hepatic flow. B. Mechanisms that underlie the relationship between large artery stiffness and DM. RAAS=renin-angiotensin-aldosterone system.
A. Arterial blood flow relative to tissue mass in low-resistance, high-flow organs. Organs are placed along a vertical axis in which higher flow rates per 100 g of tissue increase from left to right red bar). The lower panel demonstrates the inverse relationship between local flow and local resistance, which is largely a microvascular property. We note that although there is a wide range of resistance and blood flow as shown, organs in the figure are all considered to exhibit “low resistance-high flow” hemodynamics, compared to most other organs (such as the gut, the skin, subcutaneous tissue, or skeletal muscle at rest). Of note, measurements of bulk pancreatic blood flow in humans (used to estimate islet flow rates) vary in the literature. It should also be noted that liver blood flow is much higher to what is depicted in the figure, which only considers arterial hepatic flow. B. Mechanisms that underlie the relationship between large artery stiffness and DM. RAAS=renin-angiotensin-aldosterone system.
Comment on
-
Arterial Stiffness Preceding Diabetes: A Longitudinal Study.Circ Res. 2020 Dec 4;127(12):1491-1498. doi: 10.1161/CIRCRESAHA.120.317950. Epub 2020 Sep 28. Circ Res. 2020. PMID: 32985370
References
Publication types
MeSH terms
Grants and funding
LinkOut - more resources
Full Text Sources
Medical
