. 2020 Dec 3;15(12):e0242684.
doi: 10.1371/journal.pone.0242684. eCollection 2020.

Complex genetic dependencies among growth and neurological phenotypes in healthy children: Towards deciphering developmental mechanisms

Affiliations

Complex genetic dependencies among growth and neurological phenotypes in healthy children: Towards deciphering developmental mechanisms

Lisa Uechi et al. PLoS One. .

Abstract

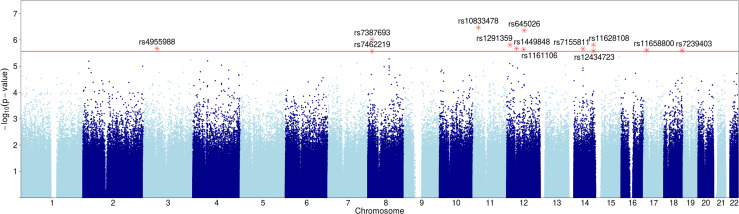
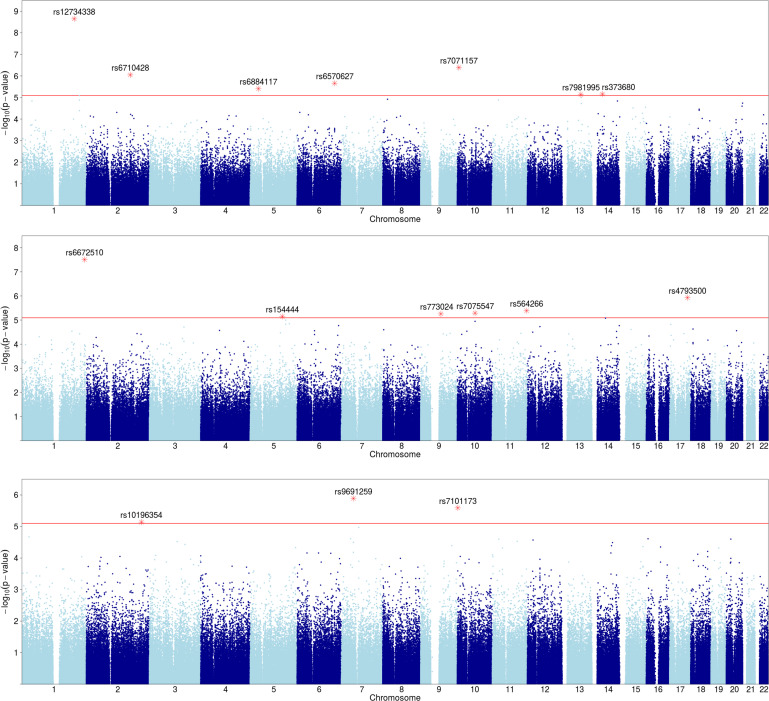
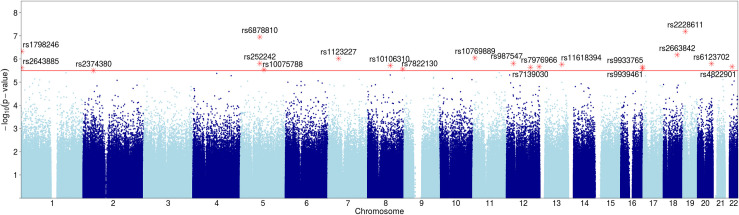
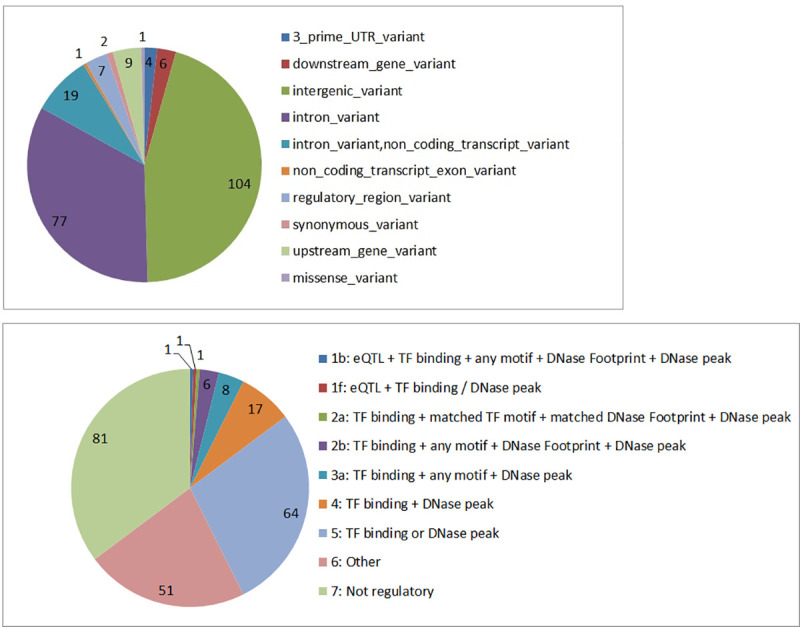
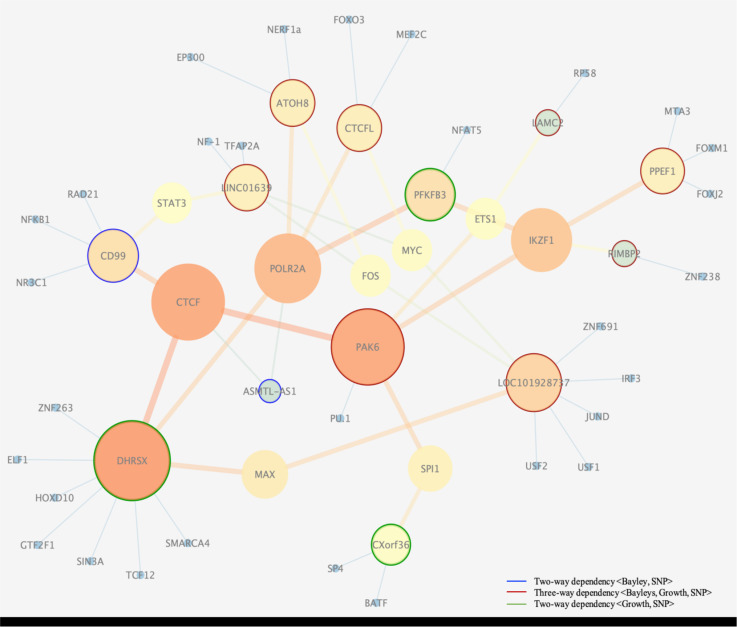
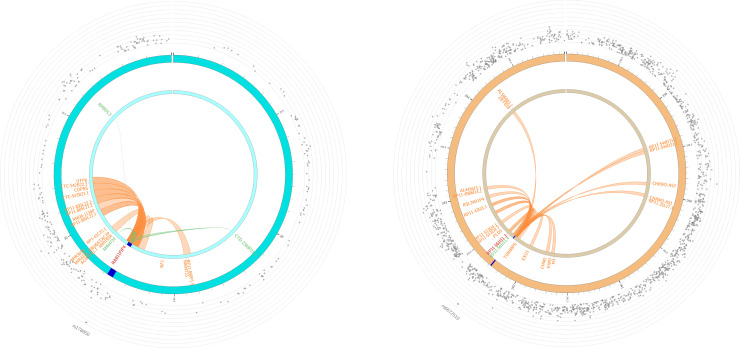
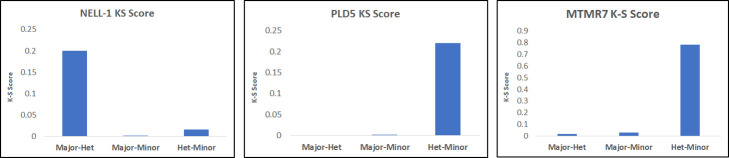
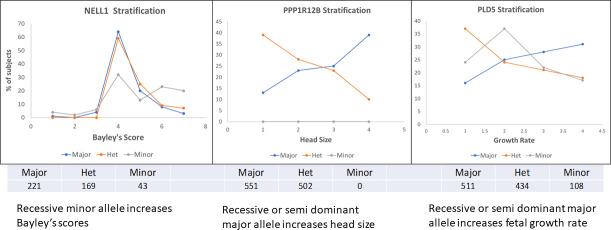
The genetic mechanisms of childhood development in its many facets remain largely undeciphered. In the population of healthy infants studied in the Growing Up in Singapore Towards Healthy Outcomes (GUSTO) program, we have identified a range of dependencies among the observed phenotypes of fetal and early childhood growth, neurological development, and a number of genetic variants. We have quantified these dependencies using our information theory-based methods. The genetic variants show dependencies with single phenotypes as well as pleiotropic effects on more than one phenotype and thereby point to a large number of brain-specific and brain-expressed gene candidates. These dependencies provide a basis for connecting a range of variants with a spectrum of phenotypes (pleiotropy) as well as with each other. A broad survey of known regulatory expression characteristics, and other function-related information from the literature for these sets of candidate genes allowed us to assemble an integrated body of evidence, including a partial regulatory network, that points towards the biological basis of these general dependencies. Notable among the implicated loci are RAB11FIP4 (next to NF1), MTMR7 and PLD5, all highly expressed in the brain; DNMT1 (DNA methyl transferase), highly expressed in the placenta; and PPP1R12B and DMD (dystrophin), known to be important growth and development genes. While we cannot specify and decipher the mechanisms responsible for the phenotypes in this study, a number of connections for further investigation of fetal and early childhood growth and neurological development are indicated. These results and this approach open the door to new explorations of early human development.


Conflict of interest statement

The authors have read the journal's policy and have the following competing interests: JDW and JLF are paid employees of Metrum Research Group. NLJ is a paid employee of Pharmactuarials LLC. There are no patents, products in development or marketed products to declare. This does not alter our adherence to PLOS ONE policies on sharing data and materials.

Figures

Fig 1
Fig 1. Manhattan plot of SNPs with Bayley phenotype dependence.
Y axis shows p-values (negative log scale) of pairwise dependence of SNPs with Bayley phenotypes at 24 months (see Table 2). SNPs with p-value<2.7x10⁻⁶ (red line) are highlighted and labeled.
Fig 2
Fig 2. Manhattan plot of SNPs with growth parameter dependence.
Y-axis shows p-values (negative log scale) of pairwise dependence of SNPs with three growth variables: a) linf, b) lambda, and c) alpha. SNPs with p-value<8x10⁻⁶ (red line) are highlighted and labeled.
Fig 3
Fig 3. The Manhattan plots show significant SNPs for pleiotropy with growth parameters and Bayley phenotypes.
Y-axis shows p-values (negative log scale) of three-way dependencies of SNPs, Bayley phenotypes, and each of the three Growth parameters: a) linf, b) lambda, and c) alpha. SNPs with p-value<3.2x10⁻⁶ (red line) are highlighted and labeled.
Fig 4
Fig 4. Distribution of functional consequence using VEP annotation tool and RegulomeDB scores for SNPs linked to neurological and growth phenotypes identified through two-way (mutual information) and three-way (Delta 3) dependency analysis.
a) Distribution of candidate SNPs across the functional locations based on VEP annotation. Most of the SNPs are located in non-coding locations, i.e., intronic and intergenic regions of the genome. b) The RegulomeDB score for the candidate SNPs. The lower the score, the more likely it is that a SNP has a regulatory function. eQTL = expression Quantitative Trait Loci; TF = Transcription Factor.
Fig 5
Fig 5. Regulatory interaction network.
Depicted are interactions of transcription factors connected with regulatory SNPs (noted by their nearest gene). Clustering and visualization of the network was carried out using Cytoscape v.3.3.0 (undirected network and betweenness centrality statistics). The degree of nodes (the number of edges per node) is shown with their color, ranging from orange (the highest degree), to yellow, green, and then blue (the lowest degree). In addition, larger nodes correspond to hubs with higher degree. The edges with high betweenness centrality, whose removal would partition the network into connected subnetworks, are depicted by thick, orange lines. The small blue nodes are additional factors connected to the dependent loci. “Orphan genes” (unconnected nodes) are not shown. Nodes with blue, green, and red rings correspond to loci detected with two-way and three-way analysis (see the legend).
Fig 6
Fig 6. FUMA circular plots of chromatin interactions and eQTLs of lead SNPs.
a) The plot of chromosome 17, showing the lead SNP, rs178850, of RAB11FIP4 gene and its interactors. b) The plot of chromosome 1, illustrating the second lead SNP, rs6672510, of PLD5 gene and its interactors. The outer ring (grey dots) shows the Manhattan plot of all the SNPs in the chromosome, with p < 0.05, and not in LD with the lead SNP. The lead SNPs are indicated with a red dot. Both inner rings indicate the chromosome, with the risk loci highlighted in blue. The links and labels indicate chromatin interactions (orange) and eQTLs (green). When the SNP is mapped by both chromatin interactions and eQTLs, as in the case of rs178850, it is highlighted as red.
Fig 7
Fig 7. The Kolmogorov-Smirnov scores for the genetically stratified phenotype distributions (two shown in Fig 8).
The scores, indicating the similarity between the distributions, show the dominance of the major allele for NELL1 and the dominance of the minor allele for PLD5, and MTMR7 (not shown in Fig 8).
Fig 8
Fig 8. The distributions of phenotypes by genotype for three of the pairwise genetic variant effects.
The numbers of subjects with each genotype are shown under each panel. a. NELL1 shows a distribution that suggests a strong dominance of the major allele for the Bayley scale score distribution. b. PPP1R12B shows a diametrically opposite distribution between the homozygote and heterozygote. c. PLD5 shows the same as in b) but with a distinct homozygous minor distribution.
Fig 9
Fig 9. The Kolmogorov-Smirnov (K-S) test of similarity of distributions for the growth parameter phenotype (linf) genetically stratified according to PAK6 genotype (similarly to Fig 7).
The K-S test is shown for different values of Bayley scale phenotype (Composite language score at 24 months).
Fig 10
Fig 10. Flow chart of the process of selecting gene candidates using our dependency measures.
The measures of multi-variable dependencies and Delta are described in Section 4.1.3, and the preprocessing of phenotypes and SNP data are described in Section 4.2. The statistical evaluation is explained in Section 4.3.
Fig 11
Fig 11. The preprocessing steps of the genotype data showing the number of SNPs removed from Delta analysis.
Fig 12
Fig 12. Distribution of SNPs in the X and Y region for Bayley’s and growth phenotypes.
a) The distributions of Bayley phenotypes by male and female infants used for the two-variable <Bayley, SNPs> analysis. b) The distributions of Growth phenotypes by male and female infants used for the two-variable <Growth, SNPs> analysis.

References

    1. MAL-ED Network Investigators, Childhood stunting in relation to the pre- and postnatal environment during the first 2 years of life: The MAL-ED longitudinal birth cohort study. PLoS Med. 2017;14: 1–21. 10.1371/journal.pmed.1002408 - DOI - PMC - PubMed
    1. Tarullo AR, Obradović J, Keehn B, Rasheed MA, Siyal S, Nelson CA, et al. Gamma power in rural Pakistani children: Links to executive function and verbal ability. Dev Cogn Neurosci. 2017;26: 1–8. 10.1016/j.dcn.2017.03.007 - DOI - PMC - PubMed
    1. Soh SE, Tint MT, Gluckman PD, Godfrey KM, Rifkin-Graboi A, Chan YH, et al. Cohort Profile: Growing Up in Singapore Towards healthy Outcomes (GUSTO) birth cohort study. 2013; 10.1093/ije/dyt125 - DOI - PubMed
    1. Soh SE, Chong YS, Kwek K, Saw SM, Meaney MJ, Gluckman PD, et al. Insights from the growing up in Singapore towards healthy outcomes (GUSTO) cohort study. Ann Nutr Metab. 2014;64: 218–225. 10.1159/000365023 - DOI - PubMed
    1. Cross-Disorder Group of the Psychiatric Genomics Consortium. Identification of risk loci with shared effects on five major psychiatric disorders: a genome-wide analysis. Lancet. 2013;381(9875): 1371–1379. 10.1016/S0140-6736(12)62129-1 - DOI - PMC - PubMed

Publication types