

A metagenomic glimpse into the gut of wild and domestic animals: Quantification of antimicrobial resistance and more
- PMID: 33270717
- PMCID: PMC7714112
- DOI: 10.1371/journal.pone.0242987
A metagenomic glimpse into the gut of wild and domestic animals: Quantification of antimicrobial resistance and more
Abstract
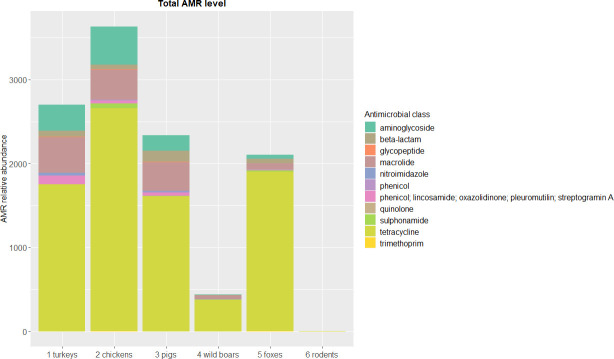
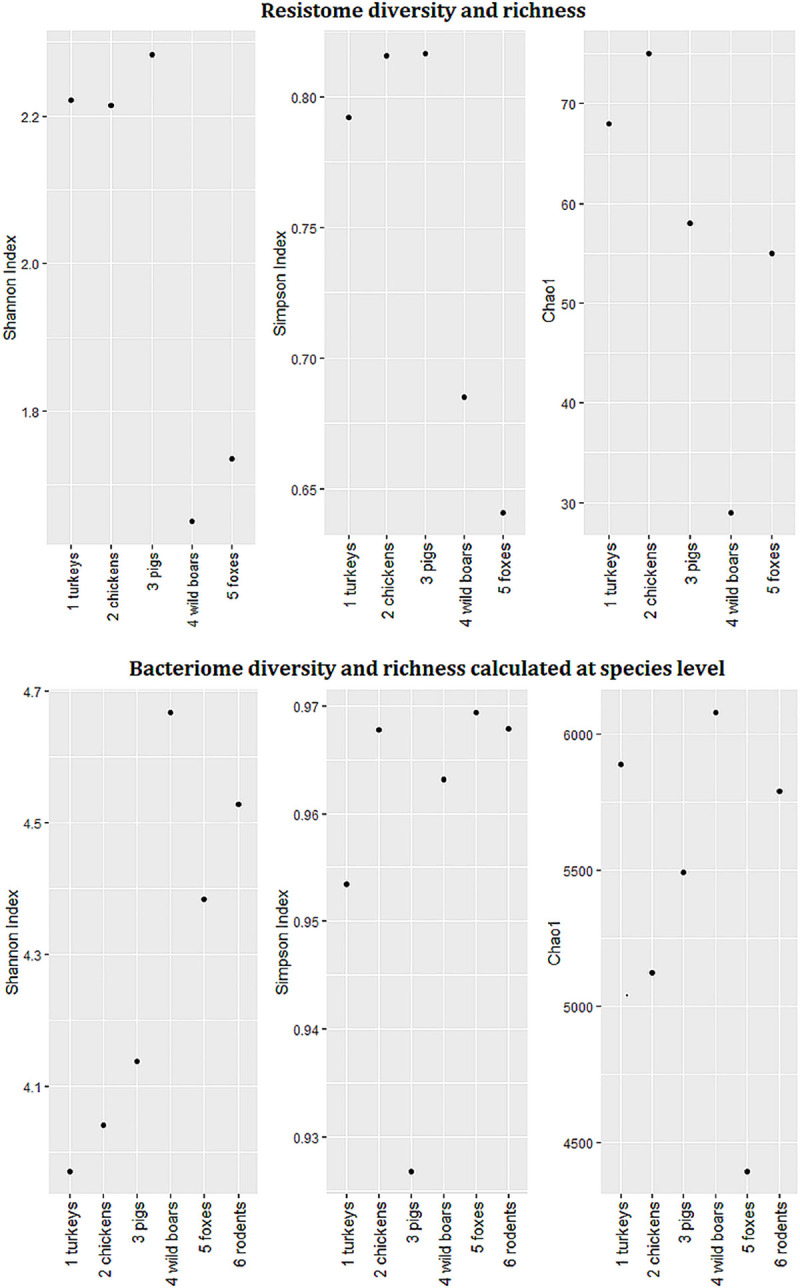
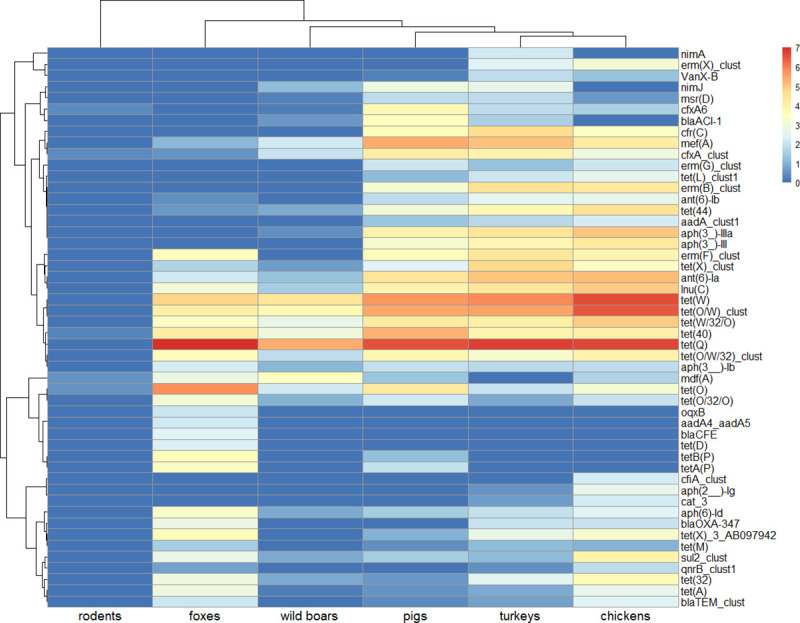
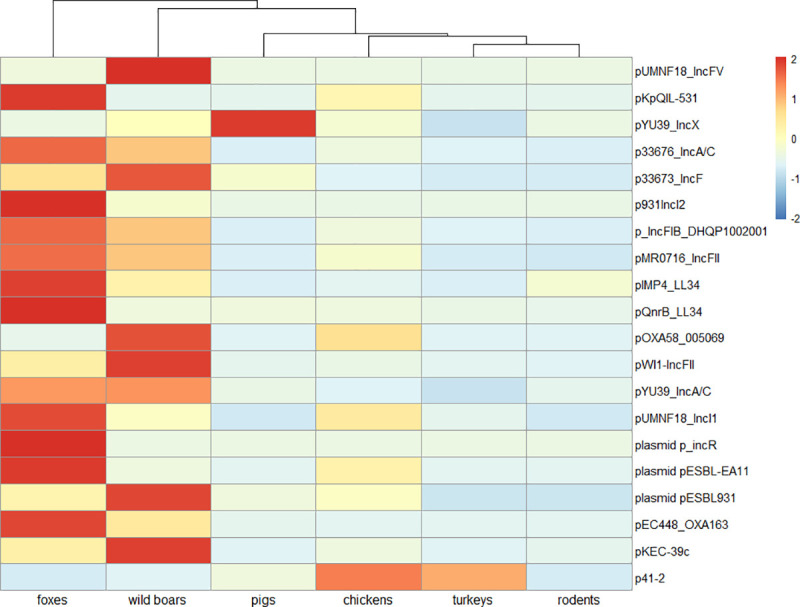
Antimicrobial resistance (AMR) in bacteria is a complex subject, why one need to look at this phenomenon from a wider and holistic perspective. The extensive use of the same antimicrobial classes in human and veterinary medicine as well as horticulture is one of the main drivers for the AMR selection. Here, we applied shotgun metagenomics to investigate the AMR epidemiology in several animal species including farm animals, which are often exposed to antimicrobial treatment opposed to an unique set of wild animals that seems not to be subjected to antimicrobial pressure. The comparison of the domestic and wild animals allowed to investigate the possible anthropogenic impact on AMR spread. Inclusion of animals with different feeding behaviors (carnivores, omnivores) enabled to further assess which AMR genes that thrives within the food chain. We tested fecal samples not only of intensively produced chickens, turkeys, and pigs, but also of wild animals such as wild boars, red foxes, and rodents. A multi-directional approach mapping obtained sequences to several databases provided insight into the occurrence of the different AMR genes. The method applied enabled also analysis of other factors that may influence AMR of intestinal microbiome such as diet. Our findings confirmed higher levels of AMR in farm animals than in wildlife. The results also revealed the potential of wildlife in the AMR dissemination. Particularly in red foxes, we found evidence of several AMR genes conferring resistance to critically important antimicrobials like quinolones and cephalosporins. In contrast, the lowest abundance of AMR was observed in rodents originating from natural environment with presumed limited exposure to antimicrobials. Shotgun metagenomics enabled us to demonstrate that discrepancies between AMR profiles found in the intestinal microbiome of various animals probably resulted from the different antimicrobial exposure, habitats, and behavior of the tested animal species.
Conflict of interest statement
The authors have declared that no competing interests exist.
Figures
Similar articles
-
What does the fox say? Monitoring antimicrobial resistance in the environment using wild red foxes as an indicator.PLoS One. 2018 May 25;13(5):e0198019. doi: 10.1371/journal.pone.0198019. eCollection 2018. PLoS One. 2018. PMID: 29799852 Free PMC article.
-
Abundance of clinically relevant antimicrobial resistance genes in the golden jackal (Canis aureus) gut.mSphere. 2025 Mar 25;10(3):e0081924. doi: 10.1128/msphere.00819-24. Epub 2025 Feb 13. mSphere. 2025. PMID: 39945541 Free PMC article.
-
Merging Metagenomics and Spatial Epidemiology To Understand the Distribution of Antimicrobial Resistance Genes from Enterobacteriaceae in Wild Owls.Appl Environ Microbiol. 2020 Oct 1;86(20):e00571-20. doi: 10.1128/AEM.00571-20. Print 2020 Oct 1. Appl Environ Microbiol. 2020. PMID: 32769191 Free PMC article.
-
Antimicrobial resistance plasmid reservoir in food and food-producing animals.Plasmid. 2018 Sep;99:72-81. doi: 10.1016/j.plasmid.2018.09.001. Epub 2018 Sep 6. Plasmid. 2018. PMID: 30194944 Review.
-
Wild boar as a reservoir of antimicrobial resistance.Sci Total Environ. 2020 May 15;717:135001. doi: 10.1016/j.scitotenv.2019.135001. Epub 2019 Nov 23. Sci Total Environ. 2020. PMID: 31839282 Review.
Cited by
-
Antimicrobial Resistance Glides in the Sky-Free-Living Birds as a Reservoir of Resistant Escherichia coli With Zoonotic Potential.Front Microbiol. 2021 Apr 9;12:656223. doi: 10.3389/fmicb.2021.656223. eCollection 2021. Front Microbiol. 2021. PMID: 33897669 Free PMC article.
-
Microbial community and antimicrobial resistance in fecal samples from wild and domestic ruminants in Maiella National Park, Italy.One Health. 2022 May 21;15:100403. doi: 10.1016/j.onehlt.2022.100403. eCollection 2022 Dec. One Health. 2022. PMID: 35647256 Free PMC article.
-
Detection and characterization of Campylobacter in air samples from poultry houses using shot-gun metagenomics - a pilot study.BMC Microbiol. 2024 Oct 9;24(1):399. doi: 10.1186/s12866-024-03563-3. BMC Microbiol. 2024. PMID: 39385092 Free PMC article.
-
Next-Generation Sequencing for the Detection of Microbial Agents in Avian Clinical Samples.Vet Sci. 2023 Dec 4;10(12):690. doi: 10.3390/vetsci10120690. Vet Sci. 2023. PMID: 38133241 Free PMC article. Review.
-
Genomic Analysis of ESBL-Producing E. coli in Wildlife from North-Eastern Germany.Antibiotics (Basel). 2022 Jan 18;11(2):123. doi: 10.3390/antibiotics11020123. Antibiotics (Basel). 2022. PMID: 35203726 Free PMC article.
References
-
- World Health Organization. Antimicrobial resistance: global report on surveillance. Geneva: WHO Press; 2014. June. 232 p ISBN 978 92 4 156474 8.
-
- Norrby R, Powell M, Aronsson B, Monnet DL, Lutsar I, Bocsan IS et al. The bacterial challenge: Time to React. ECDC/EMEA Joint Technical Report 2009. Stockholm: European Centre for Disease Prevention and Control; 2009. September 54 p. 10.2900/2518 - DOI
-
- Centers for Disease Control and Prevention. Antibiotic Resistance Threats in the United States, Atlanta: CDC;2013. April. 114 p.
-
- Cassini A, Hogberg LD, Plachouras D, Quattrocchi A, Hoxha A, Simonsen GS, et al. Attributable deaths and disability-adjusted life-years caused by infections with antibiotic-resistant bacteria in the EU and the European Economic Area in 2015: a population-level modelling analysis. Lancet Infect Dis. 2019;19(1):56–66. 10.1016/S1473-3099(18)30605-4 - DOI - PMC - PubMed
-
- Centers for Disease Control and Prevention. Antibiotic Resistance Threats in the United States, 2019. Atlanta, GA: U.S. Department; 2019.
Publication types
MeSH terms
LinkOut - more resources
Full Text Sources
Medical
