. 2020 Dec 16;48(22):12943-12956.
doi: 10.1093/nar/gkaa1151.

Interaction of OIP5-AS1 with MEF2C mRNA promotes myogenic gene expression

Affiliations

Interaction of OIP5-AS1 with MEF2C mRNA promotes myogenic gene expression

Jen-Hao Yang et al. Nucleic Acids Res. .

Abstract

Long noncoding (lnc)RNAs potently regulate gene expression programs in physiology and disease. Here, we describe a key function for lncRNA OIP5-AS1 in myogenesis, the process whereby myoblasts differentiate into myotubes during muscle development and muscle regeneration after injury. In human myoblasts, OIP5-AS1 levels increased robustly early in myogenesis, and its loss attenuated myogenic differentiation and potently reduced the levels of the myogenic transcription factor MEF2C. This effect relied upon the partial complementarity of OIP5-AS1 with MEF2C mRNA and the presence of HuR, an RNA-binding protein (RBP) with affinity for both transcripts. Remarkably, HuR binding to MEF2C mRNA, which stabilized MEF2C mRNA and increased MEF2C abundance, was lost after OIP5-AS1 silencing, suggesting that OIP5-AS1 might serve as a scaffold to enhance HuR binding to MEF2C mRNA, in turn increasing MEF2C production. These results highlight a mechanism whereby a lncRNA promotes myogenesis by enhancing the interaction of an RBP and a myogenic mRNA.


Figures

Figure 1.
Figure 1.
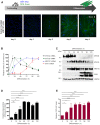
OIP5-AS1 is upregulated early during myogenesis. (A) Fluorescent micrographs detecting MYH to monitor the progression of human (AB1167) myoblasts (day 0, when MYH is undetectable) to myotubes (day 4, which express high levels of MYH). Staining with DAPI was used to identify nuclei. (BE) At the times indicated in differentiating AB1167 cultures, the relative levels of myogenic mRNAs were detected by RT-qPCR analysis and plotted as a percent of the maximum levels observed during myogenesis (B), the levels of myogenic proteins were assessed by western blot analysis (C), the levels of creatine kinase activity were measured enzymatically (Materials and Methods) (D), and the levels of OIP5-AS1 were quantified by RT-qPCR analysis (E). Data in (B, D, E) are the means ±SEM from three or more biological replicates. Significance was established using Student's t-test. *P< 0.05; **P< 0.01; ***P< 0.001. Other data are representative of three or more biological replicates.
Figure 2.
Figure 2.
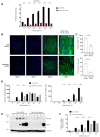
Silencing OIP5-AS1 attenuates myogenesis. (A) AB1167 myoblasts were transfected with Ctrl siRNA or OIP5-AS1-directed siRNA #1; 24 h later, they were placed in differentiation media, and collected at the times shown after the induction of differentiation. The levels of OIP5-AS1 were measured by RT-qPCR analysis. (B) AB1167 myoblasts were transfected with Ctrl siRNA or OIP5-AS1-directed siRNA #1 as described in panel (A), and differentiation was monitored by assessing MYH levels by immunofluorescence at the times indicated. (C) AB1167 myoblasts were transfected with Ctrl siRNA or OIP5-AS1-directed siRNA #1 as described in panel (A), and after differentiation for 2 days, the fusion index and the number of nuclei per myotube were quantified; five fields were assessed per experiment. (D) The levels of MYOG, MYOD, and MYH mRNAs were assessed in AB1167 cells transfected as in panel (A). (E) The levels of MYOG, MYOD, MYH, and loading control HSP90 were assessed by western blot analysis in AB1167 myoblasts transfected as in (A) Ctrl or OIP5-AS1-directed siRNA #1 and collected at the times shown after the induction of differentiation. (F) The levels of creatine kinase activity were assessed in cells transfected as in panel (A). Data in (A, C, E) are the means ± SEM from three or more biological replicates. Significance was established using Student's t-test. *P< 0.05; **P< 0.01; ***P< 0.001. Other data are representative of three or more biological replicates.
Figure 3.
Figure 3.
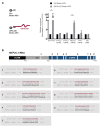
OIP5-AS1 binds to and shares partial complementarity with MEF2C 3′UTR. (A) Left, schematic of biotinylated Ctrl and OIP5-AS1-directed ASOs. Right, after incubation of biotinylated ASOs with AB1167 lysates prepared 24 h after inducing differentiation, RNA complexes were pulled down using streptavidin beads (Materials and Methods). The presence of OIP5-AS1 and myogenesis-related mRNAs in the pulldown material was assessed by RT-qPCR analysis. The levels of test RNAs in the pulldown were normalized to the levels of GAPDH mRNA in the lysates. Data in (A,C,E) are the means ±SEM from three or more biological replicates. Significance was established using Student's t-test. *P< 0.05; **P< 0.01; ***P< 0.001. (B) Regions of potential complementarity identified between OIP5-AS1 and MEF2C mRNA.
Figure 4.
Figure 4.
Silencing OIP5-AS1 lowers MEF2C abundance by diminishing its RNA stability. (A) The levels of MEF2C mRNA (top) and MEF2C (bottom) in AB1167 myoblasts transfected with Ctrl or OIP5-AS1-directed siRNA #1 and processed as explained in Figure 2A were measured by RT-qPCR analysis (normalized to GAPDH mRNA) and western blot analysis (using HSP90 to monitor loading), respectively. (B) Schematic of the psiCHECK2 dual renilla luciferase (RL) and internal control firefly luciferase (FL) reporter constructs used to identify the region(s) of MEF2C 3′UTR regulated by OIP5-AS1. (C) Twenty-four hours after transfecting the plasmids shown, bearing MEF2C 3′UTR regions I, II, and III, AB1167 myoblasts were induced to differentiate for 24 h, and the relative RL/FL ratios were determined. (D) AB1167 myoblasts were co-transfected with MEF2C 3′UTR fragment II, along with either Ctrl siRNA or OIP5-AS1 siRNA; 24 h later they were replaced with differentiation media and cultured for an additional 24 h. The relative RL/FL ratios were determined. (E) AB1167 myoblasts were co-transfected with subsegments II-3, II-4 or II-5 of MEF2C 3′UTR fragment II; 24 h later they were replaced with differentiation media and cultured for an additional 24 h, whereupon the relative RL/FL ratios were determined. (F) AB1167 myoblasts were co-transfected with MEF2C 3′UTR fragment II or with fragment II lacking site 3 of interaction with OIP5-AS1 (II-3Δ); 24 h later they were replaced with differentiation media and cultured for an additional 24 h, whereupon the relative RL/FL ratios were determined. (G) Schematic of the MS2 pulldown assay, including plasmids pMS2 (a control vector expressing MS2 RNA), pOIP5-AS1(s)-MS2 (a vector expressing the chimeric RNA OIP5-AS1-MS2) and pMS2-GST, expressing a fusion protein (MS2-GST) which recognizes MS2 RNA tags and can be pulled down using glutathione (GSH) beads. Twenty-four hours after transfecting AB1167 myoblasts with either pMS2 or pOIP5-AS1(s)-MS2, as well as with pMS2-GST, cells were induced to differentiate. Twenty-four hours later, cell lysates were analyzed by pulldown using GSH-conjugated beads. The relative interaction of MS2 and OIP5-AS1(s)-MS2 with MEF2C mRNA was assessed by RT-qPCR analysis. (H) Twenty-four hours after transfecting plasmids expressing MEF2C 3′UTR fragment II or MEF2C 3′UTR fragment II-3Δ, or an empty vector control plasmid into AB1167 myoblasts, together with plasmids pMS2 or pOIP5-AS1(s)-MS2, as well as with pMS2-GST, cells were induced to differentiate. Twenty-four hours later, cell lysates were analyzed by pulldown using GSH-conjugated beads. The relative interaction of MS2 and OIP5-AS1-MS2 with MEF2C 3′UTR fragment II or MEF2C 3′UTR fragment II-3Δ was assessed by RT-qPCR analysis of the pulldown materials. (I) Twenty-four hours after transfecting Ctrl or OIP5-AS1 siRNAs, AB1167 myoblasts were placed in differentiation media for an additional 24 h, whereupon the steady-state levels of MEF2C mRNA were quantified (left). Cells were then treated with actinomycin D and the relative levels of MEF2C mRNA and normalization control transcript GAPDH mRNA were assessed by RT-qPCR analysis and normalized to 18S rRNA levels, also quantified by RT-qPCR analysis (right). mRNA half-lives (t1/2) were calculated as the times required to reach 50% of the initial abundance of the mRNA at time 0 before adding actinomycin D. (J) AB1167 myoblasts that were either proliferating or induced to differente for 24 h were treated with actinomycin D to measure the stability of MEF2C mRNA as explained in panel (I). In panels (A, C–J) the data represent the means ± SEM from three or more independent experiments. Significance was established using Student's t-test. *P< 0.05; **P< 0.01; ***P< 0.001. Data in (A) are representative of three or more biological replicates.
Figure 5.
Figure 5.
HuR binds OIP5-AS1 and MEF2C mRNA, stabilizes MEF2C mRNA. (A) Venn diagram of RBPs from the CLIP database (Materials and Methods) binding OIP5-AS1 (red) and those binding MEF2C mRNA (blue); 3 RBPs binding both RNAs are listed in the intersection. (B) Binding of HuR to OIP5-AS1 in differentiated AB1167 cultures was verified by HuR RNP immunoprecipitation (RIP) analysis (left); after HuR RIP (Materials and Methods) using IgG or anti-HuR antibodies, the presence of OIP5-AS1 in the IP materials was measured by RT-qPCR analysis, normalized to the levels of GAPDH mRNA (a transcript that is not a target of HuR), and represented as the enrichment of OIP5-AS1 in HuR IP relative to the levels in IgG IP. Western blot analysis was performed to monitor the efficiency of the HuR IP reaction. For OIP5-AS1 pulldown analysis (middle), differentiated AB1167 cultures were incubated with biotin-ASO-conjugated OIP5-AS1; HuR bound to the OIP5-AS1 ASO was detected by western blot analysis. A control (Ctrl) ASO was used to detect background binding of HuR. RT-qPCR analysis was performed to monitor the efficiency of the OIP5-AS1 pulldown. Further validation of this interaction was gained by assaying HuR binding to OIP5-AS1-MS2 (right); lysates prepared from differentiated AB1167 cultures expressing OIP5-AS1-MS2 or MS2 along with GST-MS2-binding protein (as described in Figure 4G) were subjected to western blot analysis to detect HuR in the GST pulldown material. Input, aliquots of the lysates before pulldown. RT-qPCR analysis was performed to monitor the efficiency of OIP5-AS1-MS2 pulldown. (C) HuR RIP analysis was performed as described in panel (B), and the presence of MEF2C mRNA was quantified by RT-qPCR analysis. (D–F) Twenty-four hours after transfecting Ctrl or HuR siRNAs, AB1167 myoblasts were differentiated for an additional 24 h and the steady-state levels of MEF2C mRNA (D) and MEF2C (E) were determined by RT-qPCR and western blot analyses, respectively. In these transfection groups, the steady-state levels of OIP5-AS1 were assessed by RT-qPCR analysis (F, left), and the half-life of MEF2C mRNA was measured after incubation with actinomycin D, as explained in Figure 4H (F, right). (GH) Forty-eight hours after transfecting human embryonic kidney fibroblasts (HEK293 cells) with Ctrl siRNA or OIP5-AS1 siRNA, the levels of HuR were assessed by western blot analysis (G). The relative levels of OIP5-AS1 were shown by RT-qPCR analysis (H, left), and the binding of HuR to MEF2C mRNA was assessed by RIP analysis; data were normalized to the levels of GAPDH mRNA in each IP sample and represented as the enrichment of each mRNA relative to the levels in IgG IP (H, middle). MMP9 mRNA, a target of HuR lacking complementarity to OIP5-AS1, was included as control in RIP analyses; as shown, MMP9 mRNA remained enriched in HuR RIP regardless of OIP5-AS1 abundance (H, right). Western blot analysis was performed to monitor the efficiency of HuR IP. Data in (B-D,F,H) represent the means ±SEM from at least three independent experiments. Significance was established using Student's t-test. *P< 0.05; **P< 0.01; ***P< 0.001. Other data are representative of three or more biological replicates.
Figure 6.
Figure 6.
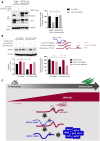
Rescue of myogenesis after silencing OIP5-AS1 by ectopic MEF2C expression. (A) AB1167 myoblasts were cotransfected with siRNAs (Ctrl or OIP5-AS1-directed) and with plasmids (either an Empty Vector control plasmid or a plasmid expressing myc-tagged MEF2C). Twenty-four hours after transfection, AB1167 myoblasts were induced to differentiate and 48 h after that the levels of MEF2C, MEF2C-myc, MYH, and HSP90 were determined by western blot analysis (left), and the activity of the myogenic differentiation marker creatine kinase was measured (right). (B) AB1167 myoblasts were cotransfected with siRNAs (Ctrl or OIP5-AS1-directed) and with one of these plasmids: MS2 only control plasmid, a plasmid expressing the short variant of OIP5-AS1-MS2(s) that bears the MEF2C 3′UTR interacting segment ‘(s)’, or the short variant of OIP5-AS1-MS2(s)Δ lacking the MEF2C 3′UTR interacting segment, ‘(s)Δ’ (schematic, top right). The endogenous (longer) OIP5-AS1 transcript depicting the siRNA recognition site outside of the segment in the ectopic vectors is indicated. In these transfection groups, the abundance of MEF2C was assessed by western blot analysis (left top), the levels of OIP5-AS1 by RT-qPCR analysis (left graph), and the activity of creatine kinase was measured (right graph). (C) Proposed model. In Proliferating (undifferentiated) myoblasts, lncRNA OIP5-AS1 levels are low. As myogenic differentiation progresses, OIP5-AS1 levels rise and through its complementarity with MEF2C mRNA, it helps recruit HuR to the MEF2C 3′UTR and enhances MEF2C mRNA stability and MEF2C production. Through this mechanism, OIP5-AS1 promotes MEF2C expression and enhances myogenesis. Data in (A,B) represent the means ± SEM from at least three independent biological replicates. Significance was established using Student's t-test. *P< 0.05; **P< 0.01; ***P< 0.001. Other data are representative of three or more biological replicates.

References

    1. Kopp F., Mendell J.T.. Functional classification and experimental dissection of long noncoding RNAs. Cell. 2018; 172:393–407. - PMC - PubMed
    1. Noh J.H., Kim K.M., McClusky W.G., Abdelmohsen K., Gorospe M.. Cytoplasmic functions of long noncoding RNAs. Wiley Interdiscip. Rev. RNA. 2018; 9:e1471. - PMC - PubMed
    1. Rinn J.L., Chang H.Y.. Genome regulation by long noncoding RNAs. Annu. Rev. Biochem. 2012; 81:145–166. - PMC - PubMed
    1. Bentzinger C.F., Wang Y.X., Rudnicki M.A.. Building muscle: molecular regulation of myogenesis. Cold Spring Harbor Persp. Biol. 2012; 4:a008342. - PMC - PubMed
    1. Baracos V.E., Martin L., Korc M., Guttridge D.C., Fearon K.C.H.. Cancer-associated cachexia. Nature Rev. 2018; 4:17105. - PubMed

Publication types

MeSH terms