. 2020 Dec 9;28(6):867-879.e5.
doi: 10.1016/j.chom.2020.11.004. Epub 2020 Nov 17.

Cryo-EM Structures of SARS-CoV-2 Spike without and with ACE2 Reveal a pH-Dependent Switch to Mediate Endosomal Positioning of Receptor-Binding Domains

Affiliations

Cryo-EM Structures of SARS-CoV-2 Spike without and with ACE2 Reveal a pH-Dependent Switch to Mediate Endosomal Positioning of Receptor-Binding Domains

Tongqing Zhou et al. Cell Host Microbe. .

Abstract

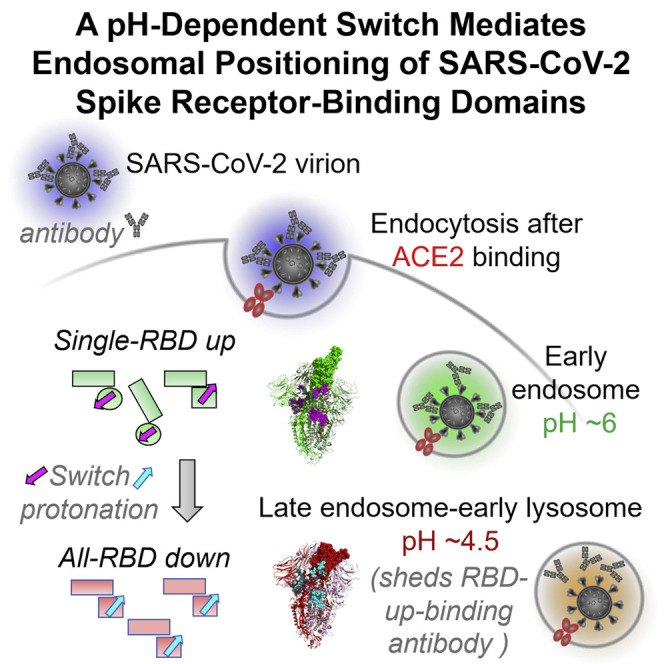
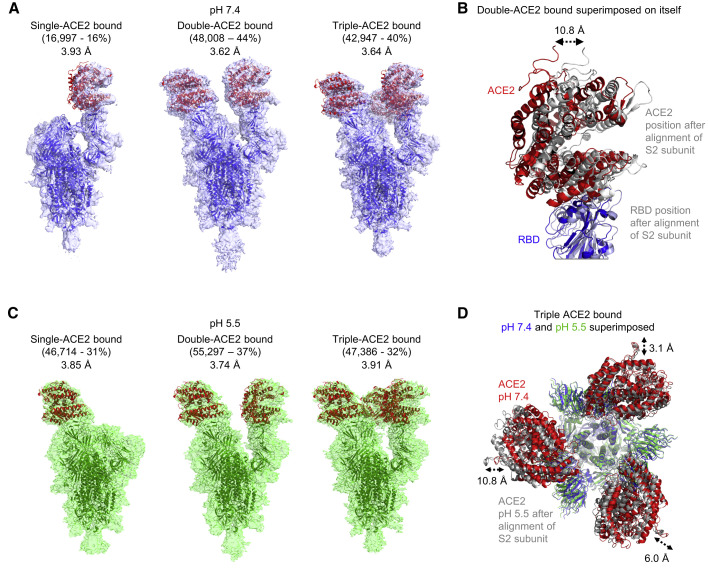
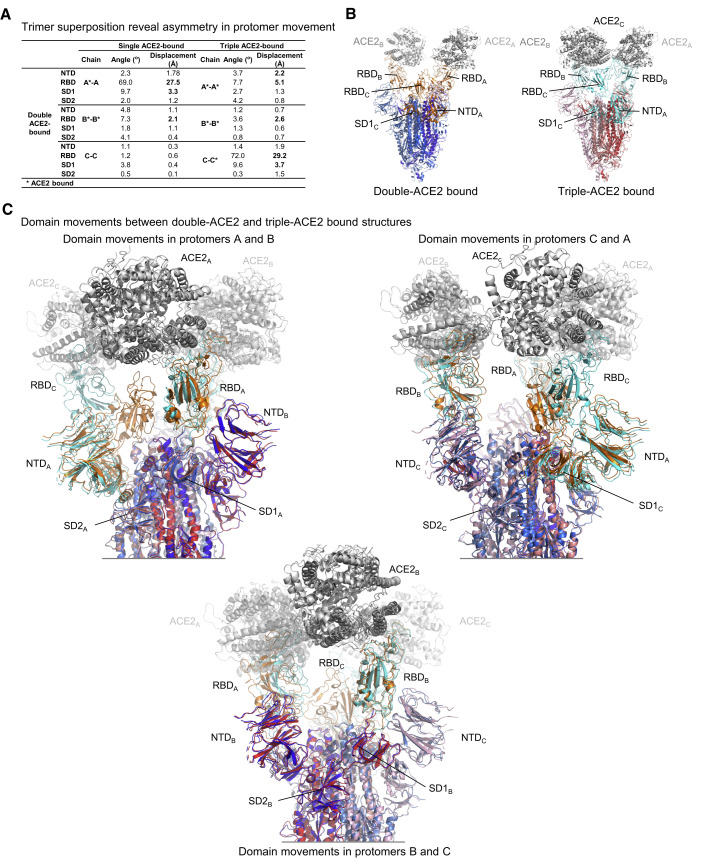
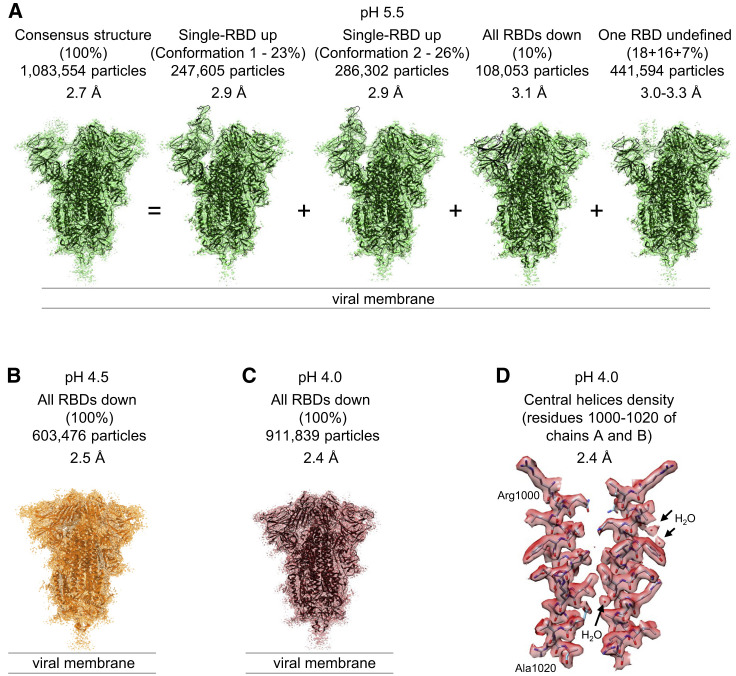
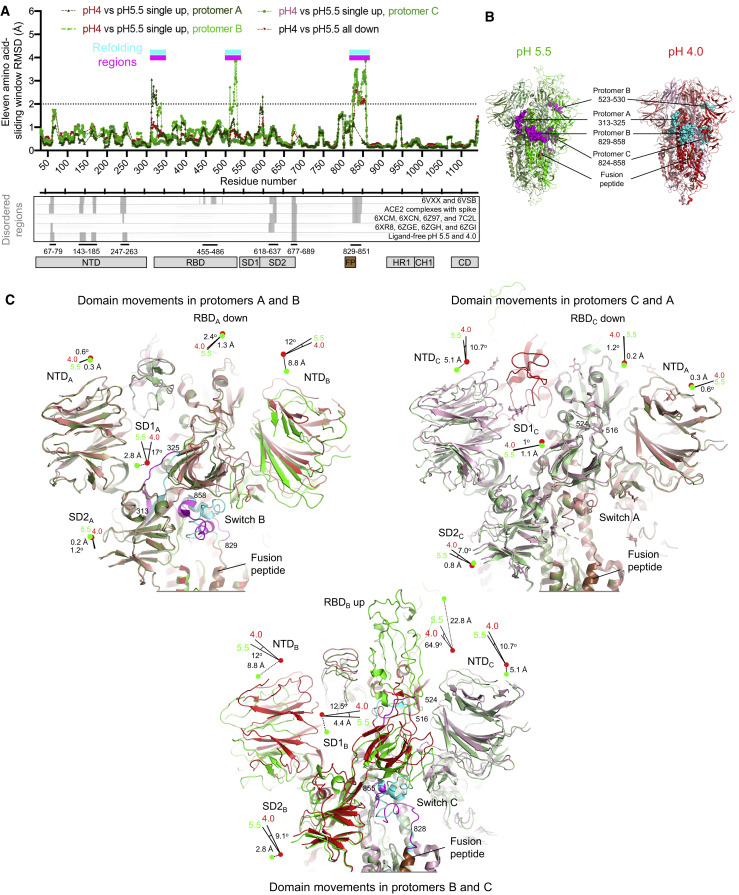
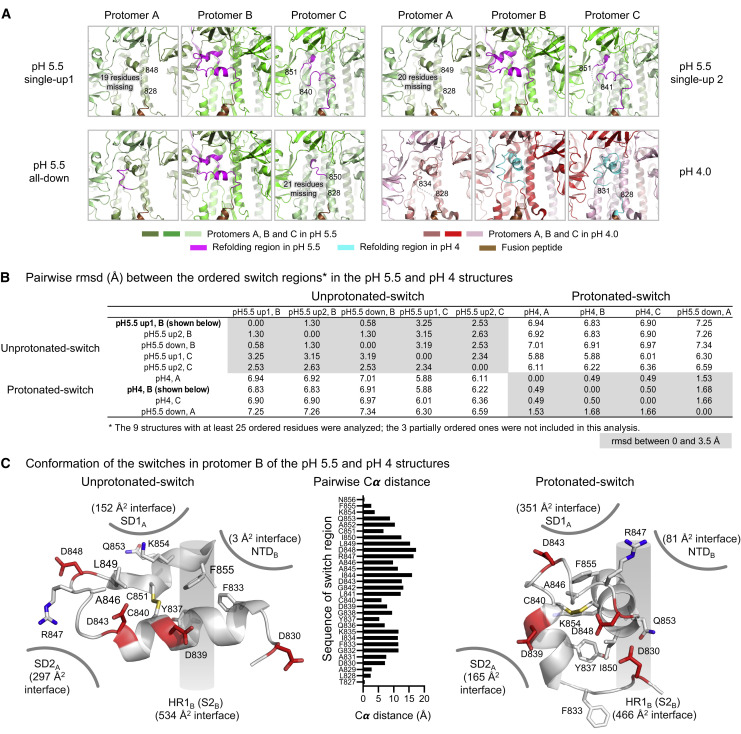
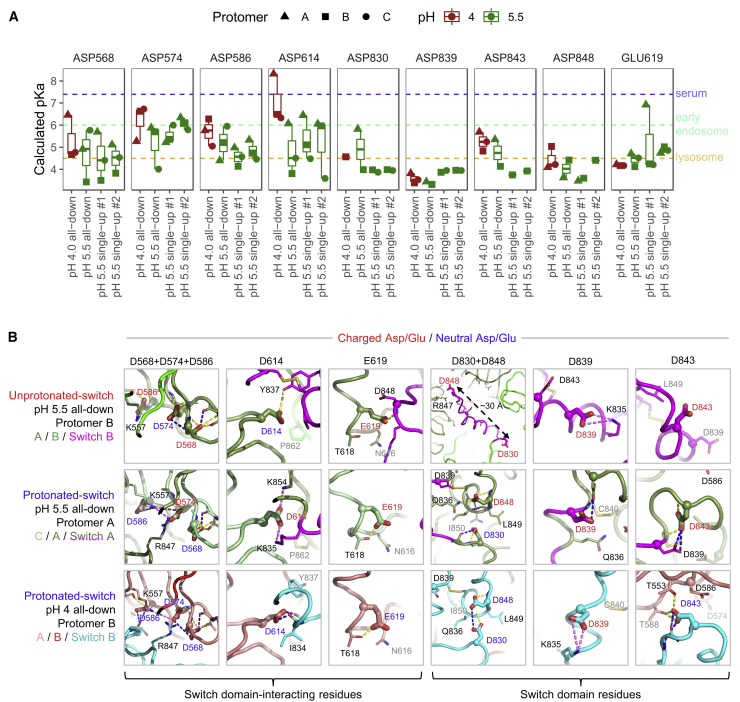
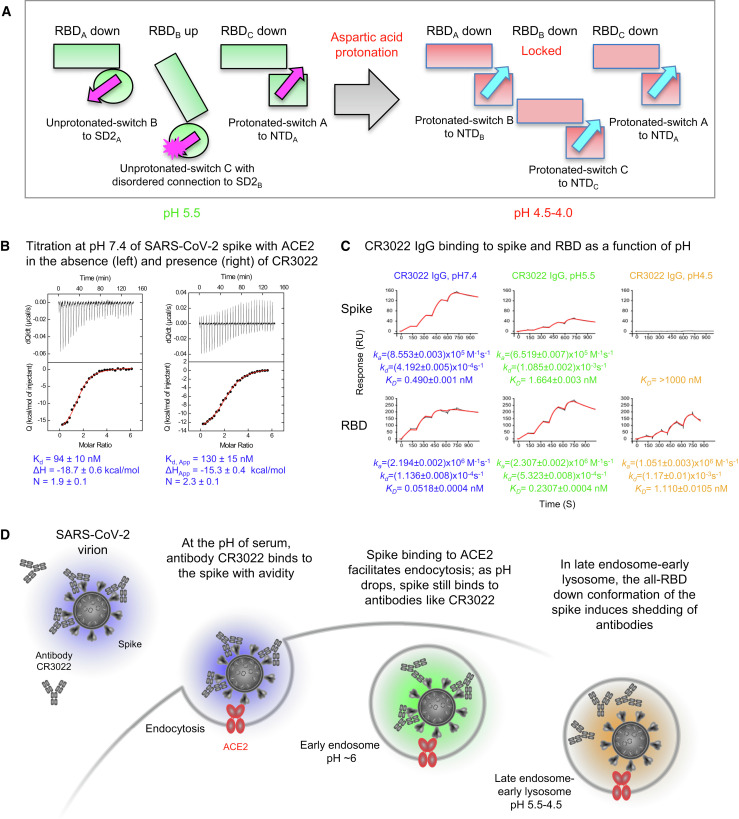
The SARS-CoV-2 spike employs mobile receptor-binding domains (RBDs) to engage the human ACE2 receptor and to facilitate virus entry, which can occur through low-pH-endosomal pathways. To understand how ACE2 binding and low pH affect spike conformation, we determined cryo-electron microscopy structures-at serological and endosomal pH-delineating spike recognition of up to three ACE2 molecules. RBDs freely adopted "up" conformations required for ACE2 interaction, primarily through RBD movement combined with smaller alterations in neighboring domains. In the absence of ACE2, single-RBD-up conformations dominated at pH 5.5, resolving into a solitary all-down conformation at lower pH. Notably, a pH-dependent refolding region (residues 824-858) at the spike-interdomain interface displayed dramatic structural rearrangements and mediated RBD positioning through coordinated movements of the entire trimer apex. These structures provide a foundation for understanding prefusion-spike mechanics governing endosomal entry; we suggest that the low pH all-down conformation potentially facilitates immune evasion from RBD-up binding antibody.

Keywords: ACE2 receptor; COVID-19; endosomal entry; pH-dependent switch; receptor-binding domain (RBD); structural rearrangement; type 1 fusion machine.


Conflict of interest statement

Declaration of Interests The authors declare no competing interests.

Figures

None
Graphical abstract
Figure 1
Figure 1
Cryo-EM Structures of SARS-CoV-2 Spike with ACE2 Show Similar Stoichiometries at Serological and Endosomal pH (A) Cryo-EM structures of spike with single-, double-, or triple-bound ACE2 at serological pH. (B) Structural comparison of the two ACE2-RBD in the double-ACE2-bound structure reveals different tilt angles resulting in as much as a 10.8 Å displacement as indicated. (C) Cryo-EM structure of spike and ACE2 at endosomal pH. (D) Comparison of triple-ACE2-bound spikes at serological and endosomal pH. Structures were aligned by S2-subunit superposition and are displayed with the trimer perpendicular to the page and with spike colored blue and green according to pH, and ACE2 colored red and gray for pH 7.4 and 5.5, respectively. Monomeric ACE2 was used as a ligand in these samples. See also Figure S1 and Table S1.
Figure 2
Figure 2
Coordinated Inter-Protomer Domain Movements Assist in Raising RBD to Bind ACE2 (A) Domain movements between single-, double- and triple-bound ACE2. (B and C) ACE2-induced conformational change. Protomers in the double-ACE2 bound spike are colored in shades of blue whereas those in the triple-ACE2-bound spike are colored in shades of red. Domains that move over 2 Å are colored orange and cyan for the double- and triple-ACE2-bound spikes, respectively. See also Figures S2 and S3.
Figure 3
Figure 3
Cryo-EM Analyses Reveal Lower pH to Reduce Spike-Conformational Heterogeneity Culminating in an All RBD-Down Conformation at pH 4.0 (A) Structures at pH 5.5 with particle prevalence and resolution of determined structures. (B) Structure of spike at pH 4.5. (C) Structure of spike at pH 4.0. (D) Example of reconstruction density. A region at the central helices of the pH 4.0 structure is shown with well-defined water molecules. The contour level is 0.015 (5.7 σ). See also Figure S4, Tables S2 and S3, and Videos S1, S2, S3, and S4.
Figure 4
Figure 4
A Switch Domain Mediates RBD Position (A) Identification of refolding regions through rmsd analysis with a 11-residue window (top) and comparison of disordered regions in cryo-EM structures (bottom). (B) Refolding regions identified by sliding-window rmsd analysis are highlighted on the pH 5.5 single-up and pH 4.0 structures as spheres and are colored magenta and cyan, respectively. Protomers A, B, and C of the pH 5.5 structure are each colored smudge, green, or pale green, and the corresponding protomers in the pH 4.0 structure are colored salmon, red, or light pink, and fusion peptide is colored brown. (C) Domain movements between pH 5.5 and 4.0. Three views are shown to depict the movements at the interfaces of protomers A-B, B-C, and C-A. Extent and direction of rotation and displacement are indicated for each domain with vectors and colored dots. Refolding regions are labeled and colored as in (B). See also Figure S5, Tables S4 and S5, and Video S5.
Figure 5
Figure 5
The pH-Switch Domain (A) Switches in the pH 5.5 and pH 4.0 structures. The protomers and switches were colored as in Figure 4B. Disordered regions of the switches are shown as gray dashed lines and marked by flanking residue numbers. (B) Pairwise rmsd between switch regions (residues 824–858) from different protomers. Of the 12 protomers determined in this study, only 9 had at least 25 ordered residues and were included in this pairwise-rmsd analysis; rmsds of less than 3.5 Å shaded gray. Switch regions for SARS-CoV-2 spike at higher pH were recently described (Cai et al., 2020; Wrobel et al., 2020), and these and switch regions from other coronaviruses are analyzed in Figure S7. (C) Comparison of the unprotonated and protonated switches. Key residues are shown in stick representation, and Asp and Cys residues are colored red and yellow, respectively. Interactive surface areas with surrounding domains indicated. Pairwise Cα-distances between switch residues is shown in the middle. See also Figures S5 and S7 and Tables S4 and S5.
Figure 6
Figure 6
pKa Calculations for the pH-Switch Domain (A) PROPKA-calculated pKas for pH-dependent switch domain residues in the pH 4.0 and 5.5 unliganded spike structures. pKas are plotted for titratable residues within and interacting with the 824–858 pH-dependent switch domain for in each structure, disordered regions excluded. Typical pH values for serum (7.4), early endosome (6.0), and late endosome (4.5) are indicated by dashed lines. (B) Close-up views of Asp/Glu residues in (A) from the pH 4.0 and pH 5.5 structures depict changes in chemical environment for each residue between conformations. View angles with respect to superposed structures are the same within each residue column. Switch domain and surrounding protomers are colored as indicated at left. Highlighted residues are shown as thick sticks with labels colored based on pKa-based dominant protonation state at the structure pH: charged Asp/Glu in red, and neutral (protonated) Asp/Glu in blue. Residues within 4 Å are shown as thin sticks. Dashed lines indicate hydrogen bonds (yellow) or salt bridge interactions (violet), and hydrogen bonds requiring carboxylic acid group protonation are shown in blue. The pKa shifts between unprotonated- and protonated-switch conformations define a pH-dependent stability gradient that favors the protonated-switch form at lower pHs (Yang and Honig, 1993). However, other factors such as global conformational constraints might also play a role in favoring one conformation over another.
Figure 7
Figure 7
SARS-CoV-2 Spike at Serological pH Binds ACE2 and CR3022 and at Lower pH Still Binds ACE2 but Not CR3022 (A) Schematic of the pH-switch locking of RBD in the down position. (B) Isothermal titration calorimetry at pH 7.4 of ACE2 recognizing spike (left) or spike previously titrated with Fab CR3022 (right). Measurements were performed in duplicate; uncertainties are the average standard errors obtained by fitting to the two independent datasets. (C) Apparent affinities of spike (top) and real affinities of RBD (bottom) to CR3022 IgG as a function of pH as measured by SPR. (D) Schematic showing ACE2-dependent endosomal entry of SARS-CoV-2 and the pH-dependent shedding of antibodies like CR3022. See also Figure S6.

Update of

References

    1. Adams P.D., Afonine P.V., Bunkoczi G., Chen V.B., Davis I.W., Echols N., Headd J.J., Hung L.W., Kapral G.J., Grosse-Kunstleve R.W. PHENIX: a comprehensive Python-based system for macromolecular structure solution. Acta Crystallogr D Biol Crystallogr. 2010;66:213–221. - PMC - PubMed
    1. Afonine P.V., Klaholz B.P., Moriarty N.W., Poon B.K., Sobolev O.V., Terwilliger T.C., Adams P.D., Urzhumtsev A. New tools for the analysis and validation of cryo-EM maps and atomic models. Acta Crystallogr. D Struct. Biol. 2018;74:814–840. - PMC - PubMed
    1. Barnes C.O., Jette C.A., Abernathy M.E., Dam K.A., Esswein S.R., Gristick H.B., Malyutin A.G., Sharaf N.G., Huey-Tubman K.E., Lee Y.E. SARS-CoV-2 neutralizing antibody structures inform therapeutic strategies. Nature. 2020 doi: 10.1038/s41586-020-2852-1. - DOI - PMC - PubMed
    1. Beniac D.R., Andonov A., Grudeski E., Booth T.F. Architecture of the SARS coronavirus prefusion spike. Nat. Struct. Mol. Biol. 2006;13:751–752. - PMC - PubMed
    1. Benjaminsen R.V., Sun H., Henriksen J.R., Christensen N.M., Almdal K., Andresen T.L. Evaluating nanoparticle sensor design for intracellular pH measurements. ACS Nano. 2011;5:5864–5873. - PubMed

Publication types

MeSH terms