. 2021 Mar 4;28(3):453-471.e8.
doi: 10.1016/j.stem.2020.11.005. Epub 2020 Dec 2.

Capture of Mouse and Human Stem Cells with Features of Formative Pluripotency

Affiliations

Capture of Mouse and Human Stem Cells with Features of Formative Pluripotency

Masaki Kinoshita et al. Cell Stem Cell. .

Erratum in

Abstract

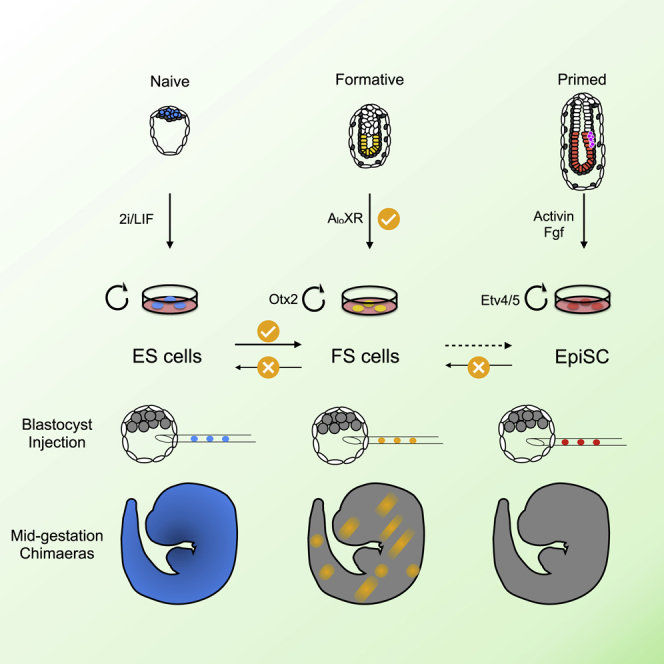
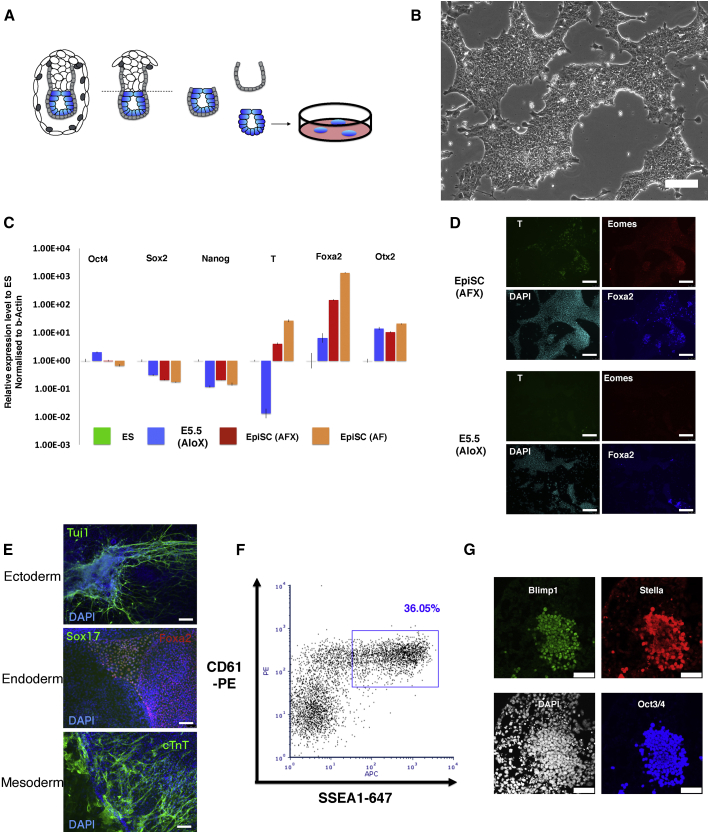
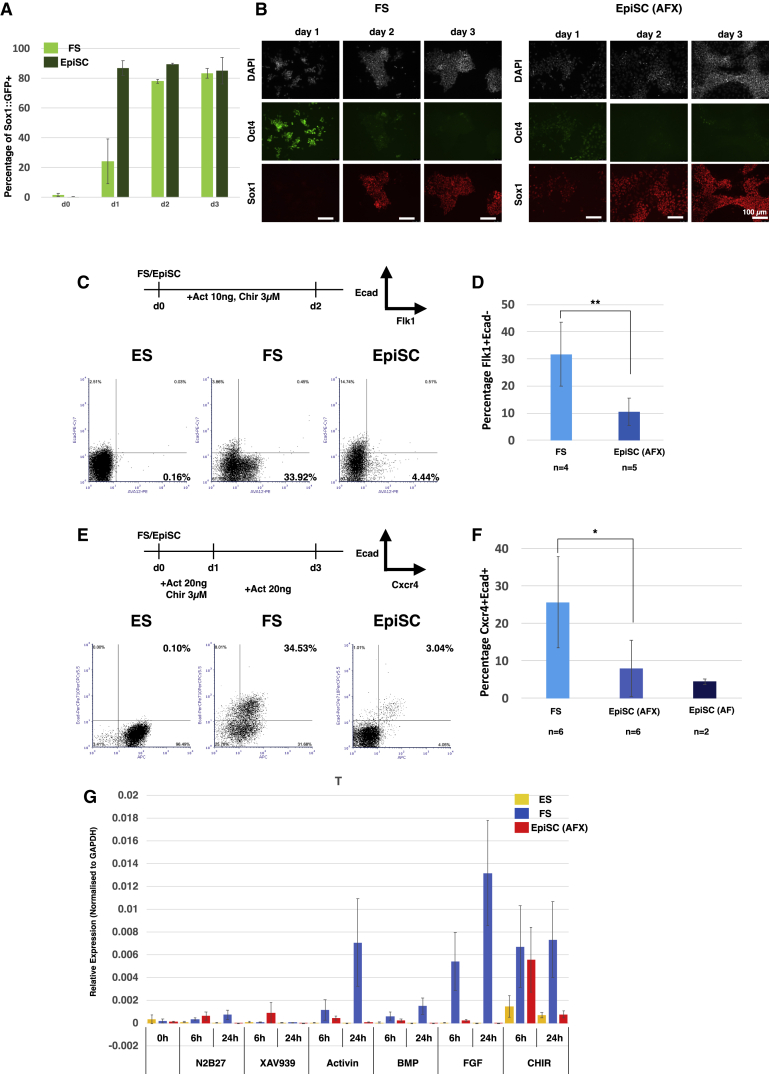
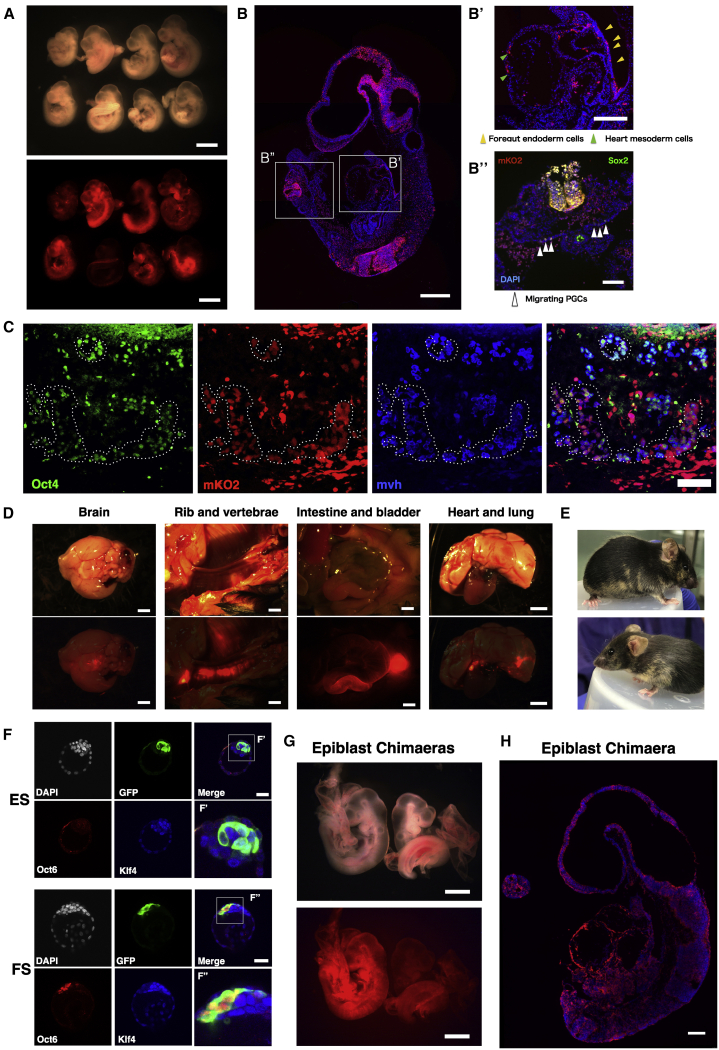
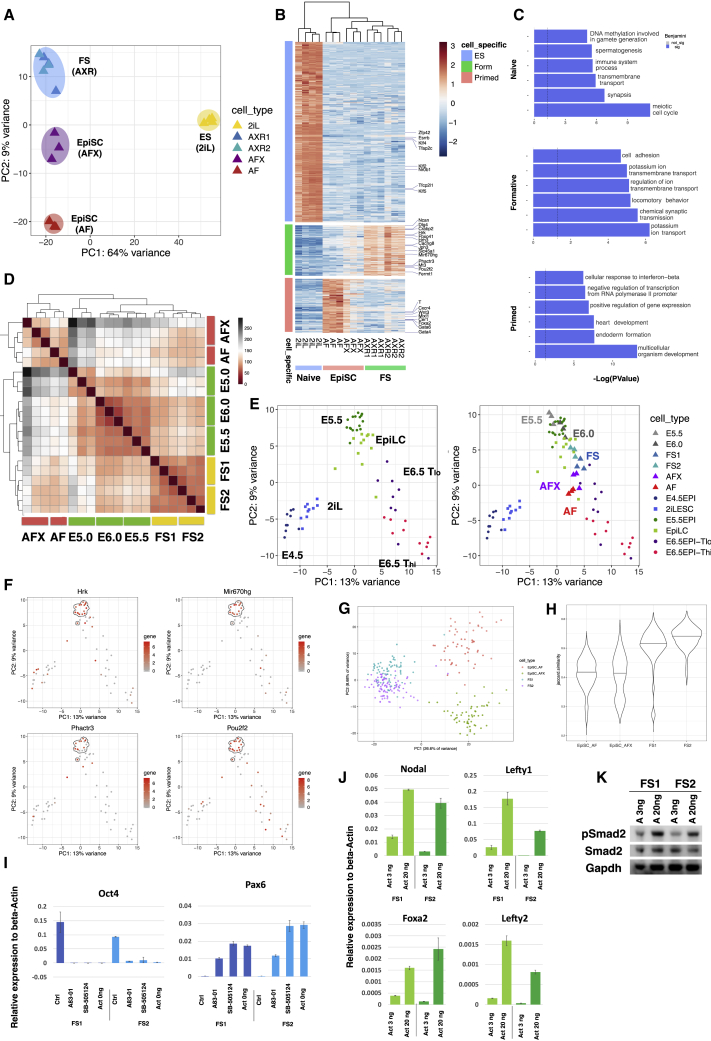
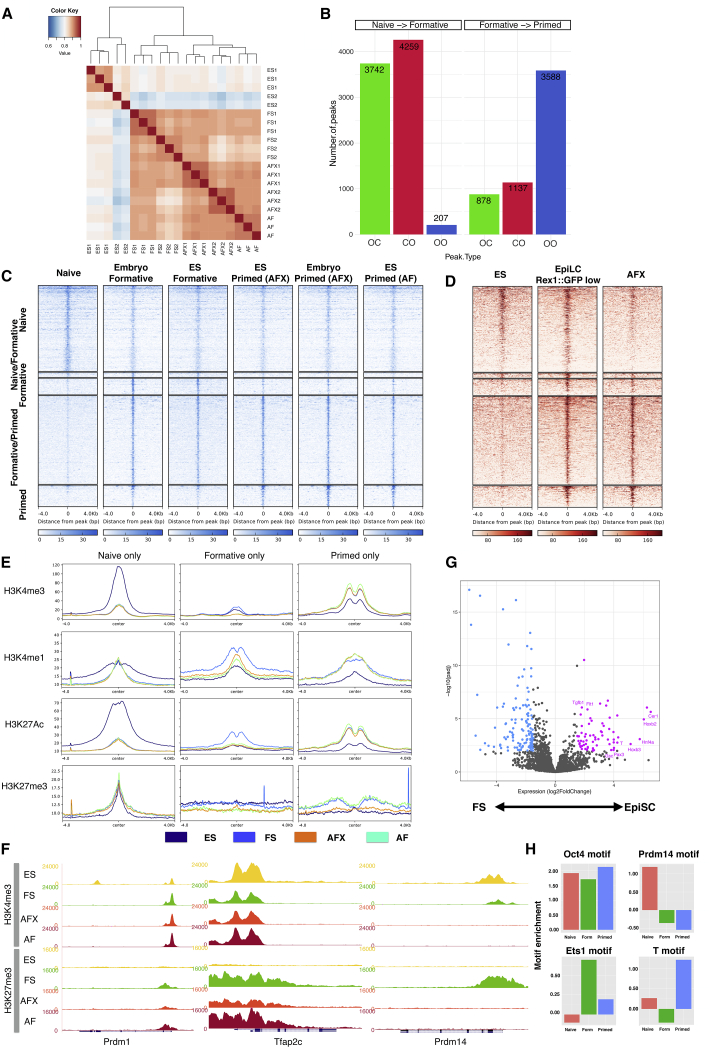
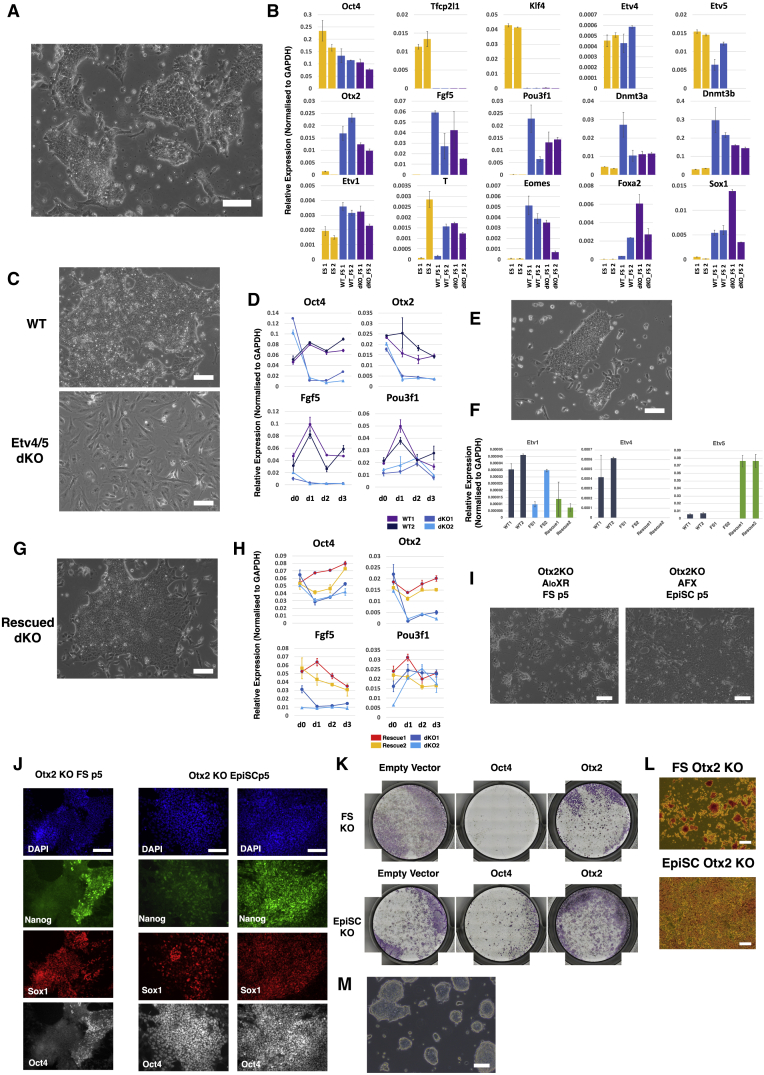
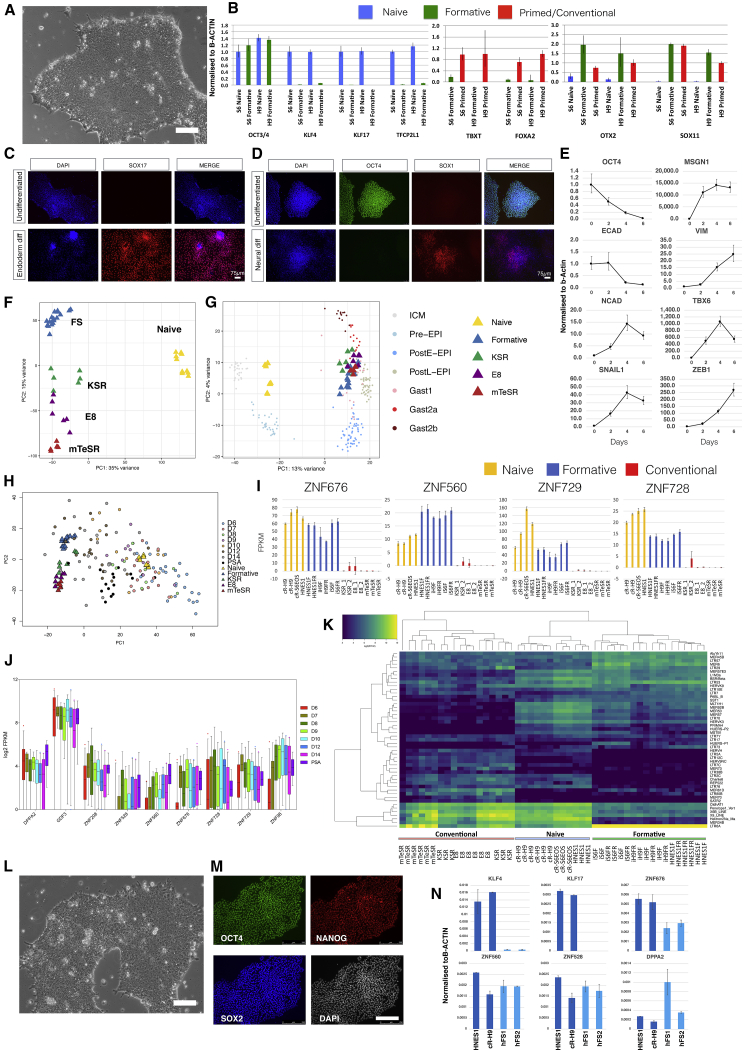
Pluripotent cells emerge as a naive founder population in the blastocyst, acquire capacity for germline and soma formation, and then undergo lineage priming. Mouse embryonic stem cells (ESCs) and epiblast-derived stem cells (EpiSCs) represent the initial naive and final primed phases of pluripotency, respectively. Here, we investigate the intermediate formative stage. Using minimal exposure to specification cues, we derive stem cells from formative mouse epiblast. Unlike ESCs or EpiSCs, formative stem (FS) cells respond directly to germ cell induction. They colonize somatic tissues and germline in chimeras. Whole-transcriptome analyses show similarity to pre-gastrulation formative epiblast. Signal responsiveness and chromatin accessibility features reflect lineage capacitation. Furthermore, FS cells show distinct transcription factor dependencies, relying critically on Otx2. Finally, FS cell culture conditions applied to human naive cells or embryos support expansion of similar stem cells, consistent with a conserved staging post on the trajectory of mammalian pluripotency.

Keywords: chimaera; epiblast; formative pluripotency; lineage induction; pluripotent stem cell; primordial germ cell; self-renewal.


Conflict of interest statement

Declaration of Interests The authors declare no competing interests

Figures

None
Graphical abstract
Figure 1
Figure 1
Derivation of Stem Cell Lines from Formative Epiblast (A) Schematic of cell line derivation from E5.5 epiblast. (B) Image of serially passaged E5.5-epiblast-derived culture. Scale bar, 100 μm. (C) qRT-PCR analysis of marker gene expression relative to ESCs in 2iL ( =1) in AloX cells and EpiSCs maintained in either activin and FGF (AF) or activin, FGF, and XAV939 (AFX), normalized to beta-actin. Error bars are SD from technical triplicates. (D) Immunofluorescent staining of EpiSCs and AloX cultures for early lineage markers. Scale bars, 150 μm. (E) Immunostaining of embryoid body outgrowths for germ layer markers; DAPI in blue. Scale bars, 150 μm. (F) Flow cytometry analysis of PGCLC induction at day 4. (G) Immunostaining of day 4 PGCLC. Scale bars, 50 μm.
Figure 2
Figure 2
Lineage Potency of FS Cells and Responsiveness to Differentiation Cues (A) Neural differentiation assayed by quantification of Sox1::GFP-positive cells. Error bars represent SD from 4 independent experiments. (B) Immunostaining of FS cells and EpiSCs during neural differentiation; DAPI in white. Scale bars, 100 μm. (C) Lateral plate mesoderm differentiation and representative quantifications of the Flk1+Ecad fractions by flow cytometry. (D) Average efficiency of Flk1-positive cell production from FS cells and EpiSCs. n, independent cell lines assayed. Error bars represent the SD. ∗∗p < 0.01. (E) Definitive endoderm differentiation protocol and representative quantifications of the Cxcr4+Ecad+ fraction. (F) Average proportion of Cxcr4+Ecad+ double-positive cells from differentiation of FS and EpiSC lines. Error bars represent SD; p < 0.05. (G) T expression analyzed by qRT-PCR 6 h and 24 h after transfer into N2B27 medium with the indicated supplements; 2 μM XAV939, 20 ng/ml activin A, 10 ng/ml BMP2, 12.5 ng/ml Fgf2, and 3μM CH. Relative expression is normalized to GAPDH. Error bars are SD from two independent cell lines and two technical replicates.
Figure 3
Figure 3
Blastocyst Chimera Contribution by FS Cells and Formative Epiblast (A) Bright-field and fluorescent images of E9.5 embryos generated after blastocyst injection of mKO2 reporter FS cells. Scale bar, 1 mm. (B) Sagittal section from one chimera, stained for mKO2 and DAPI. (B’), mKO2-positive cells in foregut endoderm (yellow arrowheads) and cardiac mesoderm (green arrowheads). (B’’) (rotated 90°), Sox2 immunostaining (white arrowheads) in the hindgut region. Scale bars, 200 μm (B) and 100 μm (B’and B”). (C) mKO2-positive cells expressing Oct4 and Mvh PGC markers in E12.5 chimeric gonad. Triple-positive cells are highlighted with dashed circles. Scale bars, 75 μm. (D) Fluorescent images of organs from post-natal day 21 (P21) chimera overlaid with 20% opacity bright-field image. Scale bars, 2 mm. (E) Coat color chimeras generated from NBRA3.2 FS cells at 7 weeks (above) and 4 weeks (below). (F) Blastocysts injected with GFP reporter ESCs or FS cells and cultured for 24 h. ESCs are Klf4+Oct6 (n = 11) (F’), whereas FS cells are Klf4Oct6+ (F’’) (n = 15). Scale bars, 40 μm. (G) E9.5 chimeras obtained from blastocyst injection of mTmG expressing E5.5 epiblast cells. Scale bars, 500 μm. (H) Section from left embryo in (G) stained with anti-RFP to visualize membrane-tdTomato; DAPI in blue. Scale bar, 200 μm.
Figure 4
Figure 4
Whole-Transcriptome Analysis and Nodal/Activin Pathway Activity (A) PCA with all genes for ESCs, FS cells, and EpiSCs (AFX and AF). (B) Heatmap clustering of naive, formative, and primed enriched genes. (C) GO term analyses based on the genes identified in (B). x axis is −Log(p value). Top 6 significant terms are shown (Benjamini value, <0.05). (D) Heatmap comparison of FS cells and AFX and AF EpiSCs with E5.0, E5.5, and E6.0 epiblast cells. (E) Left, PCA with mouse single-cell data from embryos and EpiLCs (Nakamura et al., 2016). Right, samples from (D) were projected onto the single-cell PCA. (F) Gene expression patterns of selected FS cell enriched genes identified in (B) colored on PCA from (E). E5.5 epiblast cells are highlighted by the dashed circle. (G) PCA using 2,000 most abundant genes of single-cell RNA sequencing (scRNA-seq) data from two FS cell lines and one AFX and one AF EpiSC line. (H) Violin plot of Jaccard index analysis of 2,000 most abundant genes shows higher correlation between FS cells than EpiSCs. (I) qRT-PCR analysis of FS cells in AloXR (Ctrl), with addition of 1 μM A83-01 or 5 μM SB5124, or withdrawal of activin for 2 days. Relative expression to beta-actin. Error bars are SD from technical duplicates. (J) qRT-PCR analysis of FS cells cultured in low (3 ng/ml) and high (20 ng/ml) activin for 2 days. Relative expression to beta-actin. Error bars are SD from technical duplicates. (K) Immunoblot analysis of phospho-Smad2. Cells were passaged once with low (3 ng/ml) or high (20 ng/ml) activin A before assay.
Figure 5
Figure 5
Chromatin Landscape Analysis (A) Hierarchical clustering of all ATAC-seq peaks. (B) Peak changes between states. OC, open to closed; CO, closed to open; OO, open to open. (C) Heatmaps of differential ATAC-seq peaks. (D) Heatmaps of ATAC-seq peaks from (C) in EpiLCs and EpiSCs derived from RGd2 ESCs. (E) Histone modification patterns at ATAC-seq peaks. (F) Genome browser screenshots of H3K4me3 and H3K27me3 distribution at Prdm1, Tfap2c, and Prdm14 loci. (G) Volcano plot showing expression fold changes for genes associated with ATAC-seq peaks shared between FS cells and EpiSCs. Purple, upregulated in EpiSCs; blue, upregulated in FS cells. (H) Transcription factor binding motif enrichments at ATAC-seq peaks.
Figure 6
Figure 6
Differential Requirements for Etv4/5 and Otx2 (A) Morphology of Etv4/5 dKO FS cells. (B) qRT-PCR analysis of ESCs (yellow), parental (wild-type [WT]) FS cells (blue), and Etv4/5dKO FS cells (purple). Error bars represent SD from technical duplicates. (C) Morphology of WT and dKO FS cells in EpiSC (AFX) culture medium for 3 days. (D) Time course qRT-PCR analysis of WT and Etv4/5dKO FS cells in EpiSC (AFX) culture. Error bars are SD from technical duplicates. (E) Morphology of Etv4/5dKO FS cells expressing Etv5 transgene. (F) qRT-PCR assay of Etv1, -4, and -5 in Etv5 rescue dKO lines. Error bars represent SD from technical duplicates. (G) Morphology of rescued dKO FS cells in EpiSC (AFX) culture. (H) Time course qRT-PCR analysis of rescued lines. Error bars represent SD from technical duplicates. (I) Phase images of Otx2 KO ESCs transferred to FS cell or EpiSC (AFX) culture conditions for 5 passages. (J) Immunostaining of Otx2 KO cells at passage 5 (p5) in FS cell or EpiSC culture. Two classes of EpiSC colony were observed: left, homogeneous Oct4 with heterogenous Nanog and Sox1; right, uniformly Oct4, Sox1, and Nanog triple positive. (K) Alkaline phosphatase (AP) staining of control and Oct4 and Otx2 KOs generated by Cas9/guide RNA (gRNA) transfection in FS cells and EpiSCs. Colonies were stained 3 days after replating transfected cells. (L) Morphology of AP-positive Otx2 KO FS cells and EpiSCs. (M) Representative image of Otx2 KO FS cells before culture collapse. Scale bars, 100 μm, except (J) 50 μm.
Figure 7
Figure 7
hFS-like Cells Established from Naive ESCs and Embryos (A) Morphology of human AloXR cells derived from naive hPSCs. Scale bar, 100 μm. (B) qRT-PCR expression analysis of marker genes in two human FS (hFS) cell lines compared with naive and conventional (primed) hPSCs. Error bars represent SD from technical triplicates. (C) SOX17 immunostaining of hFS cells after endoderm induction. (D) SOX1 immunostaining of hFS cells after neural induction. (E) qRT-PCR analysis of hFS cells differentiated into paraxial mesoderm for 6 days. Error bars represent SD from technical triplicates. (F) PCA of hFS cells with naive and conventional hPSCs computed with 11,051 genes identified by median Log2 expression of >0.5. (G) Projection of hFS cell and conventional PSC samples onto PCA of Macaca ICM/epiblast stages computed with 9,432 orthologous expressed genes. (H) PCA for cell line populations computed using 922 variable genes across epiblast samples from human embryo extended culture (Xiang et al., 2019) with projection of embryo single cells. (I) Fragments per kilobase of exon model per million reads mapped (FPKM) values for naive-formative specific genes in naive, formative, or conventional hPSCs. (J) Boxplots of naive-formative specific gene expression in human epiblast stages and primitive streak anlage (PSA). (K) Heatmap of differentially expressed transposable elements between naive, formative, and conventional samples. (L) Morphology of FS cells derived directly from human embryo. Scale bar, 100 μm. (M) Immunostaining of OCT4, SOX2, and NANOG in embryo-derived hFS cells. Scale bar, 250 μm. (N) qRT-PCR analysis of embryo-derived hFS cells. Error bars represent SD from technical duplicates.

Comment in

References

    1. Acampora D., Di Giovannantonio L.G., Simeone A. Otx2 is an intrinsic determinant of the embryonic stem cell state and is required for transition to a stable epiblast stem cell condition. Development. 2013;140:43–55. - PubMed
    1. Acampora D., Omodei D., Petrosino G., Garofalo A., Savarese M., Nigro V., Di Giovannantonio L.G., Mercadante V., Simeone A. Loss of the Otx2-Binding Site in the Nanog Promoter Affects the Integrity of Embryonic Stem Cell Subtypes and Specification of Inner Cell Mass-Derived Epiblast. Cell Rep. 2016;15:2651–2664. - PubMed
    1. Allison T.F., Smith A.J.H., Anastassiadis K., Sloane-Stanley J., Biga V., Stavish D., Hackland J., Sabri S., Langerman J., Jones M. Identification and Single-Cell Functional Characterization of an Endodermally Biased Pluripotent Substate in Human Embryonic Stem Cells. Stem Cell Reports. 2018;10:1895–1907. - PMC - PubMed
    1. Ang S.L., Jin O., Rhinn M., Daigle N., Stevenson L., Rossant J. A targeted mouse Otx2 mutation leads to severe defects in gastrulation and formation of axial mesoderm and to deletion of rostral brain. Development. 1996;122:243–252. - PubMed
    1. Auclair G., Guibert S., Bender A., Weber M. Ontogeny of CpG island methylation and specificity of DNMT3 methyltransferases during embryonic development in the mouse. Genome Biol. 2014;15:545. - PMC - PubMed

Publication types