. 2021 Jan 12;54(1):116-131.e10.
doi: 10.1016/j.immuni.2020.11.002. Epub 2020 Dec 2.

Genome-wide Screens Identify Lineage- and Tumor-Specific Genes Modulating MHC-I- and MHC-II-Restricted Immunosurveillance of Human Lymphomas

Affiliations

Genome-wide Screens Identify Lineage- and Tumor-Specific Genes Modulating MHC-I- and MHC-II-Restricted Immunosurveillance of Human Lymphomas

Devin Dersh et al. Immunity. .

Abstract

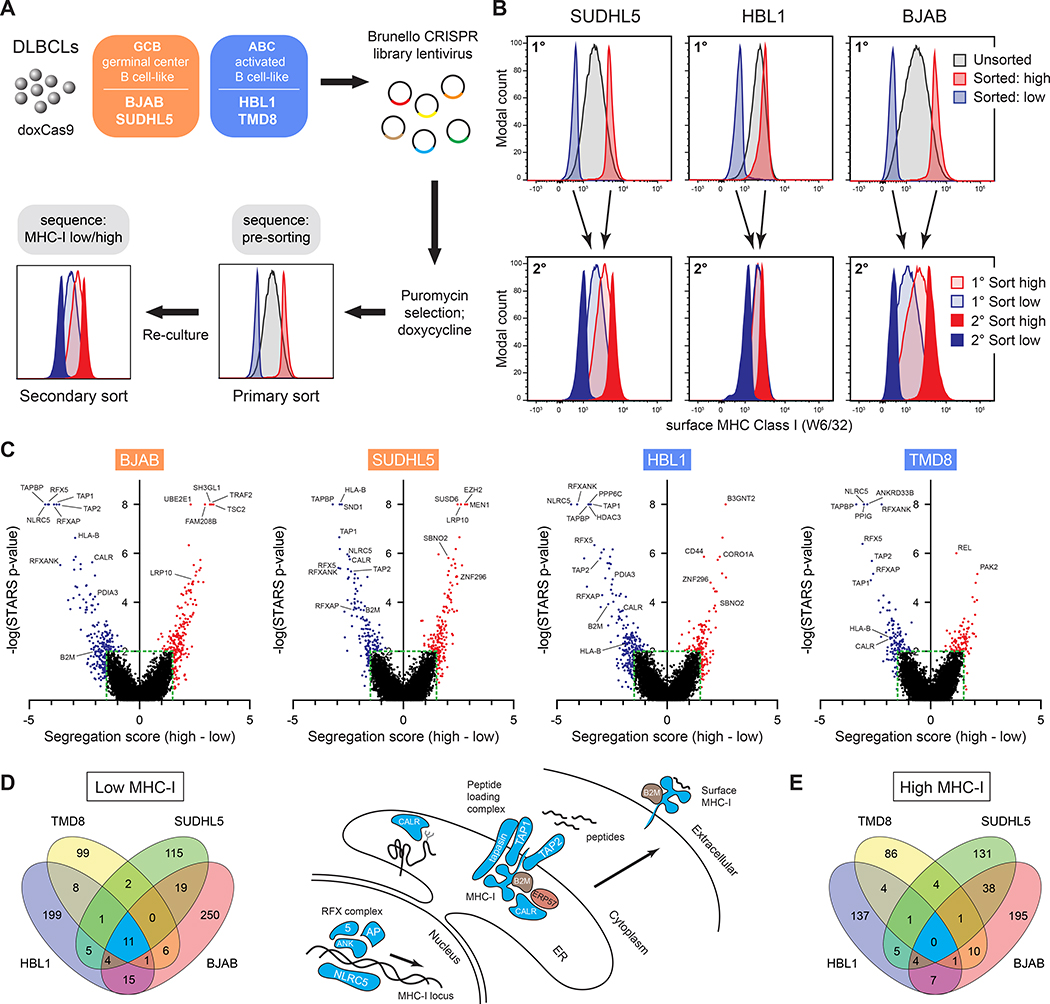
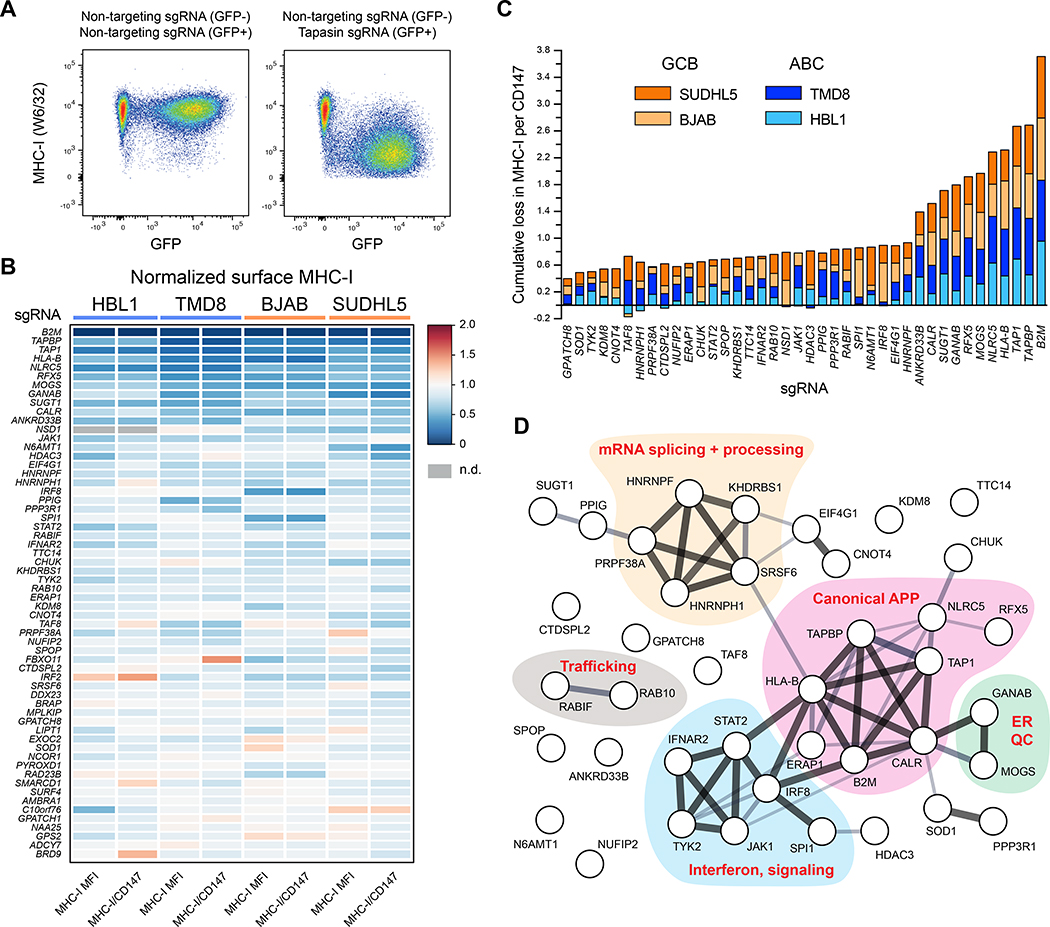
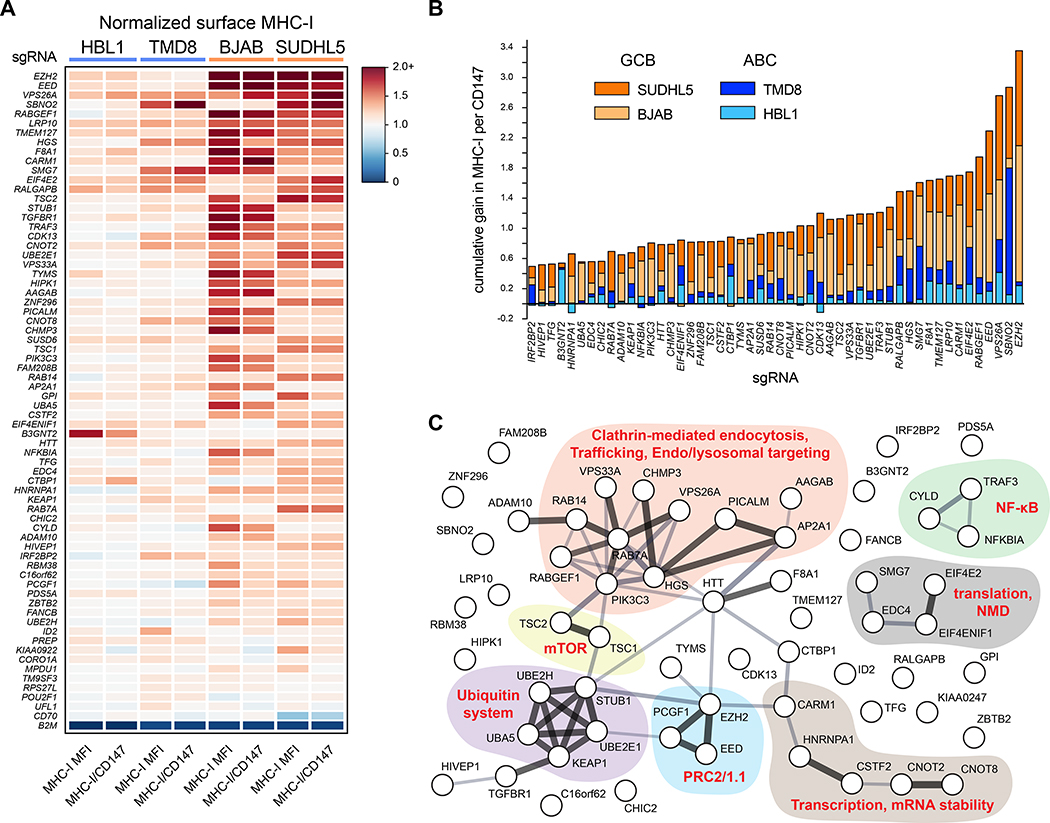
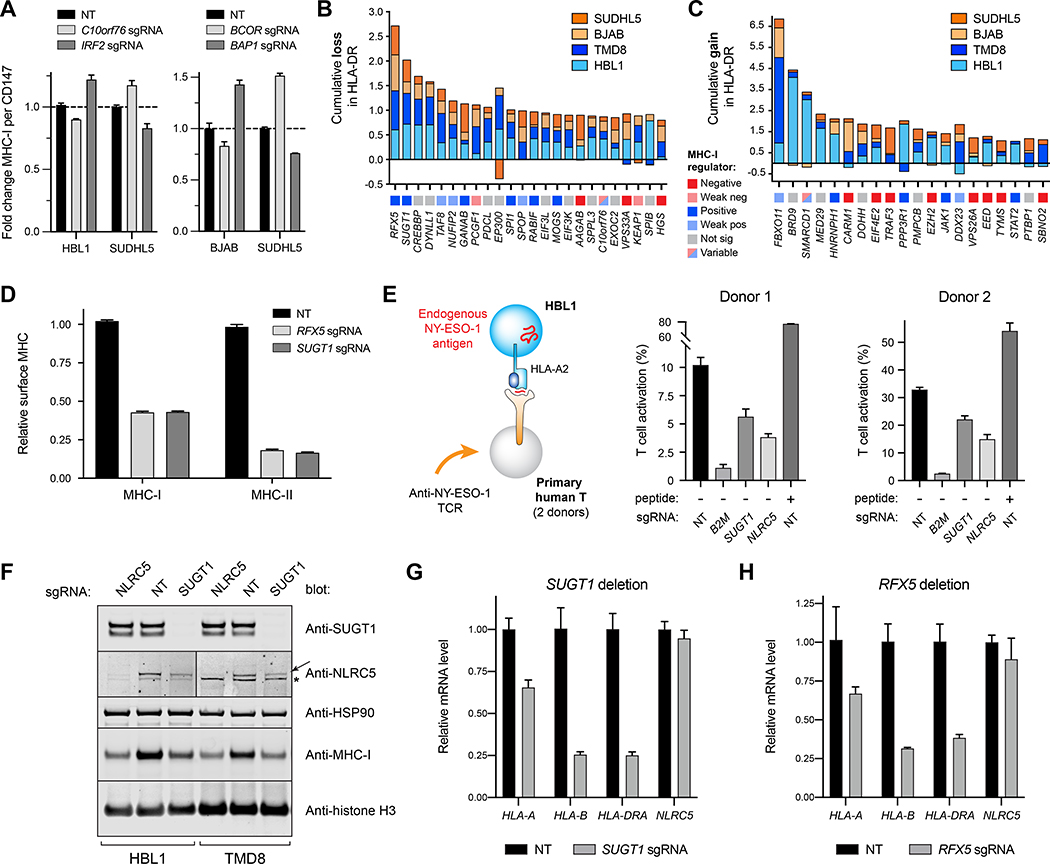
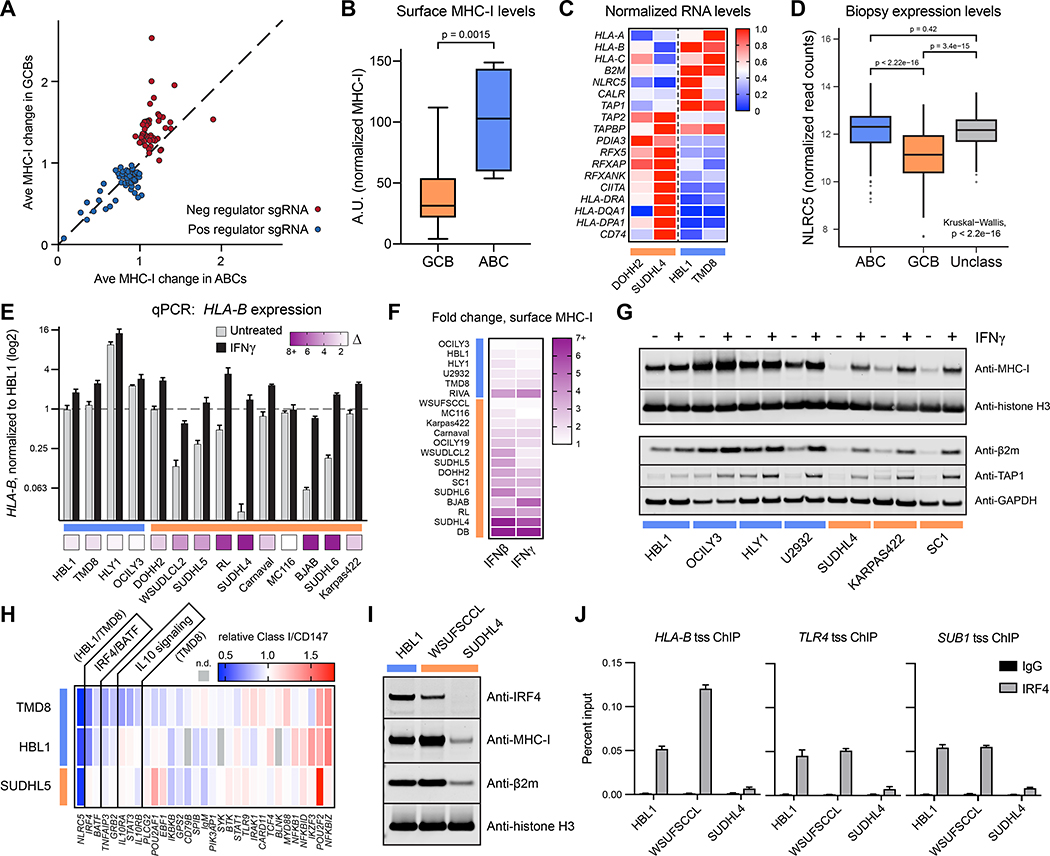
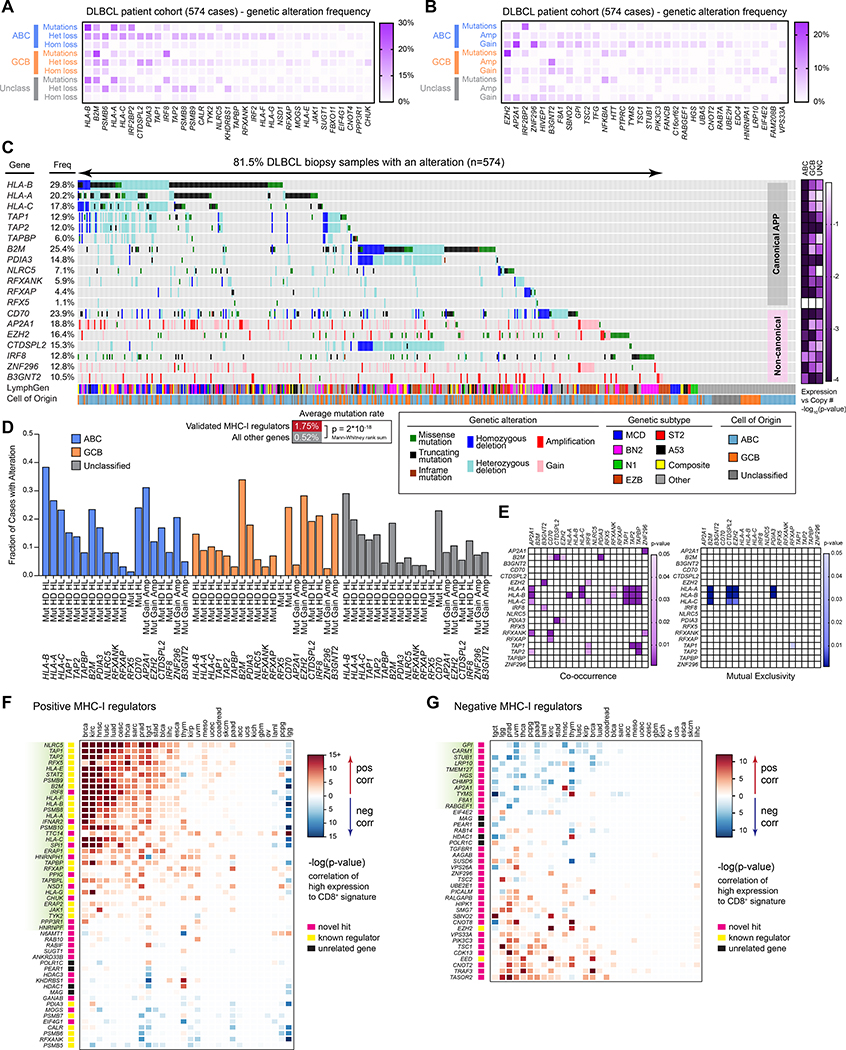
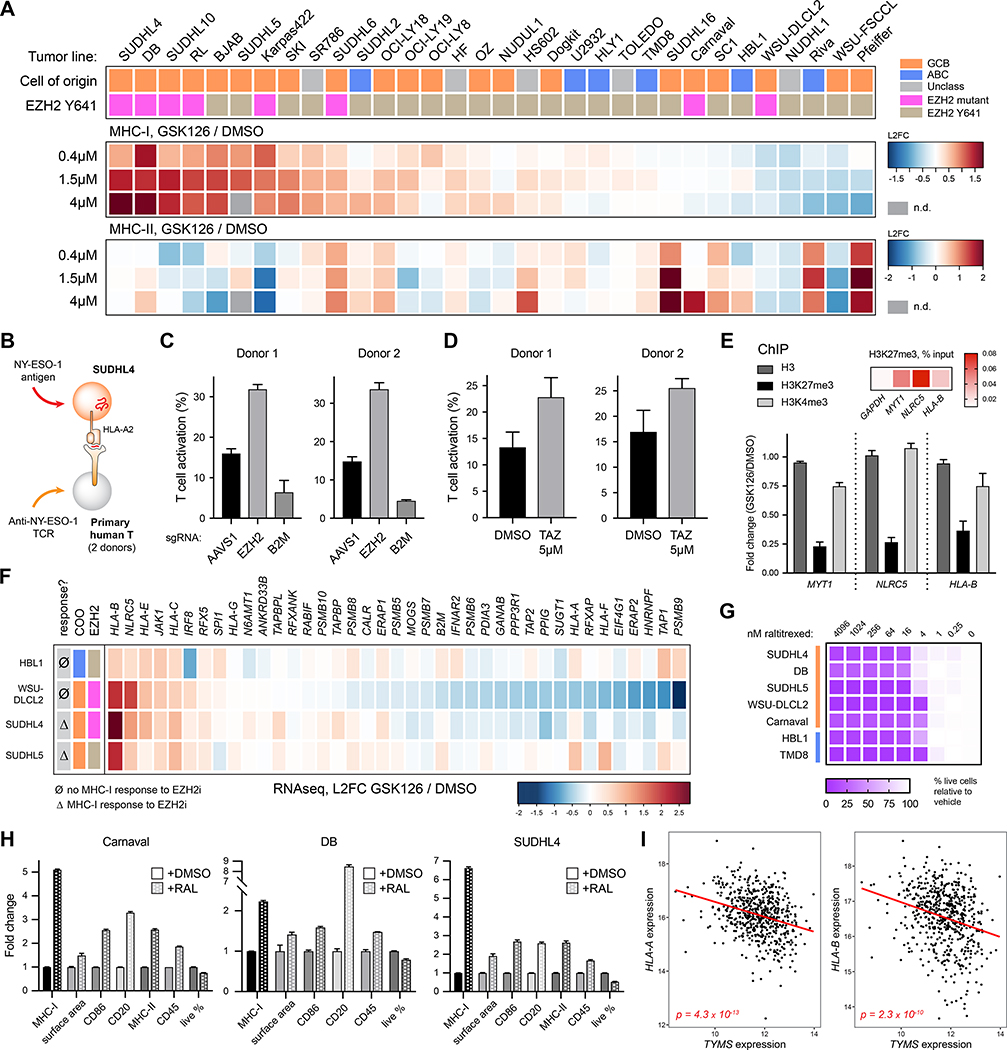
Tumors frequently subvert major histocompatibility complex class I (MHC-I) peptide presentation to evade CD8+ T cell immunosurveillance, though how this is accomplished is not always well defined. To identify the global regulatory networks controlling antigen presentation, we employed genome-wide screening in human diffuse large B cell lymphomas (DLBCLs). This approach revealed dozens of genes that positively and negatively modulate MHC-I cell surface expression. Validated genes clustered in multiple pathways including cytokine signaling, mRNA processing, endosomal trafficking, and protein metabolism. Genes can exhibit lymphoma subtype- or tumor-specific MHC-I regulation, and a majority of primary DLBCL tumors displayed genetic alterations in multiple regulators. We established SUGT1 as a major positive regulator of both MHC-I and MHC-II cell surface expression. Further, pharmacological inhibition of two negative regulators of antigen presentation, EZH2 and thymidylate synthase, enhanced DLBCL MHC-I presentation. These and other genes represent potential targets for manipulating MHC-I immunosurveillance in cancers, infectious diseases, and autoimmunity.

Keywords: EZH2; HLA class I; MHC class I; MHC class II; SUGT1; antigen presentation; diffuse large B cell lymphoma; immunoevasion; immunotherapy; thymidylate synthase.


Conflict of interest statement

Declaration of Interests N.P.R. and R.J.K. are now employees of Lyell Immunopharma and hold equity.

Figures

Figure 1.
Figure 1.. Genome-wide screens identify regulators of MHC-I in DLBCL.
(A) Overview of the CRISPR/Cas9 screens used to identify regulators of MHC-I in diffuse large B-cell lymphoma tumor lines. (B) Example flow cytometry histograms for sorted MHC-Ilo and MHC-Ihi cells (1°, primary sort; 2°, secondary sort). (C) STARS statistical confidence is plotted against segregation score of each gene in the sorted populations relative to input controls. Negative segregation score: sgRNAs enriched in MHC-Ilo population; positive segregation score: sgRNAs enriched in MHC-Ihi population. (D) (left) Venn diagram of top gene deletions from the MHC-Ilo analyses in four tumor lines. (right) Schematic depicting some genes known in APP and their identifications in the CRISPR screens – coloring refers to Venn diagram colors. (E) Venn diagram of top gene deletions from the MHC-Ihi analyses.
Figure 2.
Figure 2.. Validation of positive regulators of MHC-I.
(A) Example dot plots of how individual genetic ablations were tested for MHC-I effects. Cells were independently infected with lentiviruses encoding targeting or non-targeting sgRNAs in GFP+ or GFP backbones. Post-selection, cells were mixed and analyzed together by flow cytometry. GFP and GFP+ populations were used to quantify remaining surface MHC-I. (B) Validations of positive regulators of MHC-I. 60 of the top performing sgRNAs across four parental tumor lines are displayed as a heatmap of surface MHC-I expression relative to non-targeting sgRNAs. Also shown are quantifications of MHC-I per CD147, an unrelated surface protein. Note that not every previously known regulator was reanalyzed (e.g., TAP2, RFXAP). (C) Cumulative loss in MHC-I per CD147 upon the indicated genetic ablation across the four tumor lines. GCBs orange; ABCs blue. (D) STRING analysis of the validated positive regulators of MHC-I in DLBCL. See also Figure S1.
Figure 3.
Figure 3.. Validation of negative regulators of MHC-I.
(A) Validations of negative regulators of MHC-I. 69 sgRNAs across four parental tumor lines are displayed as a heatmap of surface MHC-I expression relative to non-targeting sgRNAs. The B2M sgRNA was included as a control for Cas9 activity and antibody staining. Also shown are quantifications of MHC-I per CD147, an unrelated surface protein. (B) Cumulative gain in MHC-I per CD147 upon the indicated genetic ablation across the four tumor lines. GCBs orange; ABCs blue. (C) STRING analysis of the validated negative regulators of MHC-I in DLBCL. See also Figure S1.
Figure 4.
Figure 4.. Specificity of MHC regulation and the role of SUGT1 in antigen presentation.
(A) Opposing effects of genetic deletions on surface MHC-I of different tumor lines measured by flow cytometry. (B) Top performing sgRNAs for the loss of surface HLA-DR, quantified cumulatively across different tumor cells. GCBs orange; ABCs blue. Each gene is also classified with its MHC-I regulator status (bottom boxes). (C) Same as B, but for cumulative gains in HLA-DR. (D) Effects of RFX5 or SUGT1 loss on the surface expression of MHC-I and MHC-II in TMD8. (E) (left) Schematic of T cell co-culture assay. HLA-A2+ HBL1 cells, which natively express the cancer testis antigen NY-ESO-1, were co-cultured with primary human T-cells transduced with a TCR recognizing the NY-ESO-1 peptide 157–165 restricted by HLA-A2. (right) T-cells were monitored for activation by 4–1BB upregulation after 12–14 hours with the indicated HBL1 cells. NT, non-targeting sgRNA. Peptide, exogenously added SLLMWITQV. T cells grown without target cells were manually set to 0% (1.14% average donor 1, 5.03% average donor 2). (F) NLRC5 or SUGT1 were deleted in HBL1 or TMD8 cells, and whole cell lysates were subjected to immunoblot analysis. Arrow, NLRC5. *, undetermined band from anti-NLRC5 antibody. See also Figure S2. (G) qPCR analysis of the indicated transcripts in TMD8 cells modified with NT or SUGT1 sgRNA. (H) Same as G, but with RFX5 deletion. For entire figure, bar graphs represent mean with standard deviations, minimum n = 3.
Figure 5.
Figure 5.. Activated B cell-like DLBCLs drive MHC-I antigen presentation.
(A) The fold change in surface MHC-I of a gene ablation is plotted as an average between GCBs (SUDHL5, BJAB) and between ABCs (HBL1, TMD8). The diagonal line indicates an equivalent response between the subtypes. (B) A panel of 20 DLBCL cell lines were measured for surface MHC-I by flow cytometry, and MFI were normalized to fluorescent beads. For entire figure: GCBs orange, ABCs blue. (C) mRNA was isolated from the indicated cells and subjected to RNAseq. Each transcript is normalized to the highest FPKM value of the four lines. (D) RNAseq was performed on DLBCL patient tumor biopsies, and NLRC5 gene expression is displayed as log transformed normalized read counts (n = 574 patients). (E) Cells were treated with 0 or 500U/mL IFNγ for 48 hours, at which point RNA was harvested for qPCR of HLA-B transcripts. Bottom boxes represent fold increase. (F) Cells were treated with 0 or 500U/mL of IFNβ or IFNγ and stained for surface MHC-I by flow cytometry after 48 hours. (G) Same as E, but whole cell lysates were extracted and analyzed by immunoblotting. (H) TMD8, HBL1, and SUDHL5 cells were transduced with sgRNA for the indicated genes, and surface MHC-I complexes were measured compared to non-targeting controls while cells retained viability. (I) DLBCL whole cell lysates were blotted with antibodies to the indicated proteins. (J) HLA-B, TLR4, and SUB1 transcriptional start site (tss) occupancy by IRF4 was examined by ChIP. For entire figure, means with standard deviations are plotted; minimum n = 3. See also Figure S3.
Figure 6.
Figure 6.. Genetic analyses of DLBCL cohort and pan-cancer T cell correlations.
(A) DLBCL biopsies were analyzed by whole exome-seq, RNA-seq, and targeted amplicon deep sequencing (Schmitz et al., 2018). Validated MHC-I positive regulators are indicated with their frequency of genetic alterations. (B) Same as A, but with validated negative regulators of MHC-I. (C) Oncoprinter diagram of DLBCL patient biopsy samples, indicating genetic alterations in each patient, their cell-of-origin (COO) subtype, and LymphGen classification (Wright et al., 2020). Right, −log(p-values) indicate likelihood of a non-zero slope from a linear regression of DNA copy number to gene expression (see Figure S4). (D) Frequency of genetic alterations in the indicated genes, separated by tumor COO categorization. Mut, mutation; HD, homozygous deletion; HL, heterozygous loss; gain, single copy gain; amp, multiple copy gain. (E) Co-occurrence and mutual exclusivity of genetic alterations. (F) Correlation of gene expression with CD8+ T cell signatures across TCGA cohorts. Red, positive T cell signature correlation. Blue, negative correlation. (G) Same as F, but for DLBCL negative regulator genes. See also Figure S5.
Figure 7.
Figure 7.. Pharmacological targeting of EZH2 and TS enhances tumor antigen presentation.
(A) Tumor lines were treated with the EZH2 inhibitor GSK126 for 7 days, and average fold increases of MHC-I and MHC-II are plotted by heatmap. Cells are categorized by their COO and EZH2 mutational status. (B) Schematic of T cell activation assay. NY-ESO-1 was transduced into the HLA-A2+ SUDHL4 tumor line. Primary human T cells were transduced with a TCR targeting the NY-ESO-1 peptide 157–165 bound to HLA-A2, and activation was measured after co-culture by 4–1BB upregulation. (C) SUDHL4-NY-ESO-1 cells were transduced with sgRNAs targeting AAVS1 (safe harbor, negative control), EZH2, or B2M; 9 days later, they were co-cultured with anti-NY-ESO-1 T cells. T cells grown without target cells were set to 0% (9.28% average donor 1; 2.19% average donor 2). (D) SUDHL4-NY-ESO-1 cells were treated with either DMSO or 5μM tazemetostat for 5 days, followed by washout of drug and subsequent co-culture with anti-NY-ESO-1 T cells. T cells grown without target cells were set to 0% (5.58% average donor 1, 13.27% average donor 2). (E) Chromatin immunoprecipitation (ChIP) for total histone H3, H3K27me3, and H3K4me3 was conducted in SUDHL4 cells +/− GSK126 pretreatment. Fold change is plotted for the indicated promoter amplicons. Heatmap at top right depicts the percent of transcript isolated compared to input. (F) Cells were treated with subtoxic doses of GSK126 for 4 days prior to RNA extraction and RNAseq. Plotted are transcript changes of positive MHC-I regulators. (G) DLBCLs were cultured with the TSi raltitrexed to determine growth inhibition after 48 hours. (H) Cells were treated with raltitrexed (RAL) or DMSO and stained for surface markers after 48 hours (Carnaval, 30nM; DB, 20nM; SUDHL4, 75nM). (I) TYMS expression vs. HLA-A or HLA-B expression in DLBCL patient tumor samples (log-transformed normalized read counts). For entire figure, bar graphs represent mean with standard deviations, minimum n = 3. See also Figure S7.

Similar articles

Cited by

References

    1. Alizadeh AA, Eisen MB, Davis RE, Ma C, Lossos IS, Rosenwald A, Boldrick JC, Sabet H, Tran T, Yu X, et al. (2000). Distinct types of diffuse large B-cell lymphoma identified by gene expression profiling. Nature 403, 503–511. - PubMed
    1. Alspach E, Lussier DM, Miceli AP, Kizhvatov I, DuPage M, Luoma AM, Meng W, Lichti CF, Esaulova E, Vomund AN, et al. (2019). MHC-II neoantigens shape tumour immunity and response to immunotherapy. Nature 574, 696–701. - PMC - PubMed
    1. Ansell SM, Minnema MC, Johnson P, Timmerman JM, Armand P, Shipp MA, Rodig SJ, Ligon AH, Roemer MGM, Reddy N, et al. (2019). Nivolumab for Relapsed/Refractory Diffuse Large B-Cell Lymphoma in Patients Ineligible for or Having Failed Autologous Transplantation: A Single-Arm, Phase II Study. J Clin Oncol 37, 481–489. - PMC - PubMed
    1. Aran D, Hu Z, and Butte AJ (2017). xCell: digitally portraying the tissue cellular heterogeneity landscape. Genome Biol 18, 220. - PMC - PubMed
    1. Berg RW, Werner M, Ferguson PJ, Postenka C, Vincent M, Koropatnick DJ, and Behrend E (2001). Tumor growth inhibition in vivo and G2/M cell cycle arrest induced by antisense oligodeoxynucleotide targeting thymidylate synthase. J Pharmacol Exp Ther 298, 477–484. - PubMed

Publication types

MeSH terms