

Identification and Characterization of a B-Raf Kinase α-Helix Critical for the Activity of MEK Kinase in MAPK Signaling
- PMID: 33272017
- PMCID: PMC8407401
- DOI: 10.1021/acs.biochem.0c00598
Identification and Characterization of a B-Raf Kinase α-Helix Critical for the Activity of MEK Kinase in MAPK Signaling
Abstract
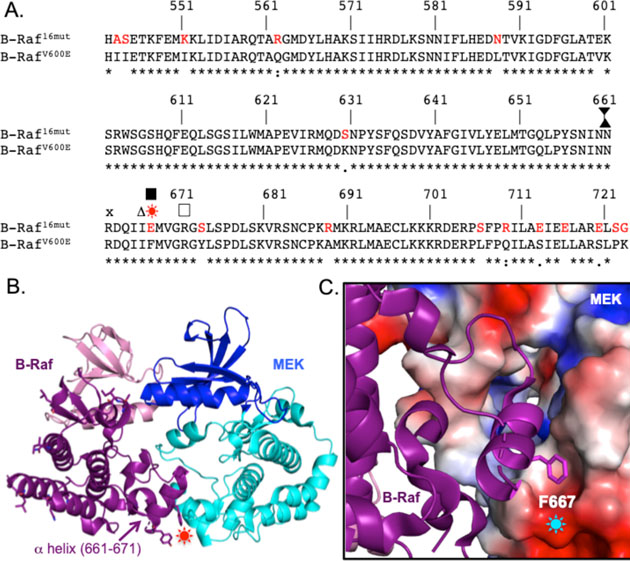
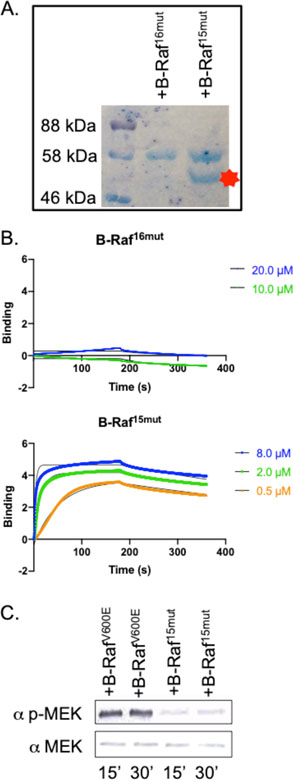
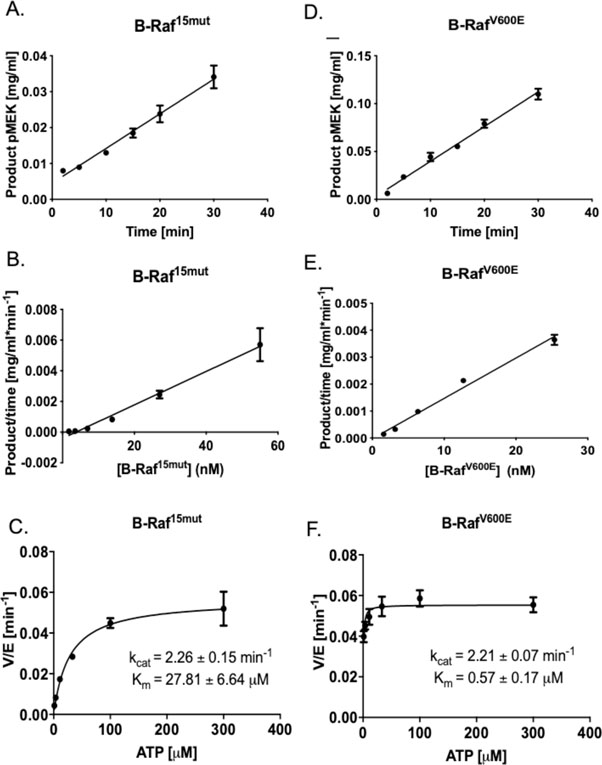
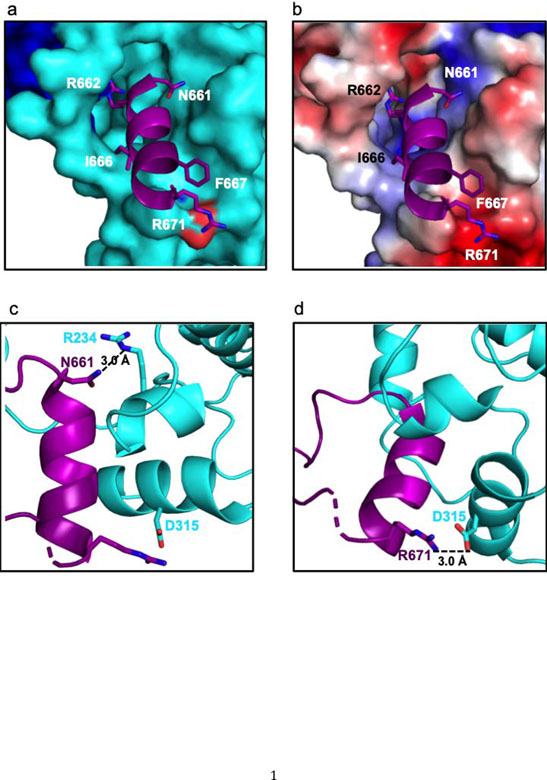
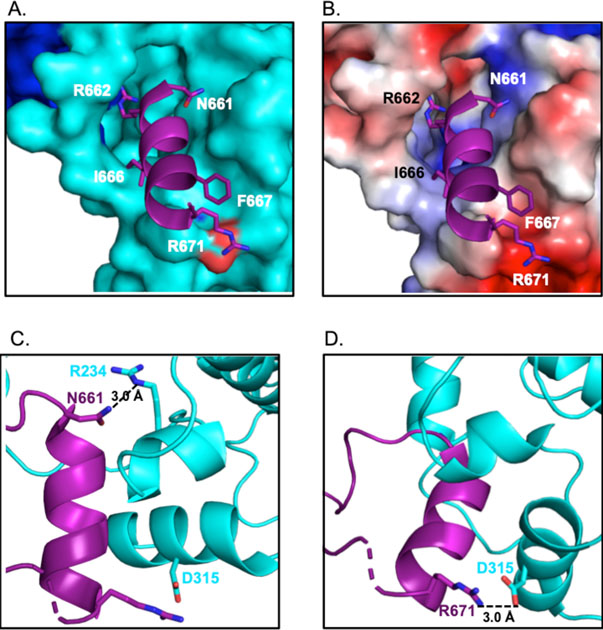
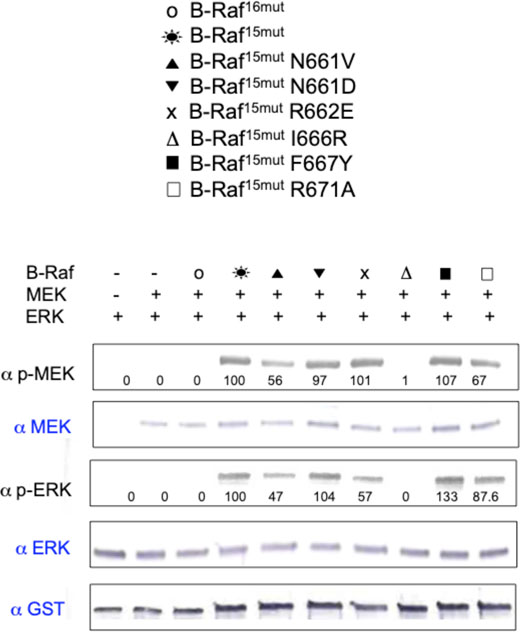
In the MAPK pathway, an oncogenic V600E mutation in B-Raf kinase causes the enzyme to be constitutively active, leading to aberrantly high phosphorylation levels of its downstream effectors, MEK and ERK kinases. The V600E mutation in B-Raf accounts for more than half of all melanomas and ∼3% of all cancers, and many drugs target the ATP binding site of the enzyme for its inhibition. Because B-Raf can develop resistance against these drugs and such drugs can induce paradoxical activation, drugs that target allosteric sites are needed. To identify other potential drug targets, we generated and kinetically characterized an active form of B-RafV600E expressed using a bacterial expression system. In doing so, we identified an α-helix on B-Raf, found at the B-Raf-MEK interface, that is critical for their interaction and the oncogenic activity of B-RafV600E. We assessed the binding between B-Raf mutants and MEK using pull downs and biolayer interferometry and assessed phosphorylation levels of MEK in vitro and in cells as well as its downstream target ERK to show that mutating certain residues on this α-helix is detrimental to binding and downstream activity. Our results suggest that this B-Raf α-helix binding site on MEK could be a site to target for drug development to treat B-RafV600E-induced melanomas.
Figures
Similar articles
-
Allosteric Kinase Inhibitors Reshape MEK1 Kinase Activity Conformations in Cells and In Silico.Biomolecules. 2021 Mar 30;11(4):518. doi: 10.3390/biom11040518. Biomolecules. 2021. PMID: 33808483 Free PMC article.
-
BRAF-inhibitor Associated MEK Mutations Increase RAF-Dependent and -Independent Enzymatic Activity.Mol Cancer Res. 2017 Oct;15(10):1431-1444. doi: 10.1158/1541-7786.MCR-17-0211. Epub 2017 Jun 27. Mol Cancer Res. 2017. PMID: 28655712
-
Enhanced inhibition of ERK signaling by a novel allosteric MEK inhibitor, CH5126766, that suppresses feedback reactivation of RAF activity.Cancer Res. 2013 Jul 1;73(13):4050-4060. doi: 10.1158/0008-5472.CAN-12-3937. Epub 2013 May 10. Cancer Res. 2013. PMID: 23667175 Free PMC article.
-
Targeting oncogenic Raf protein-serine/threonine kinases in human cancers.Pharmacol Res. 2018 Sep;135:239-258. doi: 10.1016/j.phrs.2018.08.013. Epub 2018 Aug 15. Pharmacol Res. 2018. PMID: 30118796 Review.
-
RAF-MEK-ERK pathway in cancer evolution and treatment.Semin Cancer Biol. 2022 Oct;85:123-154. doi: 10.1016/j.semcancer.2021.05.010. Epub 2021 May 13. Semin Cancer Biol. 2022. PMID: 33992782 Review.
Cited by
-
Structure-Based De Novo Design for the Discovery of Miniprotein Inhibitors Targeting Oncogenic Mutant BRAF.Int J Mol Sci. 2024 May 19;25(10):5535. doi: 10.3390/ijms25105535. Int J Mol Sci. 2024. PMID: 38791574 Free PMC article.
-
Comprehensive analysis of crystal structure, spectroscopic properties, quantum chemical insights, and molecular docking studies of two pyrazolopyridine compounds: potential anticancer agents.RSC Adv. 2023 Oct 16;13(43):30118-30128. doi: 10.1039/d3ra04874h. eCollection 2023 Oct 11. RSC Adv. 2023. PMID: 37849708 Free PMC article.
-
Mechanism of activation and the rewired network: New drug design concepts.Med Res Rev. 2022 Mar;42(2):770-799. doi: 10.1002/med.21863. Epub 2021 Oct 25. Med Res Rev. 2022. PMID: 34693559 Free PMC article. Review.
-
The mechanism of activation of monomeric B-Raf V600E.Comput Struct Biotechnol J. 2021 Jun 4;19:3349-3363. doi: 10.1016/j.csbj.2021.06.007. eCollection 2021. Comput Struct Biotechnol J. 2021. PMID: 34188782 Free PMC article.
References
-
- Dhillon AS, Hagan S, Rath O, and Kolch W (2007) MAP kinase signalling pathways in cancer, Oncogene 26, 3279–3290. - PubMed
-
- Murphy LO, and Blenis J (2006) MAPK signal specificity: the right place at the right time, Trends Biochem Sci 31, 268–275. - PubMed
-
- Lowy DR, and Willumsen BM (1993) Function and regulation of ras, Annu Rev Biochem 62, 851–891. - PubMed
-
- Vojtek AB, and Der CJ (1998) Increasing complexity of the Ras signaling pathway, J Biol Chem 273, 19925–19928. - PubMed
Publication types
MeSH terms
Substances
Grants and funding
LinkOut - more resources
Full Text Sources
Research Materials
Miscellaneous
