. 2020 Dec 3;11(1):521.
doi: 10.1186/s13287-020-02035-5.

Comparison of two ASC-derived therapeutics in an in vitro OA model: secretome versus extracellular vesicles

Affiliations

Comparison of two ASC-derived therapeutics in an in vitro OA model: secretome versus extracellular vesicles

Chiara Giannasi et al. Stem Cell Res Ther. .

Abstract

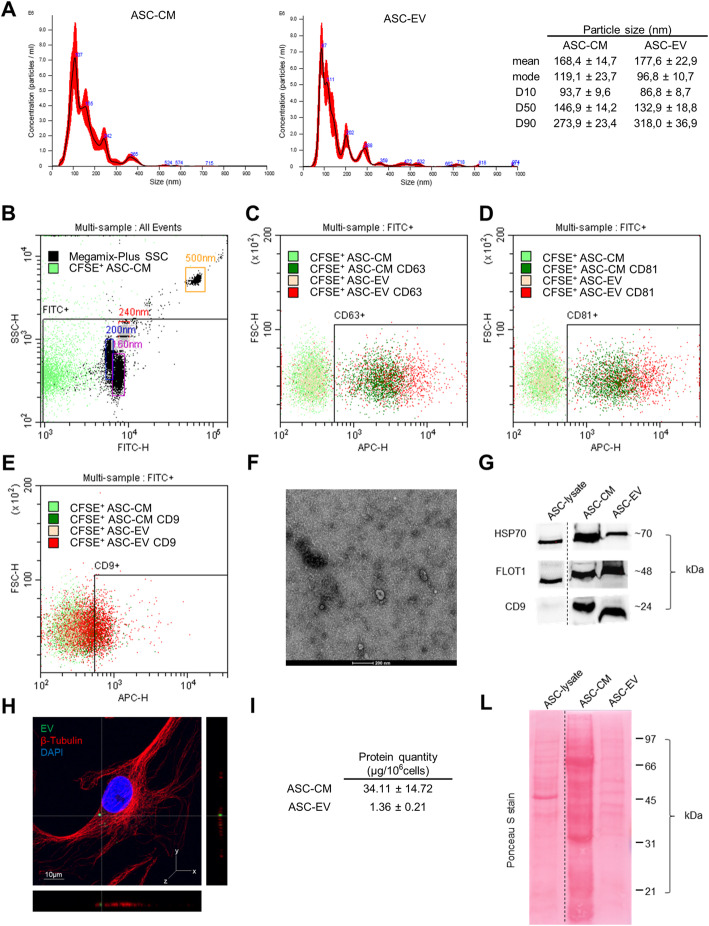
Background: In the last years, several clinical trials have proved the safety and efficacy of adipose-derived stem/stromal cells (ASC) in contrasting osteoarthritis (OA). Since ASC act mainly through paracrine mechanisms, their secretome (conditioned medium, CM) represents a promising therapeutic alternative. ASC-CM is a complex cocktail of proteins, nucleic acids, and lipids released as soluble factors and/or conveyed into extracellular vesicles (EV). Here, we investigate its therapeutic potential in an in vitro model of OA.

Methods: Human articular chondrocytes (CH) were induced towards an OA phenotype by 10 ng/ml TNFα in the presence of either ASC-CM or EV, both deriving from 5 × 10⁵ cells, to evaluate the effect on hypertrophic, catabolic, and inflammatory markers.

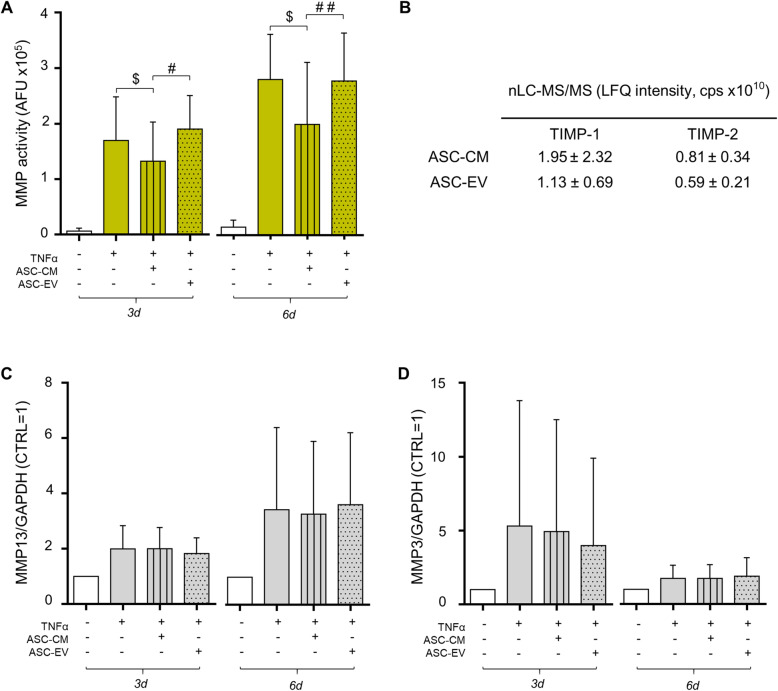
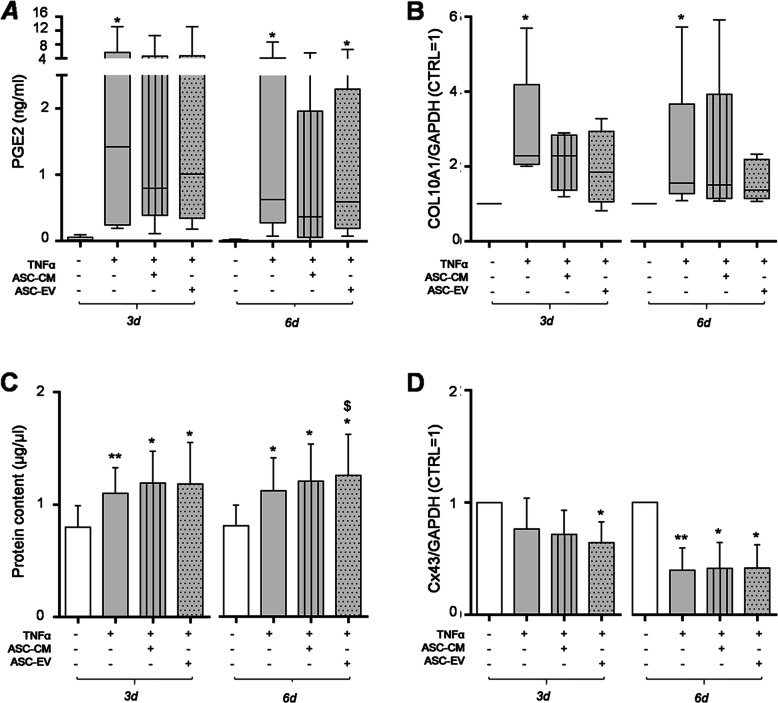
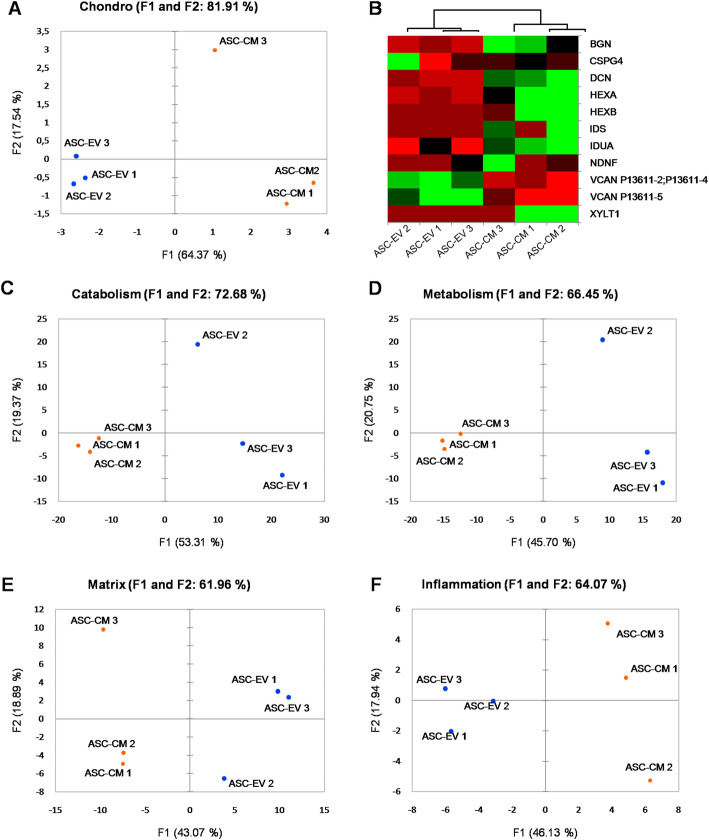
Results: Given the same number of donor cells, our data reveal a higher therapeutic potential of ASC-CM compared to EV alone that was confirmed by its enrichment in chondroprotective factors among which TIMP-1 and -2 stand out. In details, only ASC-CM significantly decreased MMP activity (22% and 29% after 3 and 6 days) and PGE2 expression (up to 40% at day 6) boosted by the inflammatory cytokine. Conversely, both treatments down-modulated of ~ 30% the hypertrophic marker COL10A1.

Conclusions: These biological and molecular evidences of ASC-CM beneficial action on CH with an induced OA phenotype may lay the basis for its future clinical translation as a cell-free therapeutic in the management of OA.

Keywords: Adipose-derived stem/stromal cells; Chondrocytes; Extracellular vesicles; Hypertrophy; MMP; Osteoarthritis; PGE2; Secretome.


Conflict of interest statement

The authors declare that they have no competing interests.

Figures

Fig. 1
Fig. 1
Characterization of ASC-CM and -EV. a Representative images of NTA referred to ASC-CM (left) and ASC-EV (right). The table shows the dimensional parameters of the samples expressed as mean ± SD of 6 NTA measurements. b Flow cytometer calibration with standard beads and CFSE+ ASC-CM. The FITC+ gate encloses the coordinates in SSC-H and FITC-H channels where to expect the events of interest. ce CD63, CD81, and CD9 staining of representative CFSE+ ASC-CM and ASC-EV samples. f Transmission electron microscopy image showing the characteristic morphology of EV. The scale bar indicates 200 nm. g Representative Western blot of ASC-CM and EV lysates deriving from 106 ASC. Cell lysate from 5 × 104 ASC is shown as control. h Laser scanning confocal microscopy of CH treated with ASCGFP+-EV for 3 days. β-Tubulin was revealed with an Alexa Fluor® 568 conjugated antibody (red), nuclei were stained with DAPI (blue) (magnification × 63). The scale bar indicates 10 μm and the orthogonal views were obtained by Fiji software. i Total protein content per million ASC (μg/106 cells). Data are shown as mean ± SD (n = 4). l Ponceau S staining of ASC-CM and -EV lysates from 106 ASC. Cell lysate from 5 × 104 ASC is also shown
Fig. 2
Fig. 2
Reduction of MMP activity by ASC-CM, TIMP quantification, and MMP expression. a MMP activity, analyzed in CH culture medium (n = 7 independent experiments) 3 and 6 days after the treatments, is expressed as arbitrary fluorescence units (AFU). All conditions statistically differ from control (at day 3: TNF p < .01, TNF+ASC-CM p < .05, and TNF+ASC-EV p < .001; at day 6: TNF p < .001, TNF+ASC-CM p < .05, and TNF+ASC-EV p < .001). Significance vs 10 ng/ml TNFα is shown as $p < .05; vs ASC-EV as #p < .05, ##p < .01. b TIMP-1 and 2 data are expressed as label-free quantification (LFQ) intensity, count per second (cps) from differential proteomic analysis of 20 μg of ASC-CM and -EV proteins. Means ± SD (n = 3) are shown. c, d Quantification of the expression of MMP-13 (c) and MMP-3 (d) in TNFα-stimulated and ASC-CM- or -EV-treated CH at day 3 and 6 analyzed by Western blot. Data (n = 5 independent experiments) were normalized on GAPDH and expressed as relative values (CTRL = 1)
Fig. 3
Fig. 3
Hypertrophy and inflammatory markers induced by TNFα treatment. a PGE2 levels, quantified in CH culture medium at day 3 and 6 after treatments, are expressed as ng/ml (n = 6 independent experiments). b COL10A1 expression by Western blot analysis. Data (n = 5 independent experiments) were normalized on GAPDH and shown as relative values (CTRL = 1). Data in a and b were analyzed by Friedman’s test followed by Dunn’s multiple comparison test and significance vs CTRL is shown as *p < .05. For each column, the box extends from the 25th to 75th percentiles, the line in the middle is plotted at the median while the whiskers indicate minimum and maximum value. c CH protein concentration at day 3 and 6 (left and right panel, respectively). Significance vs CTRL is shown as *p < .05 and **p < .01; vs 10 ng/ml TNFα as $p < .05 (n = 7 independent experiments). d Cx43 expression by Western blot. Data (n = 5 independent experiments) were normalized on GAPDH and expressed as relative values (CTRL = 1). Significance vs CTRL is shown as *p < .05 and **p < .01
Fig. 4
Fig. 4
PCA and heat map of chondroitin sulfate-related factors. PCA plots of the samples based on 10 chondroitin sulfate- (a), 56 inflammation- (c), 425 catabolism- (d), 459 metabolism- (e), and 169 matrix- (f) mapped gene names. Color scale: red (down-represented) to green (up-represented) through black. (b) Heat map for the chondroitin sulfate process-associated genes, constructed on the basis of protein abundance levels estimated by nLC-MS/MS in 3 ASC-CM (ASC-CM 1-3) and 3 ASC-EV (ASC-EV 1-3) samples. Principal component analysis (PCA) and heat maps were obtained using XLSTAT software. F1 and F2, factor 1 and 2

References

    1. Salmon JH, Rat AC, Sellam J, Michel M, Eschard JP, Guillemin F, et al. Economic impact of lower-limb osteoarthritis worldwide: a systematic review of cost-of-illness studies. Osteoarthr Cartil. 2016;24(9):1500–1508. doi: 10.1016/j.joca.2016.03.012. - DOI - PubMed
    1. Goldring SR, Goldring MB. Changes in the osteochondral unit during osteoarthritis: structure, function and cartilage-bone crosstalk. Nat Rev Rheumatol. 2016;12(11):632–644. doi: 10.1038/nrrheum.2016.148. - DOI - PubMed
    1. Berenbaum F. Osteoarthritis as an inflammatory disease (osteoarthritis is not osteoarthrosis!) Osteoarthr Cartil. 2013;21(1):16–21. doi: 10.1016/j.joca.2012.11.012. - DOI - PubMed
    1. McAlindon TE, Bannuru RR, Sullivan MC, Arden NK, Berenbaum F, Bierma-Zeinstra SM, et al. OARSI guidelines for the non-surgical management of knee osteoarthritis. Osteoarthr Cartil. 2014;22(3):363–388. doi: 10.1016/j.joca.2014.01.003. - DOI - PubMed
    1. Ragni E, Mangiavini L, Viganò M, Brini AT, Peretti GM, Banfi G, de Girolamo L. Management of Osteoarthritis During the COVID-19 Pandemic. Clin Pharmacol Ther. 2020;108(4):719-29. 10.1002/cpt.1910. - PMC - PubMed

Publication types

Substances