. 2021 Jan 15;371(6526):eaaw0843.
doi: 10.1126/science.aaw0843. Epub 2020 Dec 3.

Noncanonical transnitrosylation network contributes to synapse loss in Alzheimer's disease

Affiliations

Noncanonical transnitrosylation network contributes to synapse loss in Alzheimer's disease

Tomohiro Nakamura et al. Science. .

Abstract

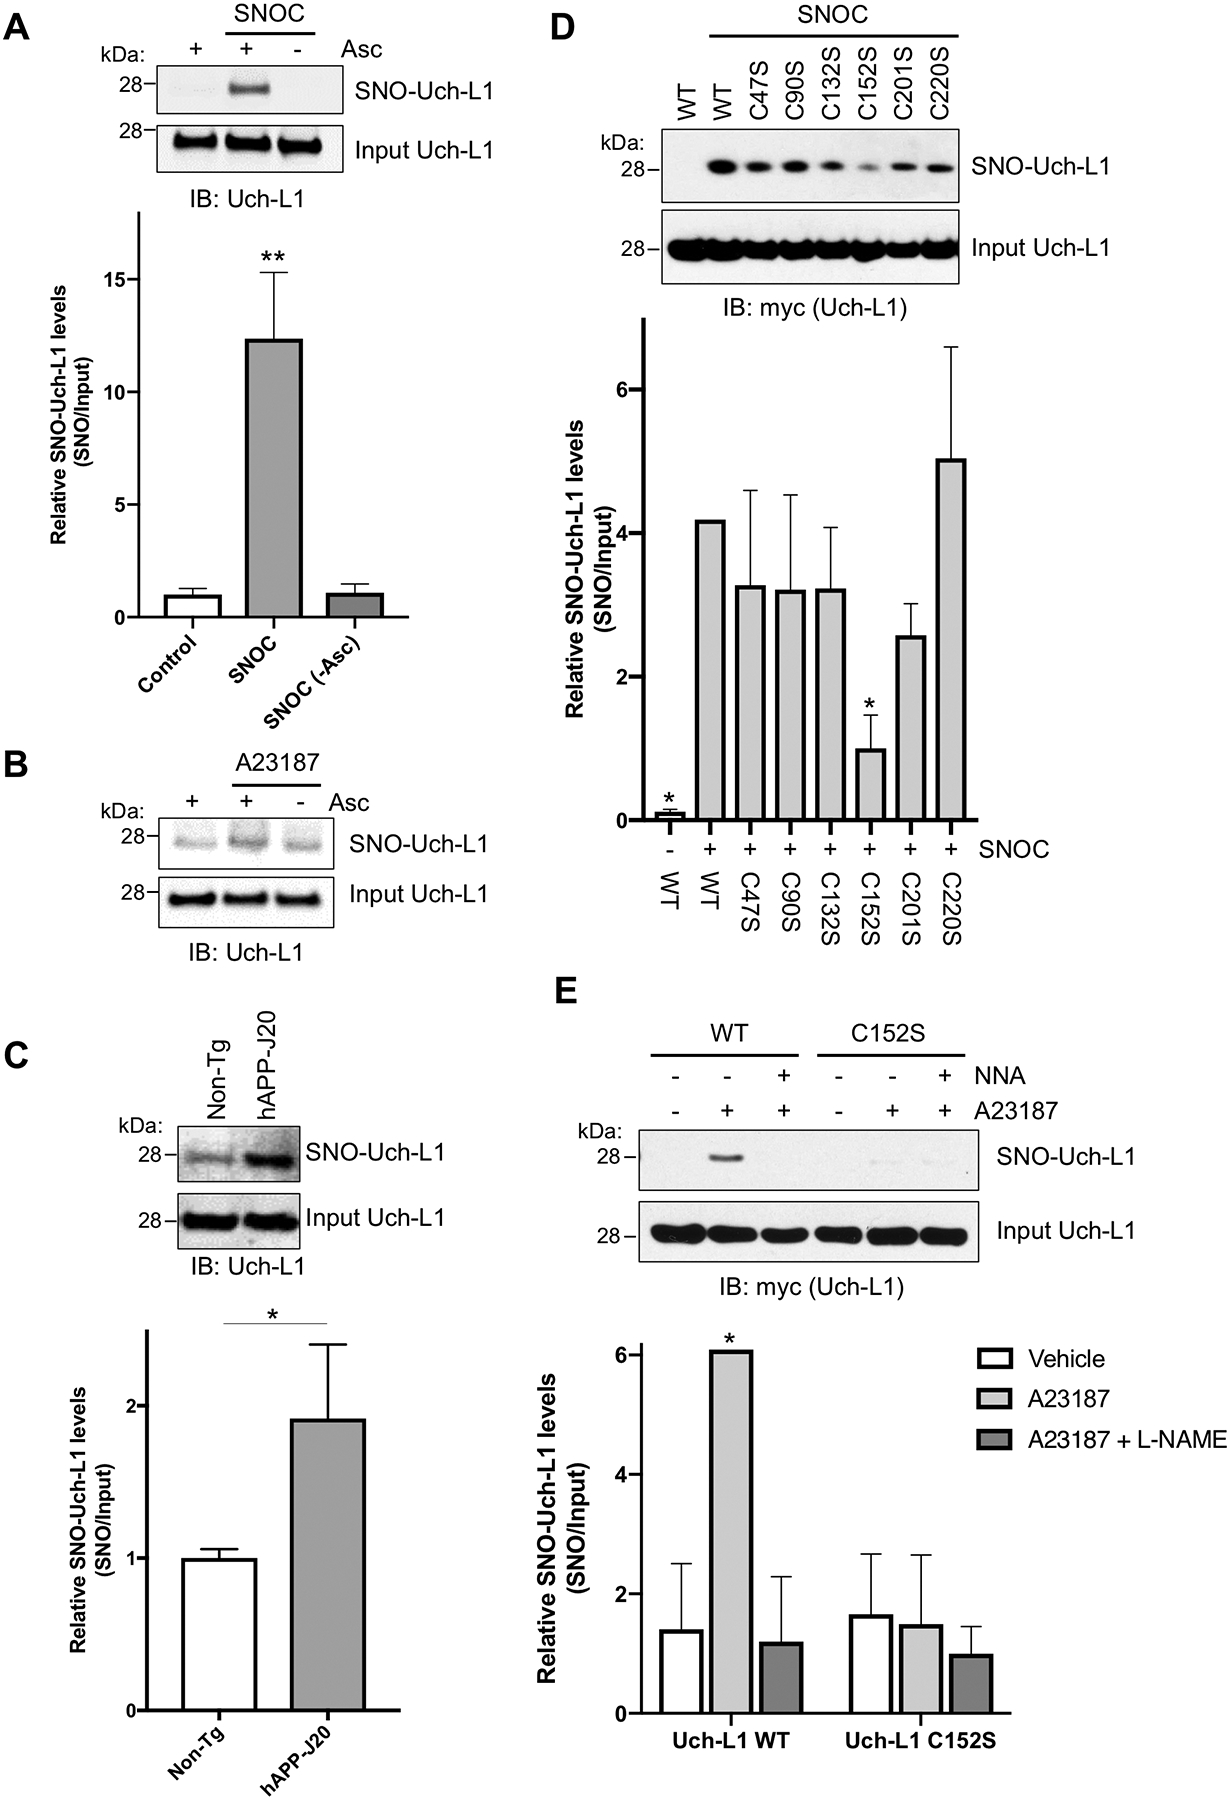
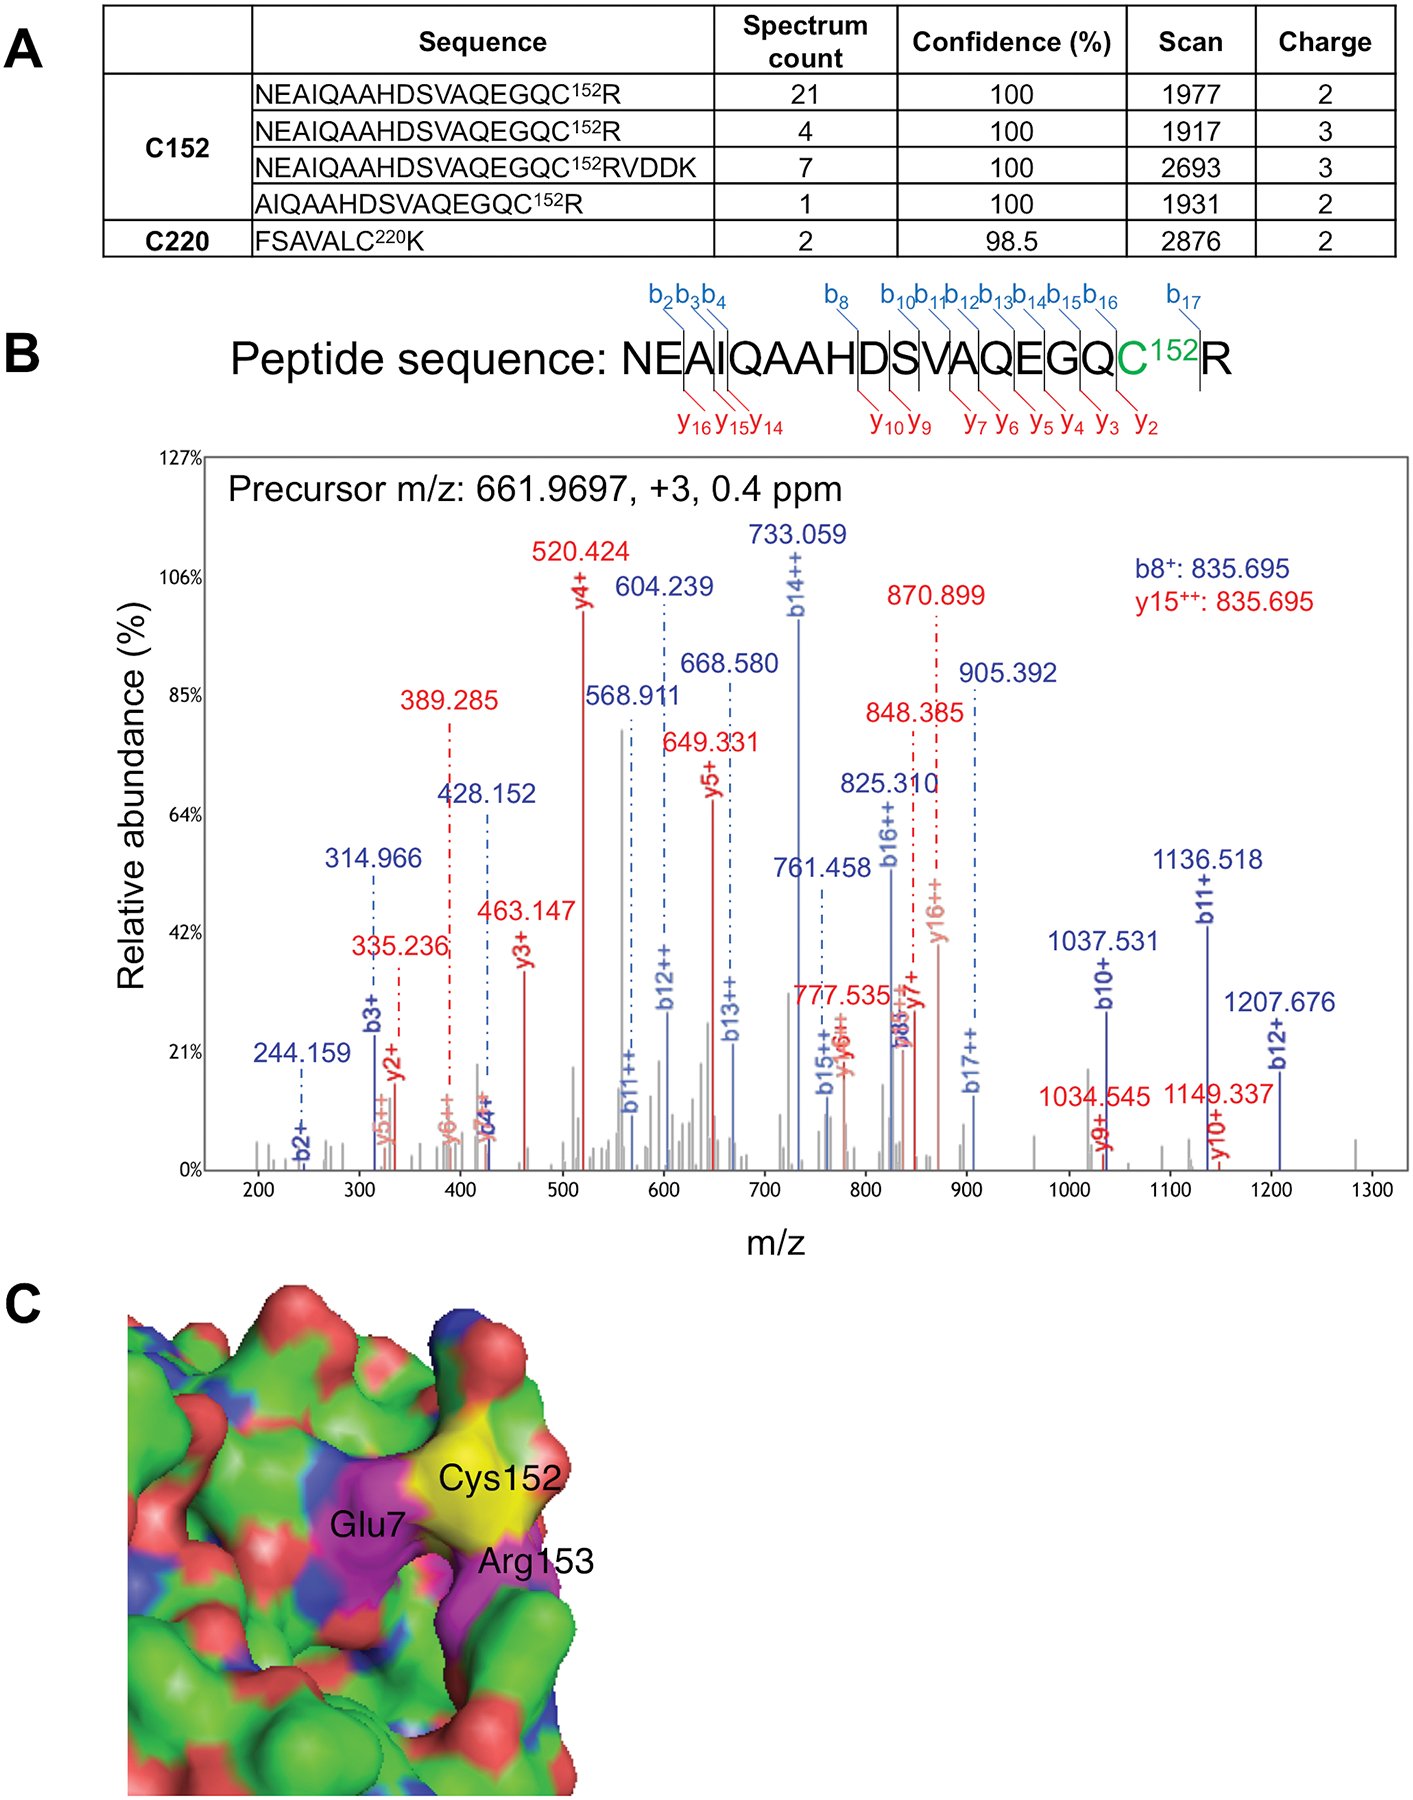
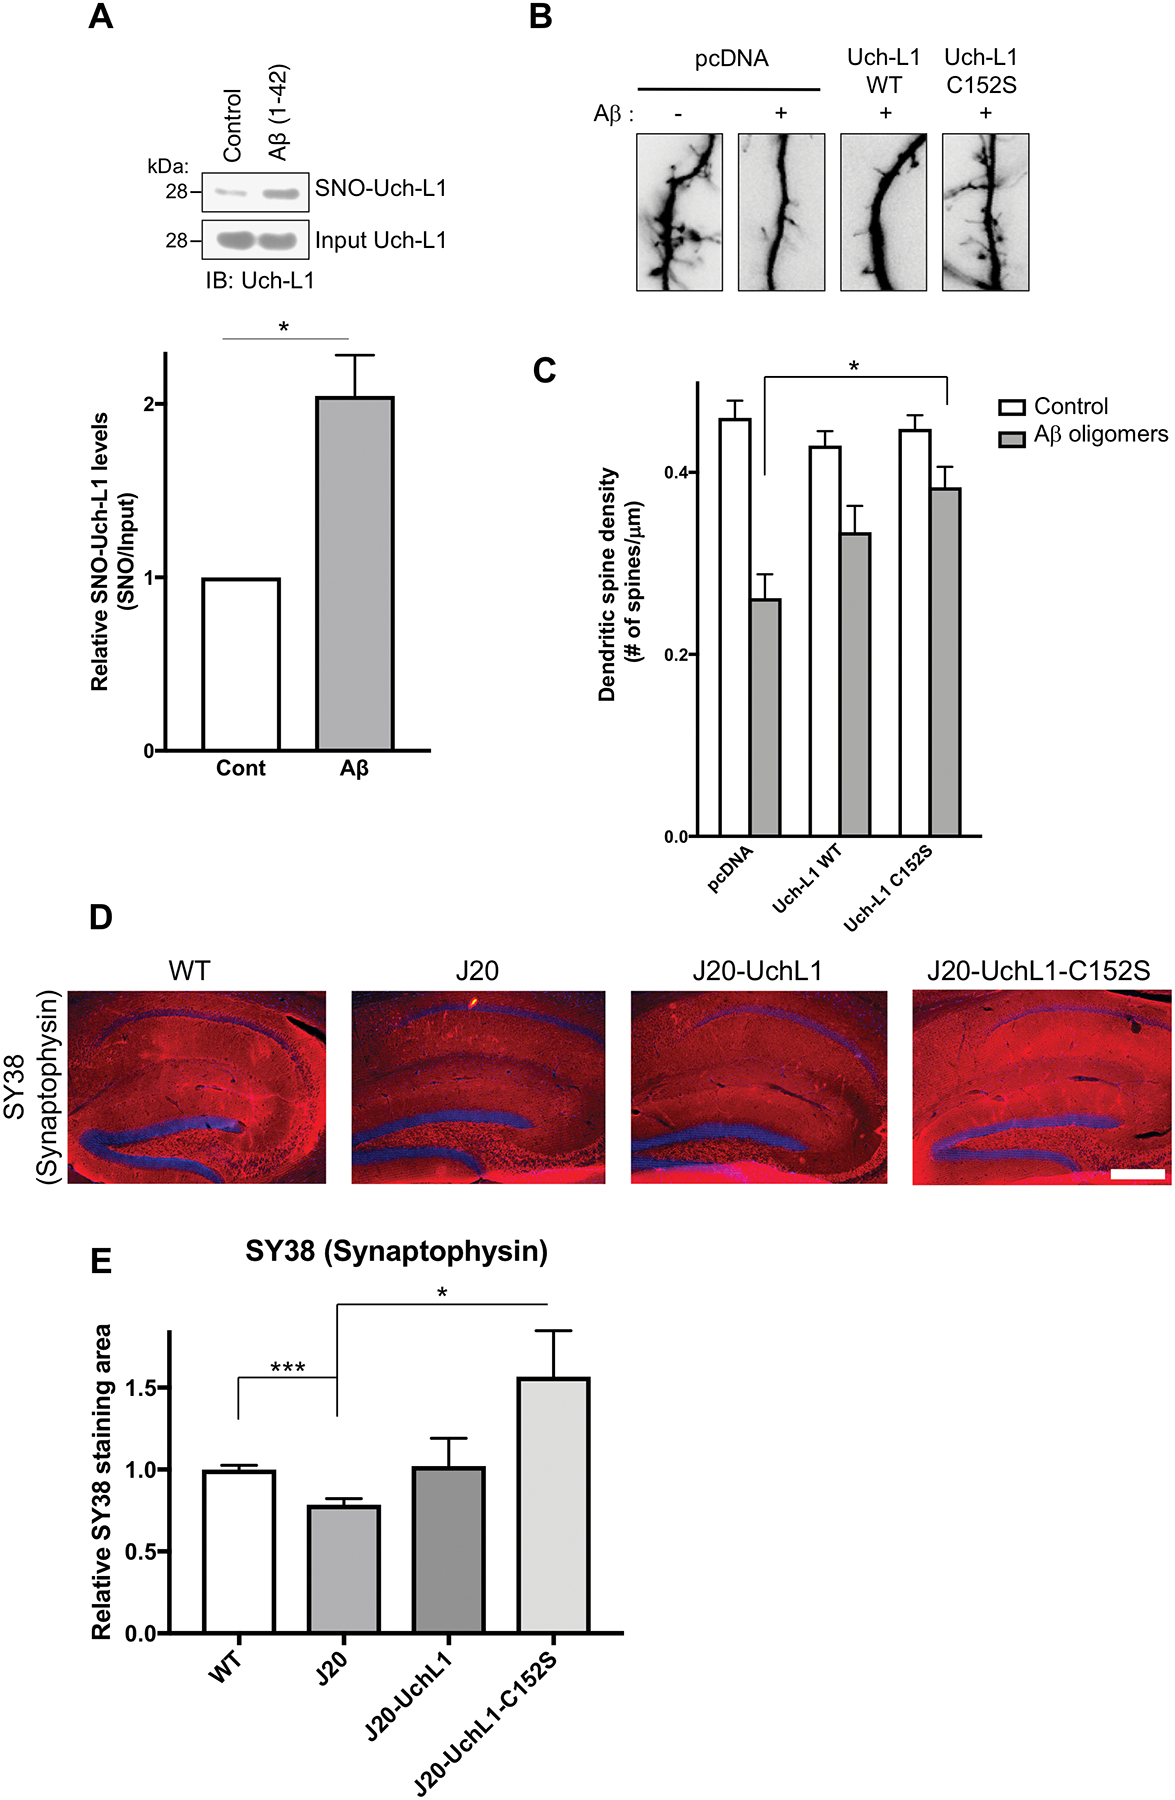
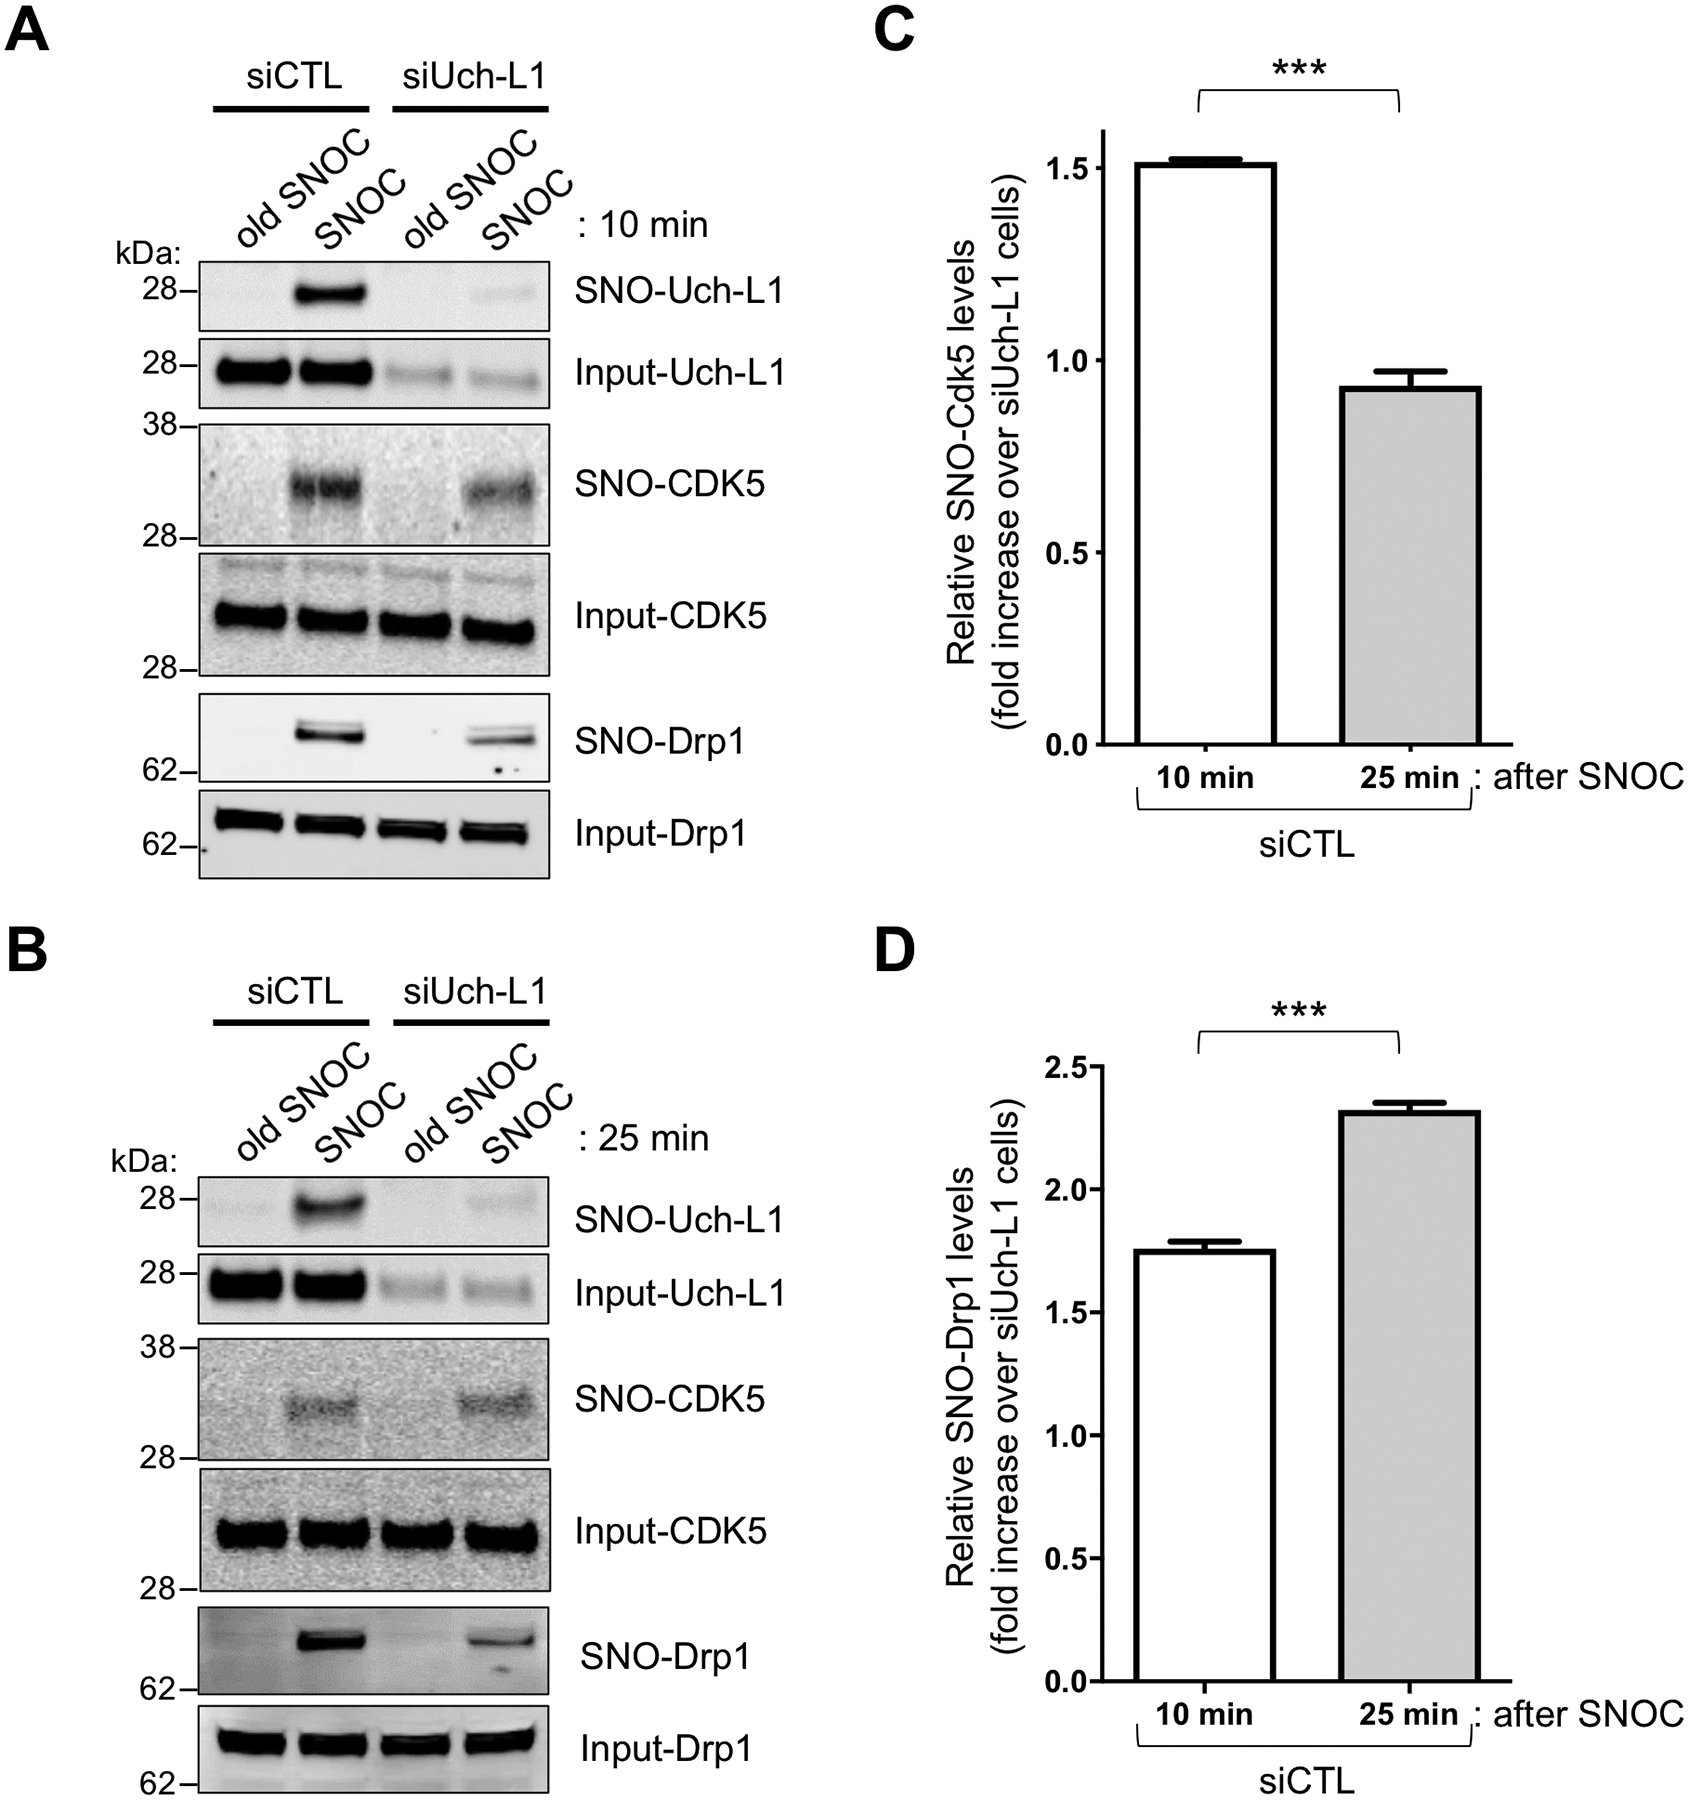
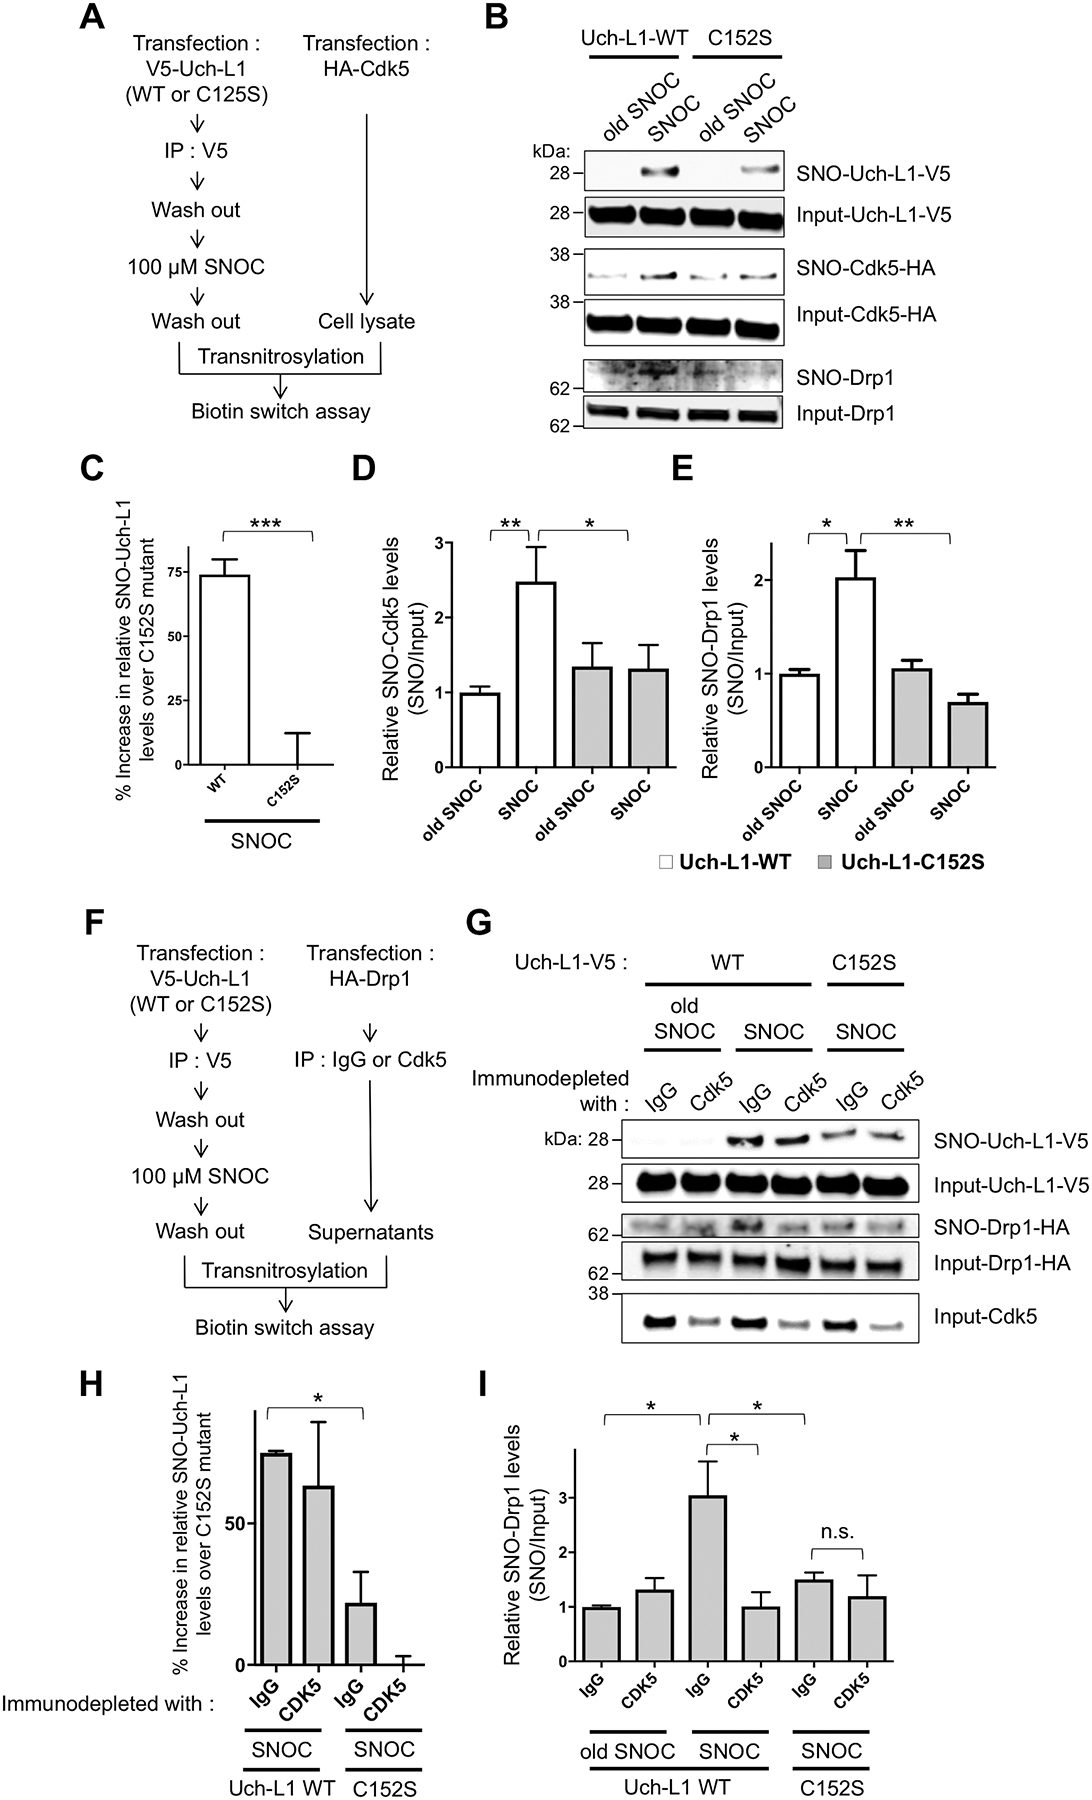
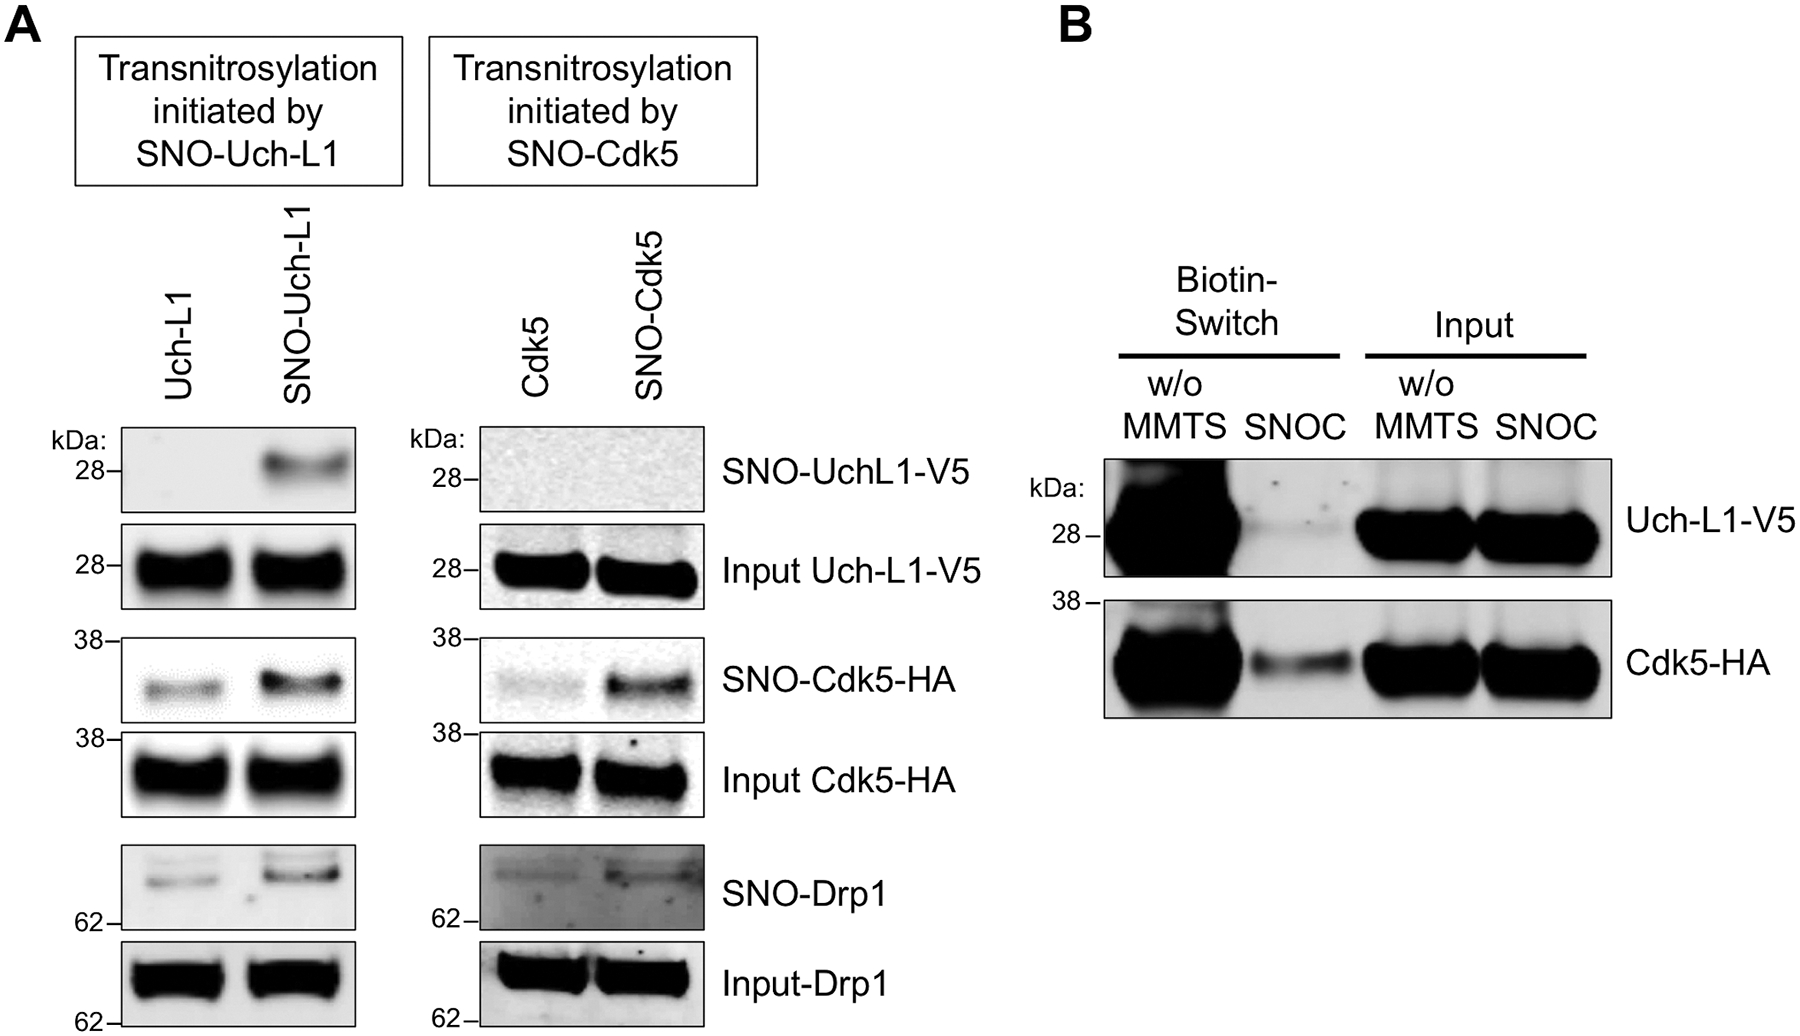
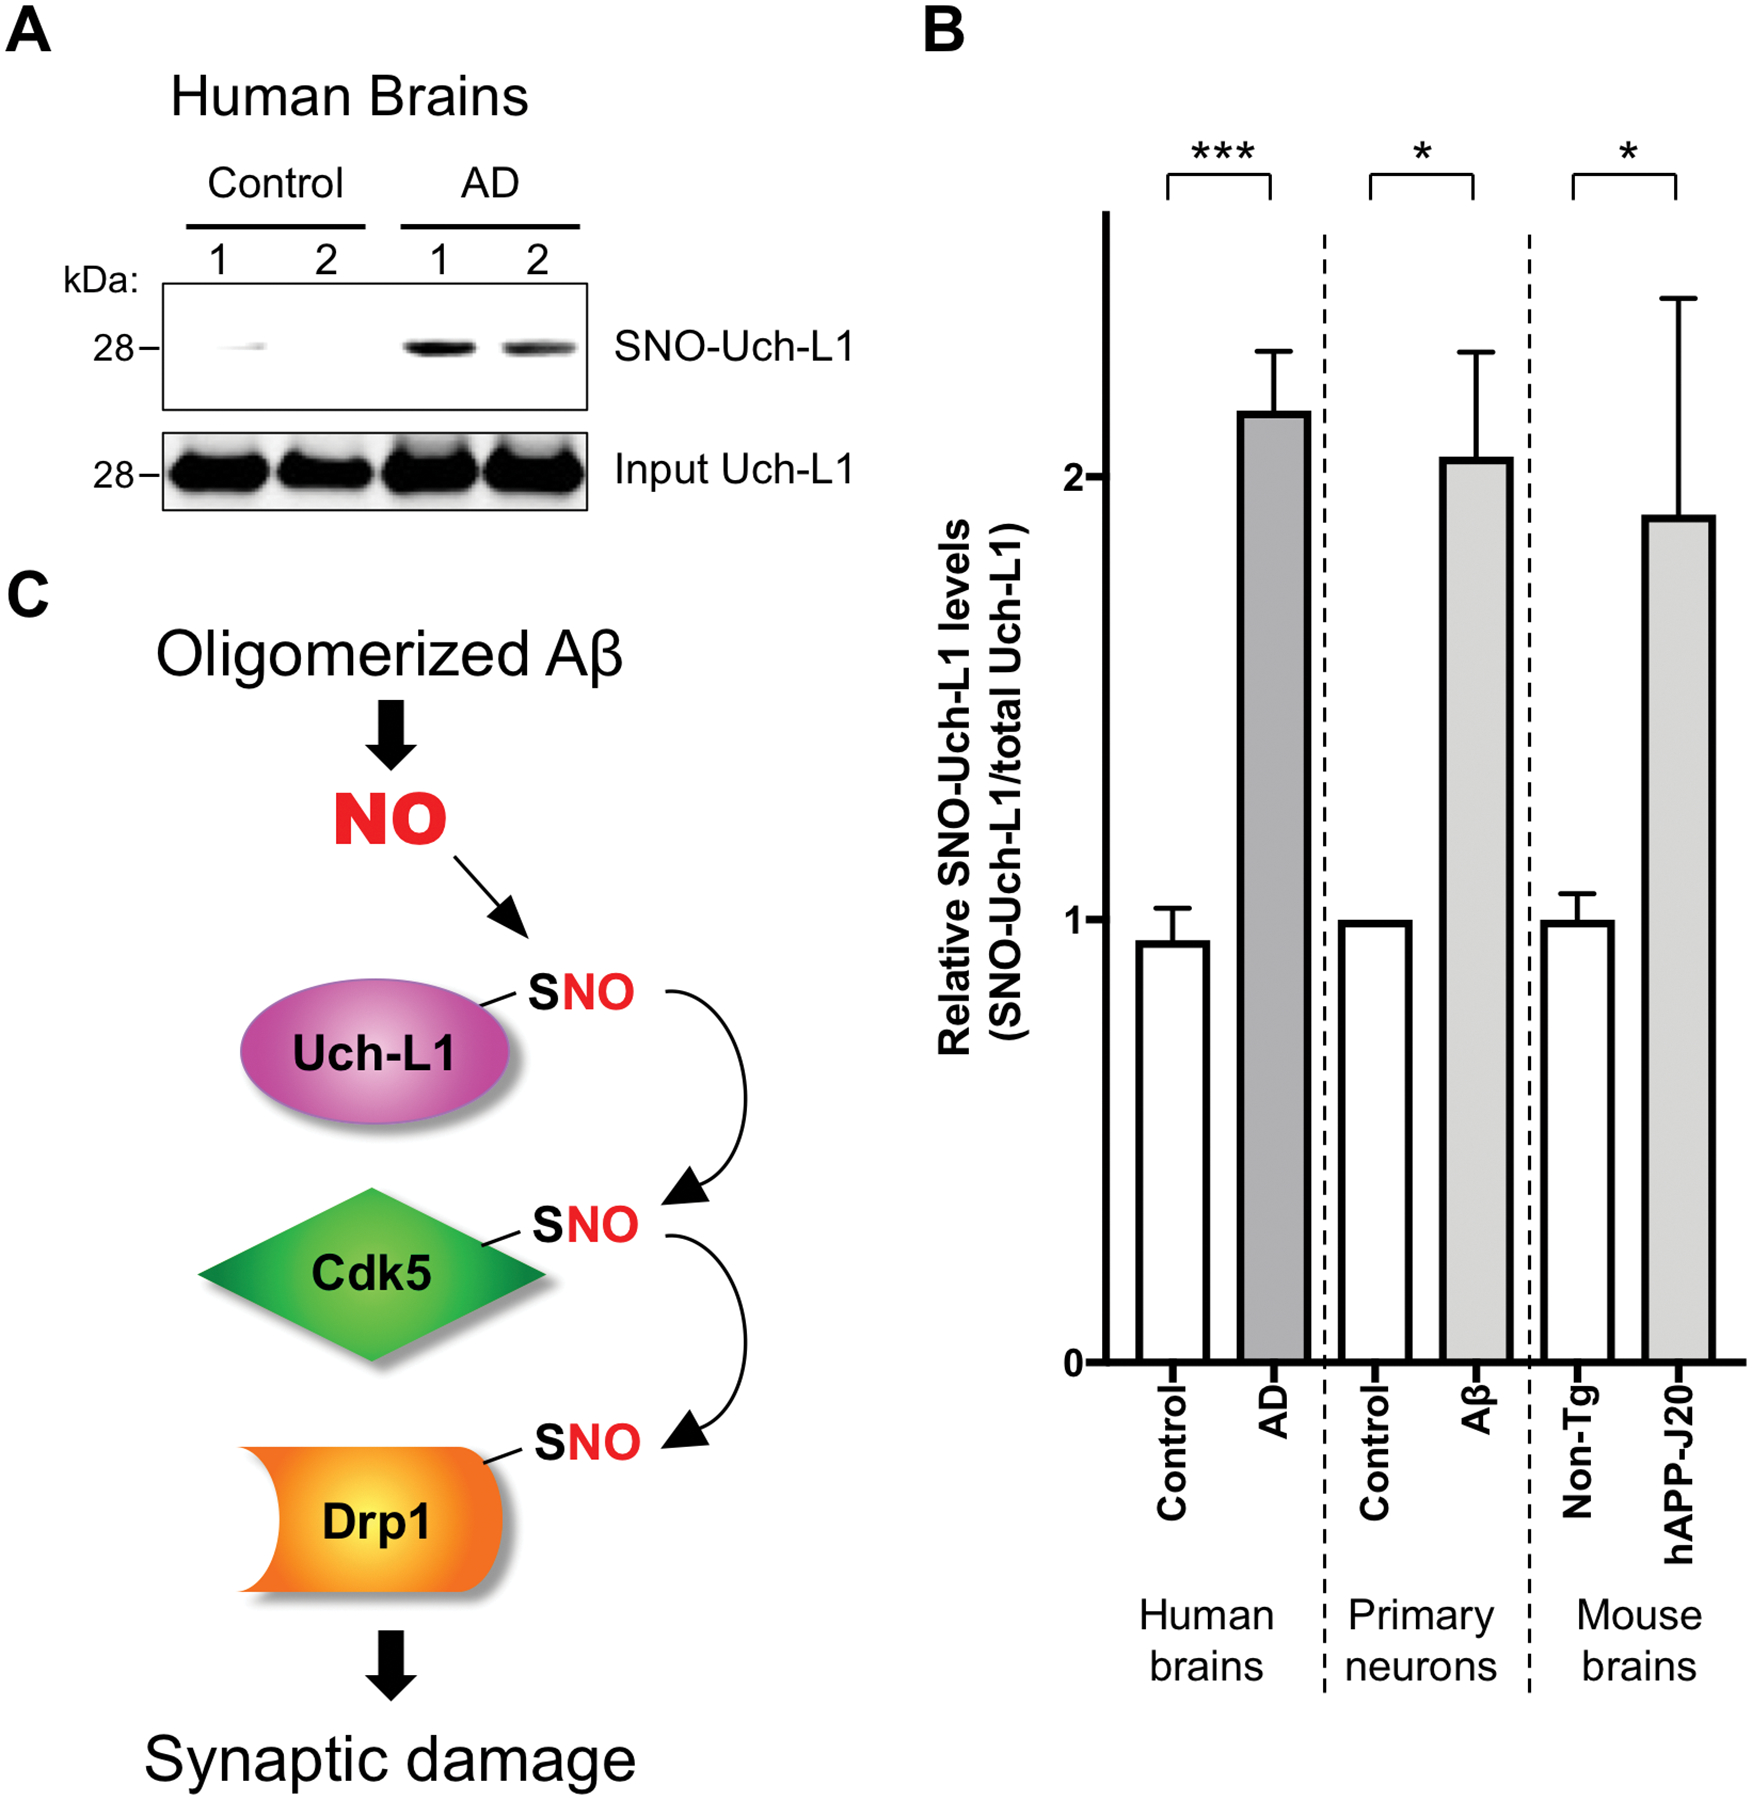
Here we describe mechanistically distinct enzymes (a kinase, a guanosine triphosphatase, and a ubiquitin protein hydrolase) that function in disparate biochemical pathways and can also act in concert to mediate a series of redox reactions. Each enzyme manifests a second, noncanonical function-transnitrosylation-that triggers a pathological biochemical cascade in mouse models and in humans with Alzheimer's disease (AD). The resulting series of transnitrosylation reactions contributes to synapse loss, the major pathological correlate to cognitive decline in AD. We conclude that enzymes with distinct primary reaction mechanisms can form a completely separate network for aberrant transnitrosylation. This network operates in the postreproductive period, so natural selection against such abnormal activity may be decreased.


Conflict of interest statement

Competing Interests: The authors declare no competing interests with regard to this work.

Figures

Fig. 1.
Fig. 1.. S-Nitrosylation of Uch-L1 at Cys152.
(A) SNO-Uch-L1 formation by biotin-switch assay in SH-SY5Y cells exposed to 100 μM SNOC. As a negative control, ascorbate (Asc) was omitted. Values are expressed as mean + SEM (n = 3 biological replicates per group). **P < 0.01 by ANOVA. (B) SNO-Uch-L1 formation by biotin-switch assay in HEK-nNOS cells exposed to calcium ionophore A23187. (C) Presence of SNO-Uch-L1 in the cerebrocortex of 3–6 mos-old hAPP-J20 AD transgenic mice by biotin-switch assay. Values are mean + SEM (n = 6 per group). *P < 0.05 by Student’s t test. (D) S-Nitrosylation of Uch-L1 at Cys152. HEK cells expressing myc-tagged WT Uch-L1 or cysteine mutants of Uch-L1 were exposed to SNOC. Lack of a band by biotin-switch assay for Uch-L1(C152S) indicates that it is the predominant site of S-nitrosylation. Values are expressed as mean + SEM (n = 3–4 per group). *P < 0.05 compared to ‘WT Uch-L1 + SNOC’ by ANOVA. (E) S-Nitrosylation of Uch-L1 at Cys152 by biotin-switch assay in HEK-nNOS cells. HEK-nNOS cells expressing myc-tagged Uch-L1 WT or C152S mutant were exposed to A23187 to increase intracellular Ca2+ and thus activate nNOS to generate endogenous NO. The NOS inhibitor NG-nitro-l-arginine (NNA, 1 mM) was used to inhibit NO generation as a control. Values are expressed as mean + SEM (n = 3 per group). *P < 0.05 by ANOVA. Uncropped immunoblots are included in fig. S7.
Fig. 2.
Fig. 2.. Mass spectrometry (MS) identification of S-nitrosylated Cys residue in Uch-L1 and atomic resolution model.
(A) Table summarizing S-nitrosylated peptides for Uch-L1 by MS analysis. Four peptides were identified containing Cys152, and one peptide with Cys220. Spectral counting clearly demonstrated that Cys152 is the predominant S-nitrosylation site on Uch-L1 (total spectral counts 33 for Cys152 vs. 2 for Cys220). (B) Tandem mass spectrum of a Uchl-L1 peptide identifying S-nitrosylation at Cys152. The measured mass, charge state, and measurement accuracy of the precursor ion are displayed. The b (blue) and y (red) fragment ions are annotated with the measured mass. (C) Crystal structure of Uch-L1 (PDB ID: 2ETL) near Cys152 (yellow). Magenta: Glu7 and Arg153. Molecular visualization and graphics handling were performed using PyMol.
Fig. 3.
Fig. 3.. Aβ-induced S-nitrosylation of Uch-L1 contributes to AD-related synapse loss.
(A) SNO-Uch-L1 formation in primary rat cerebrocortical neurons in culture after 4.5 h exposure to 500 nM oligomerized Aβ1–42 assayed by the biotin-switch method (upper panel). Quantification of biotin-switch blots (lower panel). Values are mean + SEM (n = 3 per group). *P < 0.05 by Student’s t test. (B and C) Exposure of rat cerebrocortical neurons in vitro to Aβ oligomers (500 nM) for 24 h resulted in decreased dendritic spines, visualized by GFP transfection (B). Transfection with non-nitrosylatable mutant Uch-L1(C152S) abrogated Aβ-induced dendritic spine damage in a statistically significant manner, while WT Uch-L1 manifested a lesser, nonsignificant effect. Values are mean + SEM (spines scored for n = 25 neurons). *P < 0.05 by ANOVA with Bonferroni correction. (D and E) Lentiviral expression of Uch-L1(C152S) in vivo prevents loss of presynaptic marker in hAPP-J20 mice. Representative immunostaining of hippocampal sections with synaptophysin antibody (SY38; pseudo-colored red). Scale bar, 200 μm (D). Quantification of hippocampal immunohistochemistry from WT and hAPP-J20 mice injected with WT Uch-L1, mutant Uch-L1(C152S), or empty lentiviral vectors (E). Immunohistochemistry was performed with synaptophysin antibody (SY38). Values are mean + SEM (n = 18 mice injected). *P < 0.05, ***P < 0.001 by Student’s t test with Bonferroni correction.
Fig. 4.
Fig. 4.. Transnitrosylation from SNO-Uch-L1 to Cdk5 on biotin-switch assays.
(A) SNO-Uch-L1 formed 10-min after exposure of HEK-293 cells to 100 μM SNOC, but not after exposure to control represented by ‘old’ SNOC from which the NO group had been dissipated, although this solution might still contain nitrite and disulfides. Formation of SNO-Cdk5 was also observed, and this was partially abrogated by siRNA knockdown of Uch-L1 (siUch-L1) compared to control siRNA (siCTL) cells. (B) Knockdown of Uch-L1 largely prevented formation of SNO-Drp1, which first appeared 25 min after exposure to SNOC. (C) Quantification of SNO-Cdk5 on biotin-switch blots. Relative SNO-Cdk5 levels (SNO-protein/Input protein) in siCTL cells were increased 10 min after exposure to SNOC vs. 25 min when compared to siUch-L1 cells exposed to SNOC. Values are mean + SEM (n = 3 per group). ***P < 0.001 by two-tailed Student’s t test. (D) Similar type of quantification of SNO-Drp1 on biotin-switch blots. In this case, relative SNO-Drp1 levels were increased 25 min after exposure to SNOC vs. 10 min. Values are mean + SEM (n = 3 per group). ***P < 0.001 by two-tailed Student’s t test.
Fig. 5.
Fig. 5.. Triple transnitrosylation from SNO-Uch-L1 to SNO-Cdk5 to SNO-Drp1.
(A) Schematic diagram of in vitro transnitrosylation assay. (B) Transnitrosylation occurs from WT SNO-Uch-L1 to Cdk5 to Drp1 but significantly less with mutant Uch-L1(C152S). WT Uch-L1-V5 or mutant Uch-L1(C152S)-V5 from SH-SY5Y cell lysates was immunoprecipitated with anti-V5 antibody and exposed to 100 μM SNOC. These immunoprecipitates were then added to whole cell lysates expressing HA-Cdk5, which were subjected to the biotin-switch assay to assess transnitrosylation. Compilation of representative blots shown. (C and D) Quantification of Uch-L1 and Cdk5 biotin-switch blots. Values are mean + SEM (n = 4 per group). ***P < 0.001 by two-tailed Student’s t test, **P < 0.01, *P < 0.05 by ANOVA. (E) Quantification of Drp1 biotin-switch blots. Values are mean + SEM (n = 3 per group). *P < 0.05, **P < 0.01 by ANOVA. (F) Schematic diagram of in vitro transnitrosylation assay after immunoprecipitation to decrease the amount of endogenous Cdk5. (G) SNO-Uch-L1 nitrosylation of Drp1 is affected by the level of endogenous Cdk5. WT Uch-L1-V5 or Uch-L1(C152S)-V5 from SH-SY5Y cell lysates was immunoprecipitated with anti-V5 antibody, and the immunoprecipitates exposed to 100 μM SNOC or old SNOC. The immunoprecipitates containing SNOC-exposed Uch-L1 proteins were then incubated with SH-SY5Y cell lysates expressing Drp1-HA after substantial immunodepletion of endogenous Cdk5 with anti-Cdk5 antibody (or IgG control antibody). Samples were subjected to biotin-switch assay to assess transnitrosylation. (H and I) Quantification of Uch-L1and Drp1 biotin-switch blots. Values are mean + SEM (n = 3 per group). **P < 0.01, *P < 0.05 by ANOVA.
Fig. 6.
Fig. 6.. Redox blot quantifying transnitrosylation from Uch-L1 to Cdk5.
(A) Transnitrosylation occurs predominantly from SNO-Uch-L1 to Cdk5 to Drp1 rather than in the opposite direction from SNO-Cdk5 to Uch-L1. Expression of Uch-L1-V5 and Cdk5-HA increased the formation of SNO-Drp1, as evidenced on biotin-switch assay. Lysates of SH-SY5Y cells were prepared by V5- or HA-immunoprecipitation and exposed to 100 μM SNOC. These immunoprecipitates were then added to whole-cell lysates expressing either HA-Cdk5 or Uch-L1-V5, which were subjected to the biotin-switch assay to assess transnitrosylation. (B) SH-SY5Y cells were transfected with Uchl-L1-V5 and Cdk5-HA tagged constructs, and exposed to 50 μM SNOC at room temperature. After 30 min, cell lysates were prepared, incubated to achieve steady state (~1 h, by which time SNOC, a short-lived NO donor, had completely dissipated), and then subjected to the biotin-switch assay. Methyl-methanethiosulfonate (MMTS, 25 mM) was used to block free thiols during the assay for S-nitrosylated protein. Chemically-reduced thiol protein represents the relative amount of total protein obtained by the biotin-switch assay performed in the absence of MMTS (w/o MMTS). SNO-protein represents the relative amount of S-nitrosylated protein obtained by the biotin-switch assay. The relative concentration of protein in a redox pair in the S-nitrosylated (oxidized) form and the reduced form can be measured by quantitative densitometry of their respective bands on the gels (n = 4).
Fig. 7.
Fig. 7.. S-Nitrosylation of Uch-L1 in human AD brains and schema of transnitrosylation in the pathophysiology of synapse loss in AD.
(A) Human brain tissues from control or AD patients were subjected to the biotin-switch assay to detect SNO-Uch-L1. (B) Quantification of the ratio of SNO-Uch-L1 to total Uch-L1 in human brains and in cell-based assays. Biotin-switch assays and immunoblot analyses were quantified by densitometry, and the relative ratio of SNO-Uch-L1 to total Uch-L1 was calculated for the following conditions: In vitro in cerebrocortical neurons after Aβ exposure (as shown in Figure 3A), in vivo in the hAPP-J20 mouse model of AD (as shown in Figure 1C), and in human AD brains vs. control human brains. Values are mean + SEM (n = 6 for control human brains, n = 7 samples from 5 AD human brains, n = 3 for each group in primary neuron experiments, n = 6 for each group in mouse brain experiments). ***P < 0.001, *P < 0.05 by Student’s t test. (C) Biochemical schema of transnitrosylation pathway leading to synaptic damage and consequent memory loss in AD. Note that these transnitrosylation reactions may be direct or indirect, with additional, as yet unknown, members of the transnitrosylation network still to be discovered.

References

    1. Dawson VL, Dawson TM, London ED, Bredt DS, Snyder SH, Nitric oxide mediates glutamate neurotoxicity in primary cortical cultures. Proc. Natl. Acad. Sci. U.S.A 88, 6368–6371 (1991). - PMC - PubMed
    1. Hara MR et al., S-Nitrosylated GAPDH initiates apoptotic cell death by nuclear translocation following Siah1 binding. Nat. Cell Biol 7, 665–674 (2005). - PubMed
    1. Lipton SA et al., A redox-based mechanism for the neuroprotective and neurodestructive effects of nitric oxide and related nitroso-compounds. Nature 364, 626–632 (1993). - PubMed
    1. Nakamura T et al., Aberrant protein S-nitrosylation in neurodegenerative diseases. Neuron 78, 596–614 (2013). - PMC - PubMed
    1. Hess DT, Matsumoto A, Kim SO, Marshall HE, Stamler JS, Protein S-nitrosylation: purview and parameters. Nat. Rev. Mol. Cell Biol 6, 150–166 (2005). - PubMed

Publication types

MeSH terms