. 2020 Dec 22;117(51):32358-32369.
doi: 10.1073/pnas.2016380117. Epub 2020 Dec 3.

Hierarchical routing in carbon metabolism favors iron-scavenging strategy in iron-deficient soil Pseudomonas species

Affiliations

Hierarchical routing in carbon metabolism favors iron-scavenging strategy in iron-deficient soil Pseudomonas species

Caroll M Mendonca et al. Proc Natl Acad Sci U S A. .

Abstract

High-affinity iron (Fe) scavenging compounds, or siderophores, are widely employed by soil bacteria to survive scarcity in bioavailable Fe. Siderophore biosynthesis relies on cellular carbon metabolism, despite reported decrease in both carbon uptake and Fe-containing metabolic proteins in Fe-deficient cells. Given this paradox, the metabolic network required to sustain the Fe-scavenging strategy is poorly understood. Here, through multiple 13C-metabolomics experiments with Fe-replete and Fe-limited cells, we uncover how soil Pseudomonas species reprogram their metabolic pathways to prioritize siderophore biosynthesis. Across the three species investigated (Pseudomonas putida KT2440, Pseudomonas protegens Pf-5, and Pseudomonas putida S12), siderophore secretion is higher during growth on gluconeogenic substrates than during growth on glycolytic substrates. In response to Fe limitation, we capture decreased flux toward the tricarboxylic acid (TCA) cycle during the metabolism of glycolytic substrates but, due to carbon recycling to the TCA cycle via enhanced anaplerosis, the metabolism of gluconeogenic substrates results in an increase in both siderophore secretion (up to threefold) and Fe extraction (up to sixfold) from soil minerals. During simultaneous feeding on the different substrate types, Fe deficiency triggers a hierarchy in substrate utilization, which is facilitated by changes in protein abundances for substrate uptake and initial catabolism. Rerouted metabolism further promotes favorable fluxes in the TCA cycle and the gluconeogenesis-anaplerosis nodes, despite decrease in several proteins in these pathways, to meet carbon and energy demands for siderophore precursors in accordance with increased proteins for siderophore biosynthesis. Hierarchical carbon metabolism thus serves as a critical survival strategy during the metal nutrient deficiency.

Keywords: Pseudomonas putida; bacteria; iron limitation; metabolomics; siderophore.


Conflict of interest statement

The authors declare no competing interest.

Figures

Fig. 1.
Fig. 1.
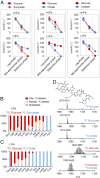
Gluconeogenic substrates lead to higher siderophore yield and Fe scavenging relative to glycolytic substrates in Pseudomonas spp. (A) Schematic metabolic routing of gluconeogenic substrates (succinate, malate, and benzoate) and glycolytic substrates (glucose and fructose) toward metabolite precursors for PVD biosynthesis in Pseudomonas species. (B) Substrate-dependent PVD concentration (mean ± SD µmol), normalized by biomass at the time of sampling, produced by Fe-limited P. protegens Pf-5, P. putida S12, and P. putida KT2440 following growth on carbon-equivalent (100 mM C) succinate, malate, fructose, or glucose as the sole carbon source; the chemical structure of the primary PVD produced by each species is shown on the Right (one-way ANOVA, Tukey’s studentized range test: ns, not statistically significant; *P < 0.05; **P < 0.01; ***P < 0.001). (C) Total dissolved Fe (mean ± SD µmol L−1) from the dissolution of Fe-bearing minerals (goethite, magnetite, and hematite; 1 g L−1) reacted with bacterial secretions obtained with intermediate Fe-limited P. putida KT2440 cells following growth on glucose or succinate (two-tailed t test: **P < 0.01, ns, not significant). (D) Relative abundance (Top) and kinetic 13C profiling (Bottom) of PVD metabolite precursors (from Left to Right: tyrosine, 3-PG, pyruvate, aspartate, α-KG, and Orn) in intermediate Fe-limited P. putida KT2440 cells fed on 50:50 [U-13C6]-glucose:unlabeled glucose (red symbols) or 50:50 [U-13C4]-succinate:unlabeled succinate (blue symbols); in both sets of data, error bars are too small to be noticed beyond the data points of averaged values from the biological replicates. Color code for pathway designation in A and B: PP pathway in red, downstream ED pathway in light orange, and TCA cycle in blue. Metabolite and substrate abbreviations for AD: succinate, Succ; malate, Mal; glucose, Gluc; fructose, Fruc; erythrose 4-phosphate, E4P; 3-phosphoglycerate, 3-PG; phosphoenolpyruvate, PEP; pyruvate, Pyr; oxaloacetate, OAA; α-ketoglutarate, α-KG; tyrosine, Tyr; serine, Ser; glycine, Gly; alanine, Ala; lysine, Lys; aspartate, Asp; hydroxyl-aspartate, OH-Asp; diamino butyrate, Dab, ornithine, Orn; cyclic ornithine, cOrn. All data are from three biological replicates.
Fig. 2.
Fig. 2.
Anaplerotic flux favored over gluconeogenic flux to promote succinate carbon retention in the TCA cycle. Carbon mapping, metabolite labeling, and flux ratio analysis of (A) assimilated [1,4-13C2]-succinate or (B) assimilated [U-13C4]-succinate with unlabeled glucose in exponentially growing P. putida KT2440 cells cultured in Fe-replete [(+)Fe] and intermediate Fe-limited [(−)Fe] conditions. Dashed arrow represents a minor flux. Addition of CO2-derived carbon in OAA synthesis is shown with a green box. The measured data (mean ± SD) were from three biological replicates. The metabolite abbreviations are as described in the Fig. 1 legend.
Fig. 3.
Fig. 3.
Fe-limited cells trigger substrate hierarchy during mixed-substrate usage. (A) Substrate consumption during growth of Fe-replete [(+)Fe] and intermediate Fe-limited [(−)Fe] P. putida KT2440 on carbon-equivalent mixture with (Left) 1:1 glucose:succinate, (Middle) 1:1 glucose:citrate, or (Right) 1:1 glucose:acetate mixture; samples were obtained during lag phase, midexponential phase, and at the onset of stationary phase. Intracellular metabolite labeling in exponentially growing P. putida KT2440 cells after assimilation of (B) [U-13C6]-glucose and unlabeled succinate or (C) [U-13C6]-glucose and unlabeled citrate. (D) Electrospray-ionized monoisotopic positive ions ([M + H]+) of the primary PVD siderophore secreted by P. putida KT2440 during intermediate Fe-limited growth on unlabeled glucose (12C-glucose) alone, unlabeled succinate (12C-succinate) alone, unlabeled citrate (12C-citrate) alone, fully labeled glucose with unlabeled succinate (13C-glucose:12C-succinate), or fully labeled glucose with unlabeled citrate (13C-glucose:12C-succinate). Measured data (mean ± SD) were from biological replicates (n = 3). The metabolite abbreviations are as described in the Fig. 1 legend.
Fig. 4.
Fig. 4.
Enhanced siderophore production associated with preferential carbon usage and hierarchy in carbon metabolism. (A) Kinetics of substrate depletion (in % of total C) by P. putida KT2440 grown on 1:1 glucose:benzoate mixture under, from Left to Right, Fe-replete [(+)Fe], intermediate Fe-limited [Int(−)Fe], and Fe-limited [(−)Fe] conditions. (BE) Intracellular metabolite labeling after assimilation of [U-13C6]-glucose and unlabeled benzoate during (B) (+)Fe, (C) Int(−)Fe, (D) (−)Fe phase 1, and (E) (−)Fe phase 2 conditions; metabolites with glucose-derived 13C carbons and benzoate-derived unlabeled carbons are depicted in red and dark blue shades, respectively. Sampling times for the metabolite labeling data shown in B–E are shown by the white arrows in A; detailed graphs of the metabolite labeling data are in SI Appendix, Fig. S3. (F) Siderophore production rate (µmol PVD gCDW−1 h−1) during (−)Fe growth on only glucose or growth on the glucose:benzoate (Gluc:Benz) mixture under int(−)Fe), (−)Fe phase 1, and phase 2 conditions (one-way ANOVA and Tukey’s studentized range test: ns, not statistically significant; ***P < 0.001). (G) Total dissolved Fe (µmol Fe L−1) from the dissolution of Fe-bearing minerals (goethite, hematite, and magnetite; 1 g L−1) following reactions with bacterial secretions obtained with P. putida KT2440 cells at the end of growth on the Gluc:Benz mixture under (+)Fe, (−)Fe phase 1, and (−)Fe phase 2 conditions (two-tailed t test: *P < 0.05; ns, not significant). In A and B, the (+)Fe consumption and labeling data used here as comparative reference data were obtained from previously conducted experiments (43). All data were obtained from three biological replicates. The metabolite abbreviations are as described in the Fig. 1 legend.
Fig. 5.
Fig. 5.
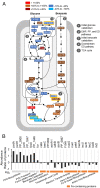
Fe-dependent carbon selectivity and siderophore biosynthesis facilitated by protein abundance changes. (A) Percent changes (greater than or less than 10%) in proteins involved in the central carbon metabolism of P. putida KT2440 cells grown on the glucose:benzoate mixture under Fe-limitation versus Fe-replete conditions. (B) Fold change (expressed in log2 of ratio of Fe-limitation data versus Fe-replete data) in the abundance of proteins involved in PVD biosynthesis and transport, proteins involved in Fe regulation, and Fe-containing metabolic proteins. The Fe-limited data were obtained during the first phase of Fe-limited substrate consumption depicted in Fig. 4A. The total profiling of protein abundance ratios and data statistics is in SI Appendix, Table S2. Data were obtained from three biological replicates.
Fig. 6.
Fig. 6.
Metabolic remodeling of carbon fluxes in response to Fe deficiency. (AD) Scheme of the metabolic routes for the biosynthesis of four metabolic nodes: (A) GAP derived from 3-PG or the ED pathway, (B) OAA derived from pyruvate or malate via the TCA cycle, (C) PEP derived from 3-PG, Pyr, or OAA via the TCA cycle, and (D) Pyr derived from the ED pathway or from the TCA cycle (via OAA and malate). (EH) (Top) Fe-dependent percentage (mean ± SD) of each precursor compound or pathway for each metabolic node and (Bottom) estimated fold-change increase or decrease (mean ± SD) in ATP, UQH2, and NAD(P)H in Fe-limited cells relative to Fe-replete cells of P. putida KT2440 during growth on the glucose:benzoate mixture. The Fe-limited cell data were obtained during the first phase of Fe-limited substrate consumption depicted in Fig. 4A. Analyses were conducted using metabolite labeling data from three biological replicates (SI Appendix, Fig. S3). The metabolite abbreviations are as described in the Fig. 1 legend.
Fig. 7.
Fig. 7.
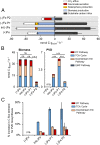
Metabolic pathway flux demand for biomass growth versus siderophore biosynthesis. (A) Measured carbon influx, measured effluxes (gluconate secretion, siderophore production, and biomass production), and estimated CO2 production (mmol C gCDW h−1) in P. putida KT2440 grown on 1:1 glucose:benzoate mixture under Fe-replete [(+)Fe], intermediary Fe-limited [Int(−)Fe], Fe-limited [(−)Fe] phase 1 (P1), and (−)Fe phase 2 (P2) conditions. Color code: CO2 production (green), gluconate secretion (yellow), siderophore production (orange), biomass production (blue), and substrate carbon influx (gray). (B) Calculated pathways flux demand (mmol C gCDW−1 h−1) required from central carbon metabolism to sustain (Left) measured biomass growth and (Right) biosynthesis of measured PVD secretion rate (one-way ANOVA, Tukey’s studentized range test: ns, not statistically significant; ***P < 0.001). (C) Percentage (%) increase in metabolic flux demand for PVD biosynthesis relative to flux demand for biomass growth alone. Color code for B and C: EMP pathway, dark blue; PP pathway, red; downstream ED pathway, light orange; and TCA cycle, light blue. All data, shown as mean ± SD, were obtained from three biological replicates.
Fig. 8.
Fig. 8.
Overview of hierarchical carbon metabolism in Pseudomonas sp. triggered by Fe deficiency. (A) For singe-substrate usage, metabolomics data reveal a decreased flux toward the TCA cycle in glucose-grown cells and enhanced anaplerosis in succinate-grown cells in response to Fe limitation, resulting in an increased siderophore production in succinate-grown cells. (B) For mixed-substrate usage, metabolomics data capture a selectivity in carbon uptake accompanied by hierarchical carbon metabolism to favor fluxes through the TCA cycle and toward oxaloacetate and α-ketoglutarate, the two major nodes for biomass and siderophore biosynthesis. In sum, rerouted metabolic fluxes overcome decrease in Fe-containing proteins (denoted by green-filled circles) determined from the proteomics profiling, while still meeting the carbon and energy flux demands for siderophore biosynthesis. Red/orange and blue/purple shaded arrows indicate the metabolic fluxes of carbons derived, respectively, from glucose (Gluc) and a gluconeogenic substrate (succinate [Succ], citrate [Citr], or benzoate [Benz]); lighter and darker shades represent, respectively, large and small fluxes from the corresponding substrate. Color coded in accordance with their relative contribution to biomass fluxes or the PVD biosynthetic fluxes, the metabolic nodes that are precursors to biomass biosynthesis (rectangle), PVD structure (triangle), or both biomass and PVD (circle) are shown as white (0 to 10%), pink (10 to 25%), and red (above 25%) circles; the gray triangle denotes a metabolite (acetyl-CoA) used for the acyl chain present in the pre-PVD structure but not in the final PVD structure.

Similar articles

Cited by

References

    1. Boukhalfa H., Crumbliss A. L., Chemical aspects of siderophore mediated iron transport. Biometals 15, 325–339 (2002). - PubMed
    1. Braun V., Hantke K., Recent insights into iron import by bacteria. Curr. Opin. Chem. Biol. 15, 328–334 (2011). - PubMed
    1. Konhauser K. O., Kappler A., Roden E. E., Iron in microbial metabolisms. Elements 7, 89–93 (2011).
    1. Lauderdale J. M., Braakman R., Forget G., Dutkiewicz S., Follows M. J., Microbial feedbacks optimize ocean iron availability. Proc. Natl. Acad. Sci. U.S.A. 117, 4842–4849 (2020). - PMC - PubMed
    1. Folsom J. P., Parker A. E., Carlson R. P., Physiological and proteomic analysis of Escherichia coli iron-limited chemostat growth. J. Bacteriol. 196, 2748–2761 (2014). - PMC - PubMed

Publication types