. 2020 Dec 22;117(51):32701-32710.
doi: 10.1073/pnas.2013652117. Epub 2020 Dec 3.

A dual role for α-synuclein in facilitation and depression of dopamine release from substantia nigra neurons in vivo

Affiliations

A dual role for α-synuclein in facilitation and depression of dopamine release from substantia nigra neurons in vivo

Mahalakshmi Somayaji et al. Proc Natl Acad Sci U S A. .

Abstract

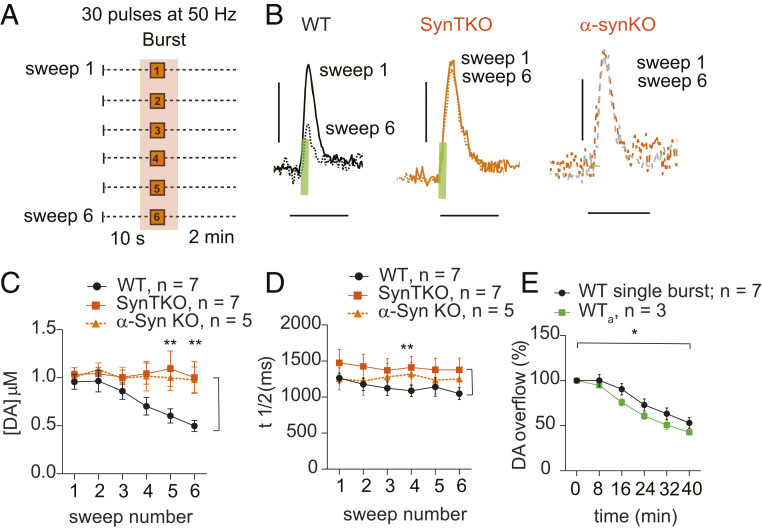
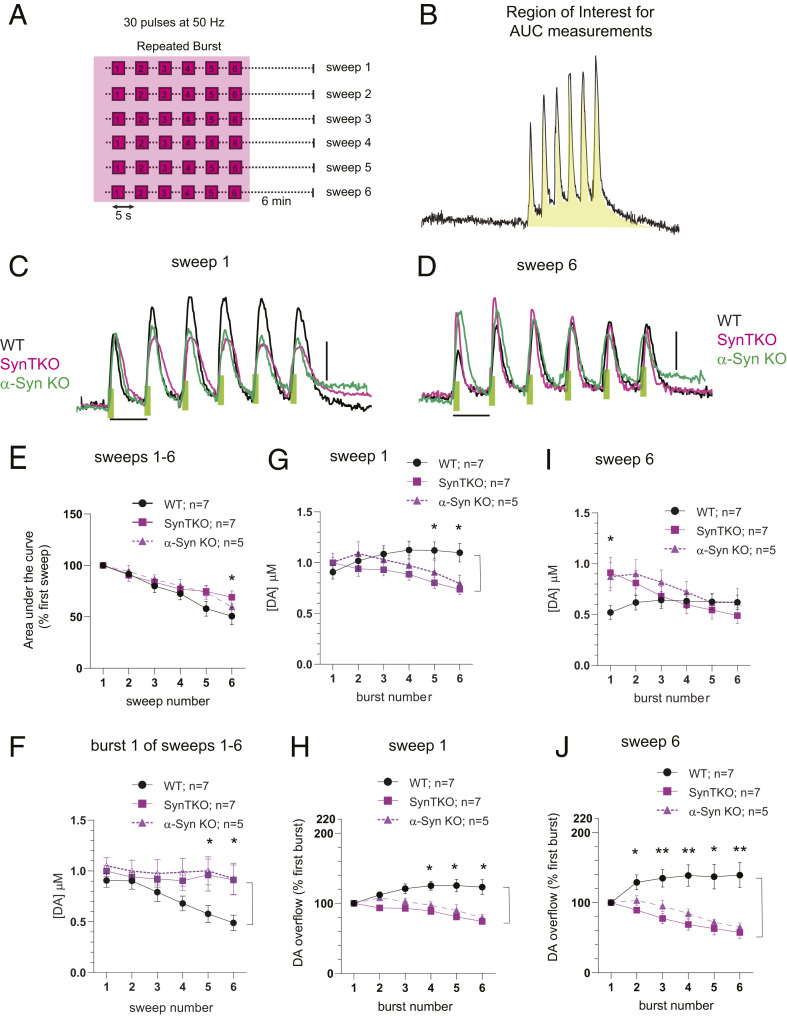
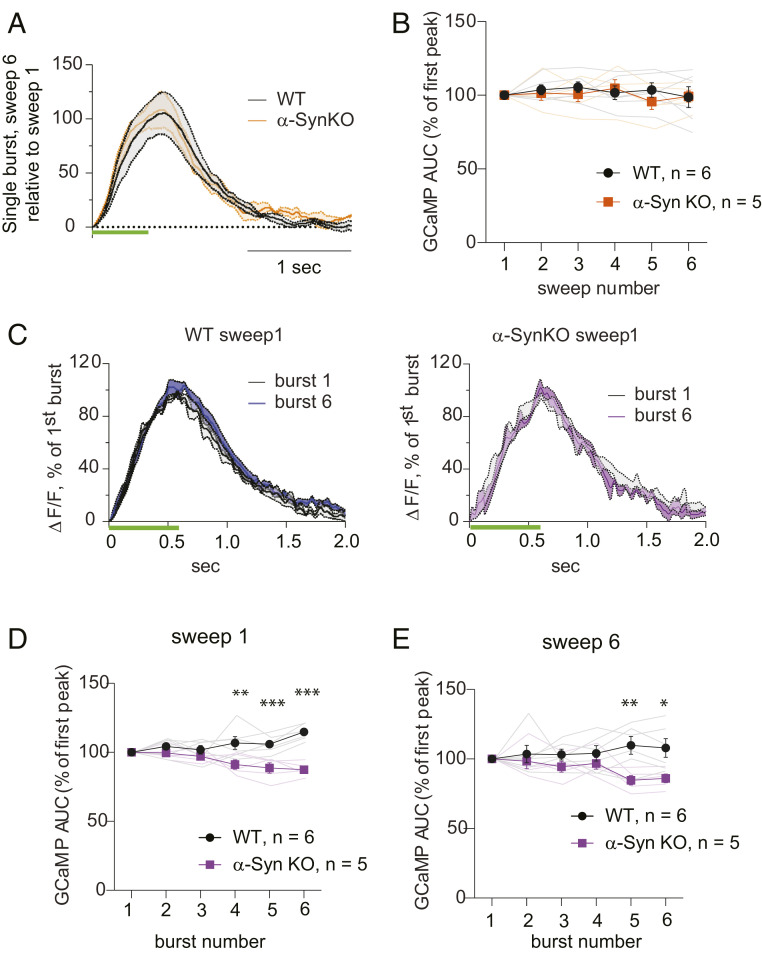
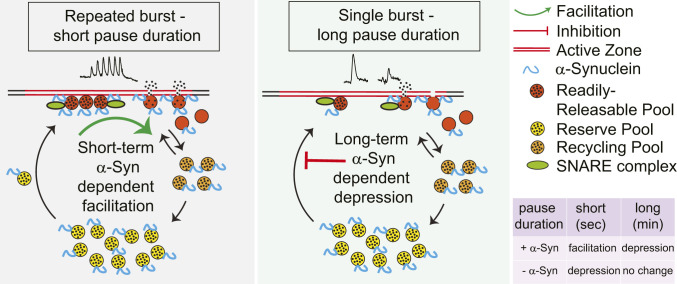
α-Synuclein is expressed at high levels at presynaptic terminals, but defining its role in the regulation of neurotransmission under physiologically relevant conditions has proven elusive. We report that, in vivo, α-synuclein is responsible for the facilitation of dopamine release triggered by action potential bursts separated by short intervals (seconds) and a depression of release with longer intervals between bursts (minutes). These forms of presynaptic plasticity appear to be independent of the presence of β- and γ-synucleins or effects on presynaptic calcium and are consistent with a role for synucleins in the enhancement of synaptic vesicle fusion and turnover. These results indicate that the presynaptic effects of α-synuclein depend on specific patterns of neuronal activity.

Keywords: alpha-Synuclein; dopamine; in vivo neurotransmission.


Conflict of interest statement

The authors declare no competing interest.

Figures

Fig. 1.
Fig. 1.
In vivo electrophysiological recordings from SN dopaminergic neurons in lightly anesthetized mice. (AC) Representative extracellular in vivo recording of spontaneous firing activity of SN dopaminergic neurons, showing examples of regular (pacemaker, A), irregular (B), and burst firing (C) patterns. (Scale bars: 1 s and 5 mV.) (DF) Representative histograms of interspike intrevals (ISIs) of individual regular (D), irregular (E), and bursty (F) neurons, demonstrating variations in firing patterns. (G) In vivo juxtacellular and immunocytochemical labels showing the neurochemical identity and anatomical localization of recorded dopaminergic neurons. Confocal laser scanning microscopic images of mouse brain tissue show neurons immunolabeled for TH (green) to identify dopaminergic neurons and neurobiotin (Nb, red) to visualize a neuron near the recording micropipette. (H) Anatomical mapping of all recorded WT DA neurons (n = 11) and their localization within the SN [coronal midbrain image adapted from Franklin and Paxinos’ The Mouse Brain in Stereotaxic Coordinates, Fourth Edition (58)]. (I) Scatter plot showing the coefficient of variation (mean/SD) and a fraction of spikes fired as bursts (SFB) of identified midbrain DA neurons. A dotted line at spikes fired as bursts (SFB) 20% represents the threshold for neurons classified as bursty together with respective autocorrelogram-based classifications. Note that ∼35% of the SN dopaminergic neurons exhibited burst firing under isoflurane anesthesia.
Fig. 2.
Fig. 2.
Protocol for the characterization of evoked DA release by FSCV in vivo. (A) Confocal laser scanning microscope images (5× objective) of coronal mouse brain sections indicating the location of recording electrode in the dorsal striatum (Left, green, DAPI; red, DiI staining, arrow) and the bipolar stimulating electrode in the ventral midbrain (Right, dashed outline and arrows) (Scale bar, 2 mm.) (B) Three-dimensional (3D) pseudocolor plot showing oxidation (red) and reduction (green) of DA. The time course of oxidation at 300 mV is superimposed as a black trace. (Inset) Voltammogram at the maximum of oxidation (11.2 s). (Scale bar: 200 mV and 500 pA.) (C, Left) Representative peaks of evoked DA release obtained by stimulating the dopaminergic cell bodies in the midbrain with a constant pulse number (30 pulses) at 20 Hz (dashed), 50 Hz (line), and 90 Hz (green, dashed) frequencies. The red arrow indicates the start of an electrical train of stimuli. (C, Right) Correlation between evoked DA release and stimulus frequency (blue, fit of the data with an allosteric sigmoidal curve y = Vmax*x^h/(K1/2^h + x^h), where Vmax = 0.9 µM, K1/2 = 36 Hz, and h = 2.7; * = multiplication, ^ = caret/exponent symbol). (D, Left) Examples of evoked DA release following stimulation of midbrain dopaminergic neurons by 20 (dashed), 30 (line), and 60 (gray, dashed) pulses at a constant 50-Hz frequency. The red arrow indicates the start of the train of stimuli. (Scale bar: y axis, 500 nM DA; x axis, 5 s.) (D, Right) Correlation between evoked DA release and pulse number (magenta, linear regression y = 0.04x − 0.3). The larger circle represents parameters that provide a preferred dynamic range (30 pulses at 50 Hz) used in this study. (E) Stimulus protocol developed based on the results from C and D. Each sweep is comprised of a single stimulus train (orange, 30 pulses at 50 Hz) with a recovery period of 2 min, followed by a repeating burst stimulation (magenta), consisting of six stimulus trains (30 pulses at 50 Hz) every 5 s, with a recovery period of 6 min before the next sweep. The entire protocol consists of six consecutive sweeps. (C and D) Horizontal dotted line represents zero line, vertical dotted line represents the chosen parameters for the study.
Fig. 3.
Fig. 3.
Synuclein-dependent decrease in evoked DA release during stimulation of midbrain neurons with single bursts and long (6-min) rest intervals. (A) Schematic of the stimulus paradigm. Shaded area highlights parts of the sweeps used for the analysis. (B) Evoked DA signal peaks following single burst stimulus (30 pulses at 50 Hz) from sweeps 1 and 6 showing the differences in DA release between WT (black; sweep 1, solid line; sweep 6, dotted line), synuclein triple knockout (SynTKO; orange; sweep 1, solid line; sweep 6, dotted line), and α−synuclein (α-SynKO sweep 1, orange dotted line; sweep 6, grey dotted line) mice. Green bars indicate electrical stimulation duration (0.6 s). (Scale bars: y axis, 500 nM DA; x axis, 5 s.) (C) Dopamine release decreases across sweeps in WT (black; one-way ANOVA within genotype: F5,36 = 5.2, P = 0.001; Tukey’s multiple comparison: sweep 1 vs. sweep 6, P = 0.006) but not in SynTKO (orange; one-way ANOVA within genotype: F5,36 = 0.073, P = 0.99, not significant by Tukey’s post hoc) and α-SynKO (orange-broken line; one-way ANOVA within genotype: F5,24 = 0.11, P = 0.99, not significant by Tukey’s post hoc) mice, resulting in significant difference between genotypes (two-way ANOVA between genotypes: F2,96 = 12.4, P < 0.0001; Tukey’s multiple comparison test showed significance between WT and SynTKO in bursts 5 and 6 (P = 0.003, 0.002 respectively), as well as WT and α-SynKO in bursts 5 and 6 (0.04, 0.009 respectively) (WT, n =7, SynTKO, n = 7, α-SynKO, n = 5). (D) The t1/2 did not change across sweeps in any of the genotypes. There was a shorter t1/2 in WT than in SynTKO, but not α-SynKO (two-way ANOVA: WT vs. SynTKO: F1,72 = 11.6, P = 0.001; WT vs. α-SynKO: F1,60 = 2.3, P = 0.12; WT, n = 7; SynTKO, n = 7; α-SynKO, n = 5). (E) Dopamine release decreased similarly in WT mice stimulated either with single burst within a sweep (black, same data as C) or single bursts only at 2-min intervals (green; one-way ANOVA within genotype: F5,12 = 37, P < 0.0001; Tukey’s multiple comparison: sweep 1 vs. sweep 6, P < 0.0001) (two-way ANOVA between genotypes: F1,48 = 5.8, P = 0.02. Bonferroni’s multiple comparison test did not show significance, n: WT, n = 7, WTa, n = 3). * = P < 0.05, ** = P < 0.005.
Fig. 4.
Fig. 4.
Synuclein-dependent facilitation of DA release during short-interval (5-s) burst stimuli. (A and B) Regions of the stimulation paradigm used for data analysis (shaded area). (C and D) Representative recordings of evoked DA release resulting from repeated burst stimulations during sweep 1 (C) and sweep 6 (D). WT (black) mice demonstrate short-term intraburst potentiation, while SynTKO (magenta) and α-SynKO (green) mice show short-term depression in vivo. Green bars indicate the duration (0.6 s) of electrical stimulation (Scale bar: y axis, 500 nM DA; x axis, 5 s.) (E) Depression of overall DA release during the entire train of repeated bursts duration measured as total AUC (as shown on B) across sweeps 1 to 6. Similar to single-burst data (Fig. 3C), depression of DA release was observed in WT mice (one-way ANOVA within genotype: F5,36 = 12.7, P < 0.0001; Tukey’s multiple comparison: sweep1 vs. sweep 6, P < 0.0001; n = 7) but not in SynTKO (one-way ANOVA within genotype: F5,42 = 0.8, P = 0.6; Tukey’s multiple comparison: not significant; n = 7) or α-SynKO (one-way ANOVA within genotype: F5,24 = 0.8, P = 0.6: Tukey multiple comparison: not significant; n = 5) animals. Two-way ANOVA between genotypes: F2,96 = 3.4, P = 0.04. Tukey’s multiple comparison: P = 0.04 between sweep 6 in WT and SynTKO. (F) Dopamine release in the first burst of repeated burst protocol decreases across sweeps in WT (one-way ANOVA within genotype: F5,30 = 21.9, P < 0.0001; n = 7) but not in SynTKO (one-way ANOVA within genotype: F5,30 = 0.29, P = 0.9; n = 7) and α-SynKO (one-way ANOVA within genotype: F5,30 = 0.41, P = 0.8 ; n = 5) mice. Two-way ANOVA between genotypes: F2,96 = 11.6, P < 0.0001; Tukey’s multiple comparison test: significance between WT and SynTKO in burst numbers 5 and 6 (P = 0.02, 0.007 respectively) and WT and α-SynKO between burst numbers 5 and 6 (P = 0.02, 0.01 respectively). (G) Facilitation of DA release during sweep 1 in WT (one-way ANOVA within genotype: F5,30 = 4.8, P = 0.0024; n = 7) and depression of DA release in SynTKO (one-way ANOVA within genotype: F5,30 = 13.0, P < 0.0001; n = 7) and α-SynKO (one-way ANOVA within genotype: F5,20 = 9.5, P < 0.0001 ; n = 5) animals during repeated trains of burst. Two-way ANOVA between genotypes: F2,96 = 7.9, P = 0.0006; Tukey’s multiple comparison test showed significance between WT and SynTKO in burst numbers 5 and 6 (P = 0.01, 0.004 respectively) and WT and α-SynKO between burst number 6 (P = 0.03). (H) Same data as G normalized to the first peak of each sweep. Two-way ANOVA between genotypes: F2,96 = 49.8, P < 0.0001; Tukey’s multiple comparison test showed significance between WT and SynTKO in burst numbers 2 to 6 (P = 0.04, 0.0008, <0.0001, <0.0001, <0.0001, respectively) and WT and α-SynKO between burst numbers 4 to 6 (P = 0.003, 0.0001, <0.0001, respectively). (I) Facilitation of DA release during sweep 6 in WT (one-way ANOVA within genotype: F5,30 = 2.9, P = 0.028) and depression of DA release in SynTKO (one-way ANOVA within genotype: F5,30 = 8.2, P < 0.0001; n = 7) and α-SynKO (one-way ANOVA within genotype: F5,20 = 6.1, P = 0.0013 ; n = 5) animals during repeated trains of burst. Two-way ANOVA between genotypes: F2,96 = 3.6, P = 0.03; Tukey’s multiple comparison test showed significance between WT and SynTKO in burst 1 (P = 0.006) and WT and α-SynKO between burst 1 (P = 0.03). (J) Same data as I normalized to the first peak of each sweep. Two-way ANOVA between genotypes: F2,96 = 49.8, P < 0.0001; Tukey’s multiple comparison test showed significance between WT and SynTKO in burst numbers 3 to 6 (P = 0.01, 0.0002, <0.0001, <0.0001, <0.0001, respectively) and WT and α-SynKO between burst numbers 4 to 6 (P = 0.03, 0.002, 0.0001, <0.0001, respectively). Data points represent mean ± SEM. * = P < 0.05, ** = P < 0.005.
Fig. 5.
Fig. 5.
Calcium signals in response to burst stimuli in vivo. (A) Changes in evoked GCaMP6f signal transients during single burst stimulation in WT (black) and α-SynKO (orange) mice represented as averaged sweep 6 fluorescence relative to sweep 1 signal. No change in the amplitude or t1/2 was detected. (B) No change in the mean AUC of GCaMP responses at any sweep number was detected between the WT (black) and α-SynKO (orange) lines (two-way ANOVA between genotypes: F1,54 = 0.5, P = 0.5; Bonferroni’s multiple comparison test did not show significance; WT, n = 6; α-SynKO, n = 5). Faint traces show recordings from individual mice, while traces in bold represent average ± SEM. (C) Changes in GCaMP6f transients in sweep 1 represented as averaged signals at burst 6 normalized to burst 1 in WT and α-SynKO mice (ΔF/F, normalized GCaMP6f fluorescence). While the amplitude of evoked Ca2+ signal remained the same between WT (black) and α-SynKO (magenta) mice, there was a small increase in the t1/2 of the sixth GCaMP6f transient in WT neurons. Green bars indicate stimulus duration. (D and E) AUC of GCaMP transients in sweep 1 (D) and in sweep 6 (E) was significantly higher in WT than α-SynKO animals. Sweep1, two-way ANOVA between genotypes: F1,54 = 51.5, P < 0.0001; Tukey’s multiple comparison test showed significance between WT and α-SynKO in burst numbers 4 to 6 (P = 0.001, 0.0004, <0.0001, respectively). Sweep 6, two-way ANOVA between genotypes: F1,54 = 16.7, P = 0.0001; Tukey’s multiple comparison test showed significance in bursts 5 and 6 (P = 0.003, 0.01). WT, n = 6; α-SynKO, n = 5. The error bars represent SEM. * = P < 0.05, ** = P < 0.005, *** = P < 0.0005.
Fig. 6.
Fig. 6.
Model of α-Syn effects on DA release in vivo. In this model, the amount of neurotransmitter release is rate-limited by the pool of synaptic vesicle/active zone complexes competent for fusion upon stimulation-dependent increase in calcium (the readily releasable pool [RRP], red). During the short intervals between repeated bursts (seconds; Left), α-Syn enhances the dilation and collapse of synaptic vesicles, which in turn enhances the recovery of the active zones. Faster replenishment of the RRP and recycling pool (RP) allows a larger number of synaptic vesicles to fuse in response to subsequent stimuli. In the absence of synuclein, active zones remain occupied for longer durations, and the replenishment of the RRP and RP is slower, resulting in presynaptic depression. With substantially longer intervals between bursts (minutes; Right), the difference due to the rapid effects on synaptic vesicle dilation and collapse are negligible, revealing an inhibitory effect of α-Syn on a slower rate of transfer of vesicles from a reserve pool (yellow) to the RRP, leading to stimulation-dependent synaptic depression that is not observed in the absence of α-Syn. Black points represent the dopamine molecules (filled vesicle = circle with black points, empty vesicle = circle with no ponts).

References

    1. Maroteaux L., Campanelli J. T., Scheller R. H., Synuclein: A neuron-specific protein localized to the nucleus and presynaptic nerve terminal. J. Neurosci. 8, 2804–2815 (1988). - PMC - PubMed
    1. Nakajo S., et al. , Purification and characterization of a novel brain-specific 14-kDa protein. J. Neurochem. 55, 2031–2038 (1990). - PubMed
    1. Iwai A., et al. , The precursor protein of non-A beta component of Alzheimer’s disease amyloid is a presynaptic protein of the central nervous system. Neuron 14, 467–475 (1995). - PubMed
    1. Jakes R., Spillantini M. G., Goedert M., Identification of two distinct synucleins from human brain. FEBS Lett. 345, 27–32 (1994). - PubMed
    1. Uéda K., et al. , Molecular cloning of cDNA encoding an unrecognized component of amyloid in Alzheimer disease. Proc. Natl. Acad. Sci. U.S.A. 90, 11282–11286 (1993). - PMC - PubMed

Publication types

MeSH terms