. 2020 Dec 3;11(1):6196.
doi: 10.1038/s41467-020-19877-5.

TGFβ promotes widespread enhancer chromatin opening and operates on genomic regulatory domains

Affiliations

TGFβ promotes widespread enhancer chromatin opening and operates on genomic regulatory domains

Jose A Guerrero-Martínez et al. Nat Commun. .

Abstract

The Transforming Growth Factor-β (TGFβ) signaling pathway controls transcription by regulating enhancer activity. How TGFβ-regulated enhancers are selected and what chromatin changes are associated with TGFβ-dependent enhancers regulation are still unclear. Here we report that TGFβ treatment triggers fast and widespread increase in chromatin accessibility in about 80% of the enhancers of normal mouse mammary epithelial-gland cells, irrespective of whether they are activated, repressed or not regulated by TGFβ. This enhancer opening depends on both the canonical and non-canonical TGFβ pathways. Most TGFβ-regulated genes are located around enhancers regulated in the same way, often creating domains of several co-regulated genes that we term TGFβ regulatory domains (TRD). CRISPR-mediated inactivation of enhancers within TRDs impairs TGFβ-dependent regulation of all co-regulated genes, demonstrating that enhancer targeting is more promiscuous than previously anticipated. The area of TRD influence is restricted by topologically associating domains (TADs) borders, causing a bias towards co-regulation within TADs.


Conflict of interest statement

The authors declare no competing interests.

Figures
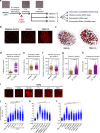
Fig. 1
Fig. 1. TGFβ provokes widespread enhancer chromatin opening.
a Flow diagram depicting experimental design. Vehicle-treated cells (control) were taken after 2 h of treatment. b Confocal microscope images of ATAC-see signals from NMuMG nuclei of cells cultured under the indicated conditions. Negative control shows ATAC-see signal obtained in the presence of 50 mM EDTA, which inhibits Tn5 transposome activity. Bar, 1 µm. Representative images out of twelve independent experiments are shown. c Representative images showing processing of ATAC-see 3D signal by TANGO software in cells treated with TGFβ or vehicle for 2 h. dh Quantification of ATAC-see images by using TANGO software. Scatter dot plots showing ATAC-see signal intensity (d), DAPI signal intensity (e), and number of puncta per nucleus (f) from 203 (vehicle) and 194 (2 h TGFβ) nuclei from two independent experiments. g, h Scatter dot plots showing volume of puncta expressed as pixels (g), and intensity of ATAC-see signal per puncta (h). Number of puncta analyzed: 80,839 for vehicle and 63,001 for 2 h TGFβ from 203 (vehicle) or 194 (2 h TGFβ) cells, from two independent experiments. Two-tailed Mann–Whitney test p-values are provided. i Fluorescence microscope images of ATAC-see signals from cells cultured under the indicated conditions. Bar, 10 µm. Representative images out of three independent experiments are shown. jl Quantification of ATAC-see signal intensity of nuclei at the indicated times (j) or 10 min after TGFβ or vehicle addition (k, l). k Cells were transfected 48 h before treatment with siControl (siC) or with two different siRNAs against SMAD4 (siSMAD4.1 or siSMAD4.2). l Cells were treated with 10 µM of SB431542, U0126, or Takinib for 2 h before TGFβ addition. Merged data from three independent experiments are shown. Statistical significance between indicated samples was determined by using the two-tailed Mann–Whitney test, ****p ≤ 0.0001. Quantified nuclei (n) in each scatter dot plot and exact p-values are provided in Supplementary Data 5. dh, jl The horizontal black line of the scatter dot plots represents the mean value. Source data are provided as a Source Data file.
Fig. 2
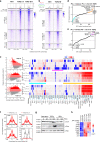
Fig. 2. ATAC-seq analysis of TGFβ-treated cells.
a, b Heatmaps showing alignment of ATAC-seq peaks signal from cells treated with vehicle, or TGFβ for 2 h or 12 h (a) or with vehicle or TGFβ for 10 min (b). Peaks are divided into four categories (FC < 1.5, 1.5 ≤  FC < 2, 2 ≤ FC < 4 and FC ≥ 4) based in change of ATAC-seq signal between TGFβ and vehicle for 2 h (a) or for 10 min (b). c TF occupancy depending on changes in accessibility at the indicated timepoint. Left: scatter plot of changes of ATAC-seq signal (y-axis, log2FC) versus average signal (x-axis). ATAC-seq peaks were divided into four categories according to FC as in (a and b). Right: TF genomic footprints enrichments were determined in the indicated category of ATAC-seq peaks. TF footprints were determined by calculating the protection from transposition observed in the ATAC-seq signal. TF motifs (from JASPAR) were identified in footprinted regions. Seventy of 550 are shown. d, e Differential footprint enrichment between FC ≥ 4 and FC < 1.5 of TGFβ or vehicle for 2 h (d) or for 10 min (e). Dots correspond to the same colored bars in c. f Example of TF footprint profile at 2 h after TGFβ. Accumulated Tn5 integrations (y-axis) along the indicated TF binding sites at nucleotide resolution (x-axis, bp from center of each TF motif) in ATAC peaks with FC ≥ 4 (red) and FC < 1.5 (gray). g Western blotting showing levels of Jun and Fos proteins under the indicated conditions. A representative image out of three independent biological replicates is shown. h Heatmap showing changes of mRNA levels by RNA-seq (log2FC) of genes encoding members of the AP-1 family. Source data are provided as a Source Data file.
Fig. 3
Fig. 3. Identification of distinct classes of enhancers regulated by TGFβ.
a Heatmaps showing ChIP-seq signal of H3K27ac, H3K4me1, and H3K4me3 at distinct categories of enhancers and at the indicated times. b Change of eRNA levels of different categories of enhancers shown in (a), at the indicated time. Intergenic eRNA-expressing enhancers were selected as described in Methods. Early-activated, n = 328; Late-activated, n = 313; Early-repressed, n = 131; late-repressed n = 418; TGFβ−independent, n=2414 enhancers. c Change of accessibility (ATAC-seq signal) of different categories of enhancers shown in a, 2 h (left panel) and 12 h (right panel) after TGFβ treatment. Each dot corresponds to an enhancer: early-activated (n = 2166), late-activated (n = 2242), early-repressed (n = 1059) late-repressed (n = 2654) and TGFβ-independent enhancers (20820). d Change of H3K27ac levels, 2 h (left panel) and 12 h (right panel) after TGFβ treatment, of the different enhancers classified according to change of accessibility as in Fig. 2a. FC < 1.5 (n = 4810), 1.5 ≤ FC < 2 (n = 8926), 2 ≤ FC < 4 (n = 14222) and FC ≥ 4 (n = 1113). Statistical significance in bd are given with respect to the TGFβ-independent category of enhancers (b, c) or the category FC < 1.5 (d) and were determined with the two-tailed Mann–Whitney non-parametric test, *p ≤ 0.01; **p ≤ 0.001; ***p ≤ 0.0001. Exact p-values are provided in Supplementary Data 5. b, d The horizontal black line of the boxplot and scatter plot represent the median and the mean value, respectively. The box spans the 25th to 75th percentiles, and whiskers indicate 5th and 95th percentiles. eg Screen shot of H3K27ac and ATAC-seq profiles at three different genomic regions. While ATAC signal increased in all enhancers shown, H3K27ac signal increases (e), decreases (f), or remained unchanged (g), upon TGFβ treatment. h Enrichment of TF footprints at the indicated categories of enhancers with respect to the rest of categories. On the y-axes, −log10 (p-value) of enrichment (Fisher’s exact test) for each TF is represented. i SMAD2/3 ChIP-seq signal density in the different categories of enhancers. Source data are provided as a Source Data file.
Fig. 4
Fig. 4. Most TGFβ-dependent genes are in the TGFβ-regulated enhancers neighborhood.
a Change of mRNA levels (RNA-seq signal of 2 h TGFβ versus vehicle) for genes upstream or downstream of an early-activated (left) or early-repressed (right) enhancer, as in the scheme (red boxes), or of a randomly selected enhancer (gray boxes). For randomization, see Methods. Eg±n (whereby n = 1, 2, 3 or 4) depicts genes that occupy the first, second, third, or fourth positions, respectively, in the chromosomal order, upstream (−) or downstream (+) of the enhancer. Plots for late-enhancer categories are shown in Supplementary Fig. 8a. b Change of mRNA levels (RNA-seq signal of 2 h TGFβ versus vehicle) of genes located at the indicated distance (kb) upstream or downstream of an early-activated (top left) or early-repressed (top right) enhancer. Inclusion of the genes in the interval was determined by the position of their TSSs. Lower panels represent the corresponding data when enhancers were randomized. Plots for other enhancer categories are shown in Supplementary Fig. 8b. c Correlation plot between changes of mRNA levels (RNA-seq signal of 2 h TGFβ versus vehicle) of the first, second, third, or fourth closest genes respect to an enhancer, versus the change of H3K27ac of the enhancer (ChIP-seq signal of 2 h TGFβ versus vehicle). Data were binned into 20 intervals. Spearman correlation coefficient and slope of the regression line are shown. d Change of mRNA levels (RNA-seq signal of 2 h TGFβ versus vehicle) for genes that are located around an early-activated enhancer. Only enhancers for which the second-closest gene (marked in red) upstream (Eg-2) or downstream (Eg+2) was robustly upregulated (log2 FC > 1; adjusted p < 0.05) were considered. Gray color boxes correspond to change of mRNA levels of genes around a random enhancer. Plots for other enhancer categories are shown in Supplementary Fig. 9. a, b, d Statistical significance between real and random distributions were determined with the two-tailed Mann–Whitney test, *p ≤ 0.05; **p ≤ 0.01; ***p ≤ 0.001. Sample size of each distribution and exact p-values are provided in Supplementary Data 5. The horizontal black line of the boxplot represents the median value, the box spans the 25th to 75th percentiles, and whiskers indicate 5th and 95th percentiles. Source data are provided as a Source Data file.
Fig. 5
Fig. 5. Co-regulated clusters of TGFβ-regulated genes.
a, b Examples of clusters of TGFβ co-regulated genes. Screenshot of RNA-seq tracks at two different genomic regions. Numbers show Log2FC of the indicated gene at the corresponding timepoint of TGFβ versus vehicle. c Changes of mRNA levels (RNA-seq) of the four genes located upstream (n − 1 to n − 4) and downstream (n + 1 to n + 4) of a robustly TGFβ-regulated gene (|log2FC | >1; adjusted p < 0.05) at position n. The central gene (n) is early-upregulated (left) or early-downregulated (right). Gray boxes correspond to the changes of mRNA levels of genes around a random gene. For randomization, see Methods. d Change of mRNA levels (RNA-seq) of genes located at the indicated distance (kb) upstream or downstream of a TGFβ-regulated gene. Left: the central gene is early-upregulated. Right: the central gene is early-downregulated. Randomizations are shown in Supplementary Fig. 10d. c, d Statistical significance between real and random distributions were determined with the two-tailed Mann–Whitney non-parametric test, *p ≤ 0.05; **p ≤ 0.01; ***p ≤ 0.001. Sample size (n) of each distribution and exact p-values are provided in Supplementary Data 5. The horizontal black line of the boxplot represents the median value, the box spans the 25th to 75th percentiles, and whiskers indicate 5th and 95th percentiles. A black dot in the boxplot represent the mean. e Changes of intergenic transcription in the neighborhood (±250 kb binned in 10 kb bins) of a TGFβ-regulated gene (TRG) normalized to random. ChromRNA-seq data were used. To avoid termination read-through and promoter-divergent transcription, regions of 2 kb upstream and downstream of the TSS and transcription termination site were not considered. f Change of H3K27ac (ChIP-seq signal) in the neighborhood (±250 kb binned in 10 kb bins) of a TGFβ-regulated TSS normalized to random. To avoid histone modifications of the TGFβ-regulated TSS, regions of 5 kb upstream and downstream of the TSS were not considered. cf Late-upregulated and late-downregulated categories are shown in Supplementary Fig. 10b, c, e, f. g Meta-analysis of TRDs. Density plots of changes of mRNA, eRNA, and H3K27ac levels are shown. Data from early- and late-upregulated or downregulated TRDs were pooled. Source data are provided as a Source Data file.
Fig. 6
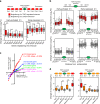
Fig. 6. CRISPR-mediated enhancer inactivation demonstrates promiscuous activity of enhancers on neighboring genes.
a, c, e Screenshot of H3K27ac, H3K4me1, H3K4me3, RNA-seq, and ATAC-seq tracks at three different genomic regions. Position of a TGFβ-regulated enhancer is shown. For the inactivation of the enhancers by CRISPRi, two different sgRNAs (pink) that target each enhancer were used. b, d, f Determination of mRNA levels of the indicated genes by RT-qPCR analysis. Values were normalized to the Gapdh mRNA level. Values are average ± SEM of at least six determinations from three independent experiments. Statistical significance of the values with respect to the same timepoint of the negative control (a non-targeting sgRNA, sgGal4) were determined with the two-tailed Mann–Whitney non-parametric test. *p ≤ 0.05; **p ≤ 0.01; ***p ≤ 0.001. Sample size (n) of each distribution and exact p-values are provided in Supplementary Data 5. Source data are provided as a Source Data file.
Fig. 7
Fig. 7. TRDs Differ from TADs but are Constrained by TAD Borders.
ad Changes of mRNA levels (2 h TGFβ versus vehicle) of genes contained at the indicated TADs. Co-regulated genes at TRDs are shown. e Top panel: ratio of observed versus expected frequencies of TADs with distinct proportions of genes with upregulated or downregulated FC (FC > 1 or FC < 1; 2 h TGFβ versus vehicle). Values are means ± SD. Bottom: histogram of the frequencies of TADs for the observed (blue) or randomized (orange) position of genes. TADs (n = 688) were binned into ten intervals depending on the percentage of up- versus downregulated genes. Significance was determined by comparing the real value with 500 randomizations of the gene order (see Methods). Probabilities (p) of the real number considering Normal distribution are provided. **p ≤ 0.001; ***p ≤ 0.0001. Exact p-values are provided in Supplementary Data 5. Data for 12 h are given in Supplementary Fig. 15 c. f Correlation between change of expression (12 h TGFβ versus vehicle) of every pair of expressed contiguous genes (x, y) of the genome using real chromosomal order (left), random gene order (middle) or pairs of contiguous genes separated by a TAD border (right). Spearman correlation coefficient and p-values are shown. Data were binned into 20 intervals. Data for 2 h are given in Supplementary Fig. 15d. g Correlation plot between change of H3K27ac signals of enhancers (ChIP-seq signal 2 h TGFβ versus vehicle) and change of mRNA level (RNA-seq signal 2 h TGFβ versus vehicle) of their closest gene separated by real (left), or by random TAD borders (right). Data were binned into 20 intervals. Data for 12 h are given in Supplementary Fig. 15e. h Model of influence of TGFβ-regulatory domains (TRD) and other regulatory domains (RD) constrained by the insulating activity of TAD borders. Small TADs can harbor a single RD. Source data are provided as a Source Data file.

Similar articles

Cited by

References

    1. David CJ, Massague J. Contextual determinants of TGFbeta action in development, immunity and cancer. Nat. Rev. Mol. Cell Biol. 2018;19:419–435. doi: 10.1038/s41580-018-0007-0. - DOI - PMC - PubMed
    1. Colak S, Ten Dijke P. Targeting TGF-beta signaling in cancer. Trends Cancer. 2017;3:56–71. doi: 10.1016/j.trecan.2016.11.008. - DOI - PubMed
    1. Derynck R, Budi EH. Specificity, versatility, and control of TGF-β family signaling. Sci. Signal. 2019;12:eaav5183. doi: 10.1126/scisignal.aav5183. - DOI - PMC - PubMed
    1. Hill CS, et al. Transcriptional Control by the SMADs. CSH Perspect. Biol. 2016;8:a022079. - PMC - PubMed
    1. Mullen AC, et al. Master transcription factors determine cell-type-specific responses to TGF-beta signaling. Cell. 2011;147:565–576. doi: 10.1016/j.cell.2011.08.050. - DOI - PMC - PubMed

Publication types