

State-level tracking of COVID-19 in the United States
- PMID: 33273462
- PMCID: PMC7712910
- DOI: 10.1038/s41467-020-19652-6
State-level tracking of COVID-19 in the United States
Abstract
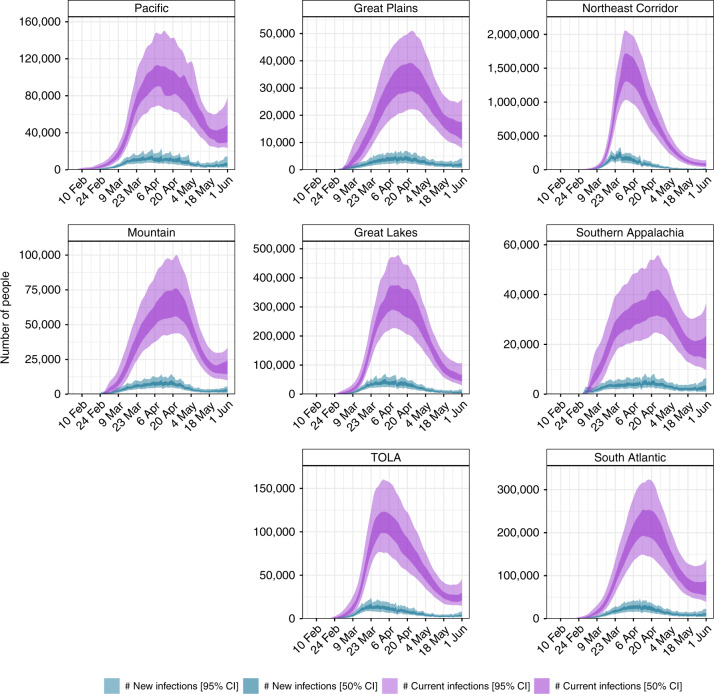
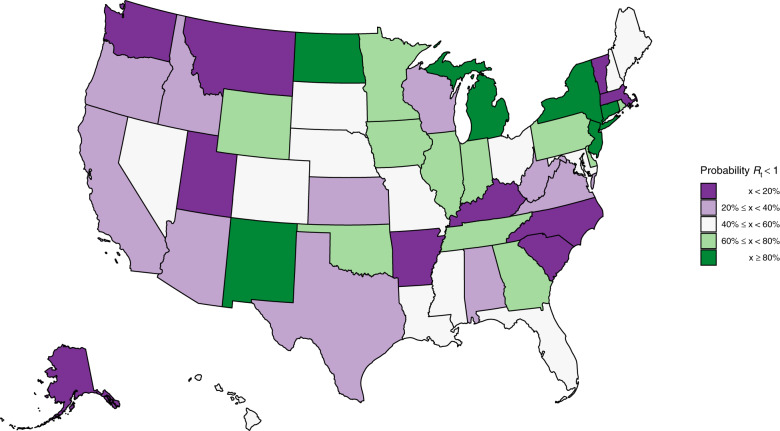
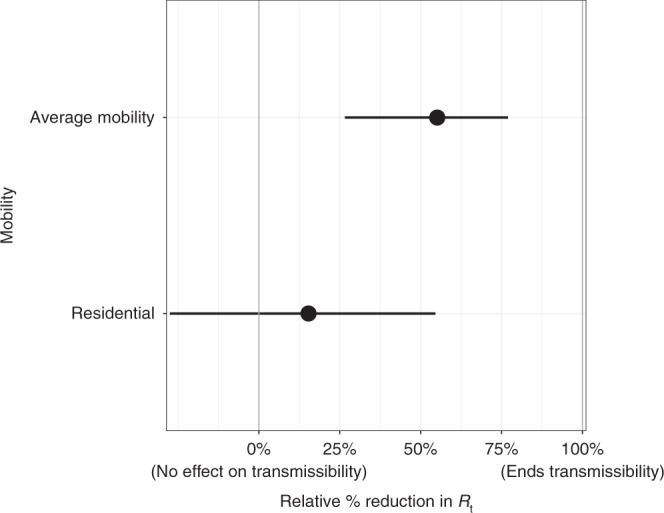
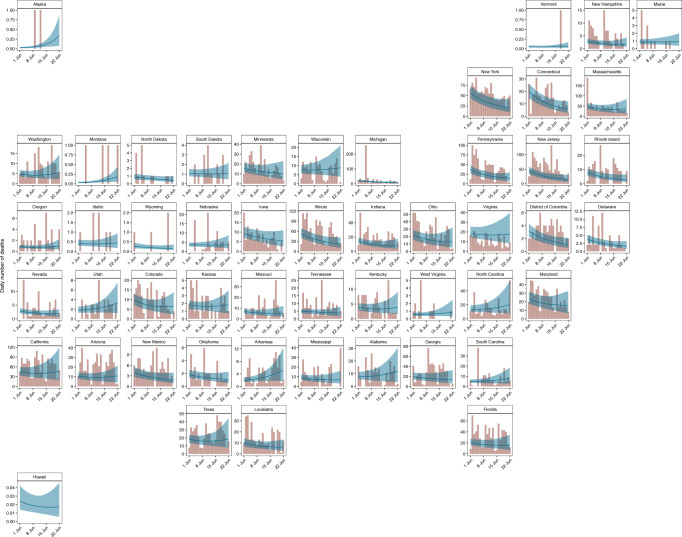
As of 1st June 2020, the US Centres for Disease Control and Prevention reported 104,232 confirmed or probable COVID-19-related deaths in the US. This was more than twice the number of deaths reported in the next most severely impacted country. We jointly model the US epidemic at the state-level, using publicly available death data within a Bayesian hierarchical semi-mechanistic framework. For each state, we estimate the number of individuals that have been infected, the number of individuals that are currently infectious and the time-varying reproduction number (the average number of secondary infections caused by an infected person). We use changes in mobility to capture the impact that non-pharmaceutical interventions and other behaviour changes have on the rate of transmission of SARS-CoV-2. We estimate that Rt was only below one in 23 states on 1st June. We also estimate that 3.7% [3.4%-4.0%] of the total population of the US had been infected, with wide variation between states, and approximately 0.01% of the population was infectious. We demonstrate good 3 week model forecasts of deaths with low error and good coverage of our credible intervals.
Conflict of interest statement
The authors declare no competing interests.
Figures
References
-
- Santa Clara County Public Health. County of Santa Clara Identifies Three Additional Early Covid-19 Deaths (2020). https://www.sccgov.org/sites/covid19/Pages/press-release-04-21-20-early.....
-
- Courtemanche, C., Garuccio, J., Le, A., Pinkston, J. & Yelowitz, A. Strong social distancing measures in the United States reduced the COVID-19 growth rate. Health Aff. 39, 7 (2020). - PubMed
-
- Aktay, A. et al. Google COVID-19 Community Mobility Reports: Anonymization Process Description (version 1.0) (Google, 2020).
Publication types
MeSH terms
Grants and funding
LinkOut - more resources
Full Text Sources
Medical
Research Materials
Miscellaneous
