. 2020 Dec 3;10(1):21159.
doi: 10.1038/s41598-020-78193-6.

SIRT3, a metabolic target linked to ataxia-telangiectasia mutated (ATM) gene deficiency in diffuse large B-cell lymphoma

Affiliations

SIRT3, a metabolic target linked to ataxia-telangiectasia mutated (ATM) gene deficiency in diffuse large B-cell lymphoma

Kavita Bhalla et al. Sci Rep. .

Abstract

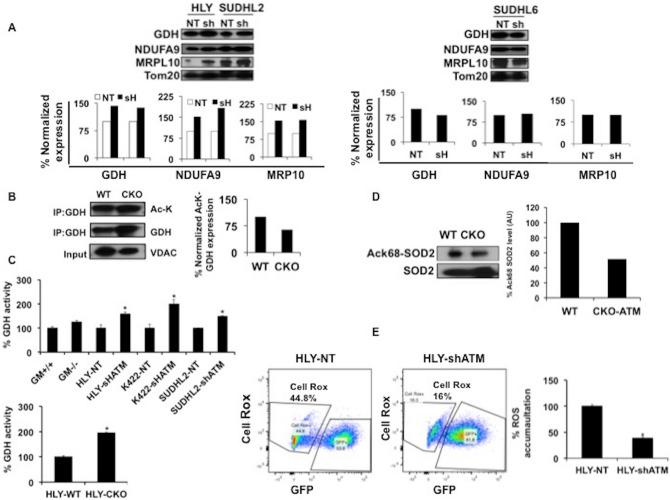
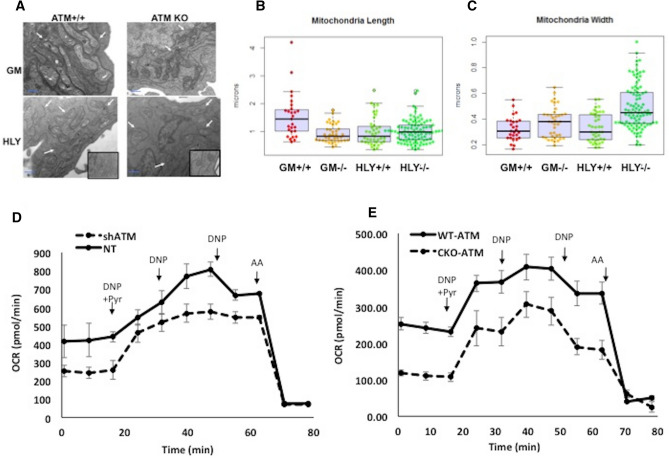
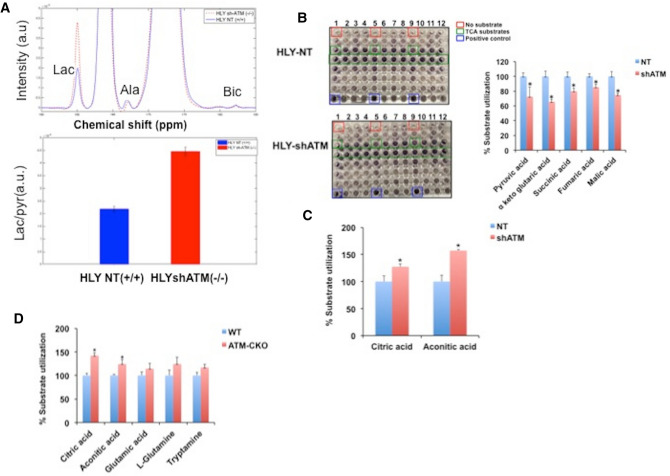
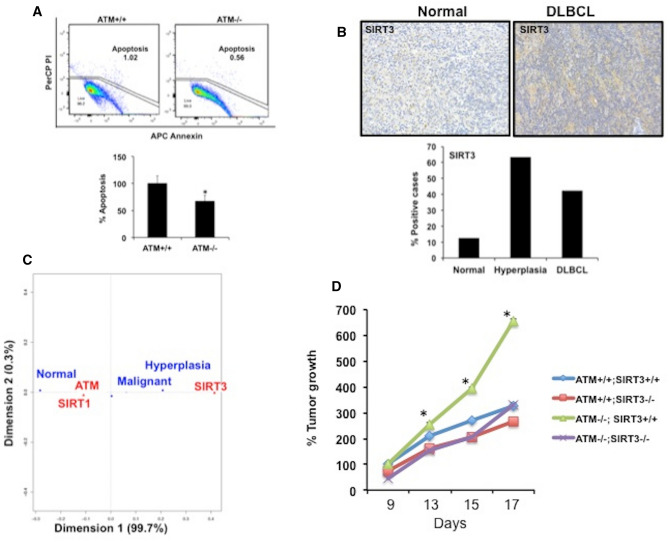
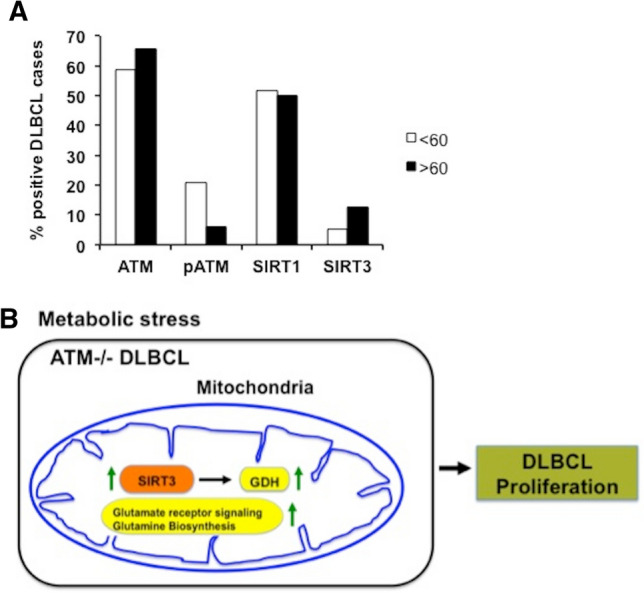
Inactivation of Ataxia-telangiectasia mutated (ATM) gene results in an increased risk to develop cancer. We show that ATM deficiency in diffuse large B-cell lymphoma (DLBCL) significantly induce mitochondrial deacetylase sirtuin-3 (SIRT3) activity, disrupted mitochondrial structure, decreased mitochondrial respiration, and compromised TCA flux compared with DLBCL cells expressing wild type (WT)-ATM. This corresponded to enrichment of glutamate receptor and glutamine pathways in ATM deficient background compared to WT-ATM DLBCL cells. ATM-/- DLBCL cells have decreased apoptosis in contrast to radiosensitive non-cancerous A-T cells. In vivo studies using gain and loss of SIRT3 expression showed that SIRT3 promotes growth of ATM CRISPR knockout DLBCL xenografts compared to wild-type ATM control xenografts. Importantly, screening of DLBCL patient samples identified SIRT3 as a putative therapeutic target, and validated an inverse relationship between ATM and SIRT3 expression. Our data predicts SIRT3 as an important therapeutic target for DLBCL patients with ATM null phenotype.


Conflict of interest statement

The authors declare no competing interests.

Figures

Figure 1
Figure 1
Regulation in SIRT3 axis in response to ATM deficiency in DLBCL. (A) Gene clustering illustrated by a heatmap of gene expression across samples (n = 3/group) indicate glutamate receptor and glutamine synthesis gene targets as top regulated pathways in shATM cell line compared to its non-target control (NT). Genes associated with top regulated pathways identified by IPA are indicated in heat map by red arrows. Gene expression values come from log2 raw counts generated by htseq-count. Heat map was created using the R library Complex Heatmap, which is part of Bioconductor software (3.1): http://bioconductor.org/packages/release/bioc/html/ComplexHeatmap.html. (B,C) Western blot analysis and quantitation of SIRT3 expression from fractionated cellular extracts (B) from total cell lysate (C) from mitochondrial cell lysates obtained from ABC-DLBCL cell lines HLY and SUDHL2 (L2) and GCB-DLBCL cell lines SUDHL6 (L6). Quantitation of SIRT3 protein expression is depicted below. The western analysis data and bar chart illustrating relative quantitation presented in (B) and (C) are the representative experiment of three independent experiments that were initiated from independent cell culture preparations. (D) SIRT3 expression in CRISPR-knockout (CKO) ATM DLBCL cell line, HLY. Size of mitochondrial isoform of SIRT3 (28 kDa) is depicted. The expression level of SIRT3 in CKO-ATM DLBCL cell line as determined by western blot analysis depicted here is a representative experiment of three independent experiments.
Figure 2
Figure 2
ATM inhibition stimulated SIRT3 activity in DLBCL. (A) Expression of SIRT3 targets in DLBCL cell lines inhibited for ATM expression compared to non-target controls. Expression of these targets in ABC DLBCL cell lines (HLY AND SUDHL2) and GCB cell line (SUDHL6) is depicted and quantitated normalized expression is provided below. Protein expression was quantitated using Image J software. Protein expression in shATM-DLBCL cell lines is expressed as relative percentage expression compared to non-target control. Protein abundance data shown here is a representative from triplicate experiments that were initiated from independent cell cultures. (B) Effects of SIRT3 on GDH acetylation in ATM-WT and ATM deficient DLBCL cell line HLY. Western blotting was performed using AcK and GDH antibodies on immunoprecipitated (IP) GDH. Protein expression was quantitated using Image J software. Percentage of GDH acetylation normalized to total GDH expression is depicted. VDAC was used as input control loading. The images are representative of two independent experiments. All western blots were run under same experimental conditions. (C) GDH activity assay in GM control cells and DLBCL cell lines expressing nt-shRNA and ATM-shRNA, experiments were repeated three times and data are expressed as mean + SD, asterisks define significant difference *p < 0.05. (D) Percentage acetylation of SOD2 as determined by Ack-68-SOD2 antibody in ATM CRISPR knock out (CKO) DLBCL cells compared to WT-ATM. The percentage decrease in acetylated SOD2 expression in ATM-CKO cells was estimated by normalizing the acetylated expression levels to total SOD2 levels in both wild type-ATM and ATM deficient DLBCL groups. The images are representative of two independent experiments. All western blots were run under same experimental conditions. (E) Representative density blots of FACs analysis showing percentage ROS accumulation in DLBCL transduced with GFP tagged lentiviral particles expressing nt-shRNA and ATM-shRNA. Experiment was repeated n = 3, data are expressed as mean + SD, asterisks define significant difference p < 0.05.
Figure 3
Figure 3
Electron microscopy and oxygen consumption rate (OCR) in ATM+/+ and ATM−/− normal B-cell (GM) and DLBCL (HLY) cells. (A) Representative electron microscopy (EM) images of mitochondrial structure in ATM+/+ (GM02184), ATM−/− (GM03332) and DLBCL cell lines, HLY-NT and shATM-HLY. Arrows pointing out mitochondria are shown in respective groups. Three replicates were used in respective groups for EM imaging. (B) Mitochondria length in GM control and DLBCL cell lines modified for ATM expression. Length of mitochondria in GM 02184 cells with wild type ATM+/+ was significantly more compared to mitochondrial length in ATM−/− GM03332 and malignant HLY cells both with WT-ATM and ATM−/−, n = 3, p < 0.01. (C) Mitochondria width in GM control and DLBCL cell lines modified for ATM expression. Each dot represents one mitochondrion and crossbars represent mean + SD. No significant difference was observed in mitochondrial width between ATM+/+ GM 02184, ATM−/− GM03332 and malignant ATM-WT HLY cells. The mitochondria in ATM−/− HLY group were significantly wider in shape compared to mitochondria in normal ATM+/+ GM 02184 cells, p < 0.01. (D,E) Representative OCR traces from the DLBCL cell line HLY. Cells were genetically inhibited for ATM signaling using (D) lentiviral approach or (E) CRISPR. OCR was measured during the sequential addition of uncoupler DNP plus 10 mM pyruvate (Pyr), DNP alone twice, and finally an inhibitor of respiration, antimycin A, using Seahorse Extracellular Flux Analyzer. Inhibition of ATM decreased respiration rate in ATM−/−HLY cells compared with WT-ATM-HLY cells. Data are derived from n = 3 passages per cell line. Each experiment was set using n = 5–6 replicates per ATM+/+ and ATM−/− cells. Graphs are represented as mean + SD of three independent experiments.
Figure 4
Figure 4
Metabolic measurements in DLBCL cells using hyperpolarized [1-C] pyruvate and BiOLOG assay. (A) The top panel represents the spectra chart for hyperpolarized C signal at ambient temperature after dissolution. Blue and red spectra correspond to metabolic process in the presence of HLY-NT (+/+) and HLY SH (−/−). Both spectra are normalized with respect to maximum pyruvate signal. HLY sh-ATM (−/−) shows higher conversion of pyruvate into lactate. In the spectra pyruvate, lactate, pyruvate hydrate, alanine and bicarbonate signals are at 172.8, 184.9, 181, 178.4, and 162.7 ppm, respectively. Bottom panel represents Lactate-to-pyruvate ratios for HLY NT (+/+) and HLY sh-ATM (−/−) cell lines in blue and red, respectively (n = 3 for each cell line). Experiment was repeated three times, data are expressed as mean + SE. (B) Suspension of DLBCL cells were seeded on a 96 well pate coated with BiOLOG metabolic substrates. Representative assay plate is depicted. Well with no substrate and positive control are boxed. Each metabolite is spotted as n = 3 in the metabolite array. Percentage of TCA substrate utilized by HLY-NT and HLY-shATM cells is depicted on the right, n = 3, *p < 0.05. (C,D) Quantitation of metabolic substrate other than TCA substrates utilization in DLBCL genetically inhibited for ATM (C) (sh-ATM) and (D) [CRISPR (CKO)] compared to WT-ATM control cells, n = 3. Experiments in (C,D) were repeated three times. Values are presented as mean + SE and asterisks define significant difference, p < 0.05.
Figure 5
Figure 5
Effect of ATM deficiency and SIRT3 expression on DLBCL growth and clinical relevance in DLBCL (A) Representative density blot showing cell growth in DLBCL cell lines HLY (CRISPR-ATM) compared to WT-ATM control as determined by annexin V staining. Percentage apoptosis is depicted. Apoptosis observed in WT-ATM was set to 100%, p < 0.05, n = 3, + SD. Experiment was repeated three times. Representative image of dot blot is depicted in the figure. (B) Tumor tissue microarray (TMA) staining of DLBCL patient samples and normal controls. The percentage of tumors positive for SIRT3 staining in normal, hyperplastic and DLBCL cases is indicated. (C) Correspondence analysis of TMA data to establish the relationship between ATM, SIRT1, SIRT3 and DLBCL phenotype. The position of a variable from the origin on the CA graph indicates the extent of similarity of its response profile compared to the average. ATM and SIRT1 are closer to the origin, which indicates their contribution to DLBCL is small. The farther location of SIRT3 from origin implies a larger deviation from the expected contribution and its importance to DLBCL. (D) SIRT3 expression in DLBCL cells (HLY-WT; HLY-CKO-ATM) was inhibited using SIRT3 lentiviral particles. Growth effects of SIRT3 inhibition on tumorigenesis in NSG mice in presence and absence of ATM signaling were monitored in vivo. Tumor values were calculated from n = 10 animals per group + SE, p < 0.05.
Figure 6
Figure 6
Hypothesis of how inverse relationship between ATM and SIRT3 promotes DLBCL. (A) Staining of DLBCL patient samples and normal controls cases spotted on TMA for ATM, pATM, SIRT1 and SIRT3. The percentage of tumors positive for staining of respective markers in normal and DLBCL cases was scored and the data was sorted by age into respective groups < 60 and > 60. (B) Schematic of hypothesis depicting a role of SIRT3 in ATM deficient background.

References

    1. Kastan MB, Lim DS. The many substrates and functions of ATM. Nat. Rev. Mol. Cell Biol. 2000;1:179–186. doi: 10.1038/35043058. - DOI - PubMed
    1. Gumy-Pause F, Wacker P, Sappino AP. ATM gene and lymphoid malignancies. Leukemia. 2004;18:238–242. doi: 10.1038/sj.leu.2403221. - DOI - PubMed
    1. Stankovic T, et al. ATM mutations in sporadic lymphoid tumours. Leukemia Lymphoma. 2002;43:1563–1571. doi: 10.1080/1042819021000002884. - DOI - PubMed
    1. Hathcock KS, et al. ATM deficiency promotes development of murine B-cell lymphomas that resemble diffuse large B-cell lymphoma in humans. Blood. 2015;126:2291–2301. doi: 10.1182/blood-2015-06-654749. - DOI - PMC - PubMed
    1. Borghesani PR, et al. Abnormal development of Purkinje cells and lymphocytes in Atm mutant mice. Proc. Natl. Acad. Sci. USA. 2000;97:3336–3341. doi: 10.1073/pnas.050584897. - DOI - PMC - PubMed

Publication types

MeSH terms