

Forecasting the long-term trend of COVID-19 epidemic using a dynamic model
- PMID: 33273592
- PMCID: PMC7713358
- DOI: 10.1038/s41598-020-78084-w
Forecasting the long-term trend of COVID-19 epidemic using a dynamic model
Abstract
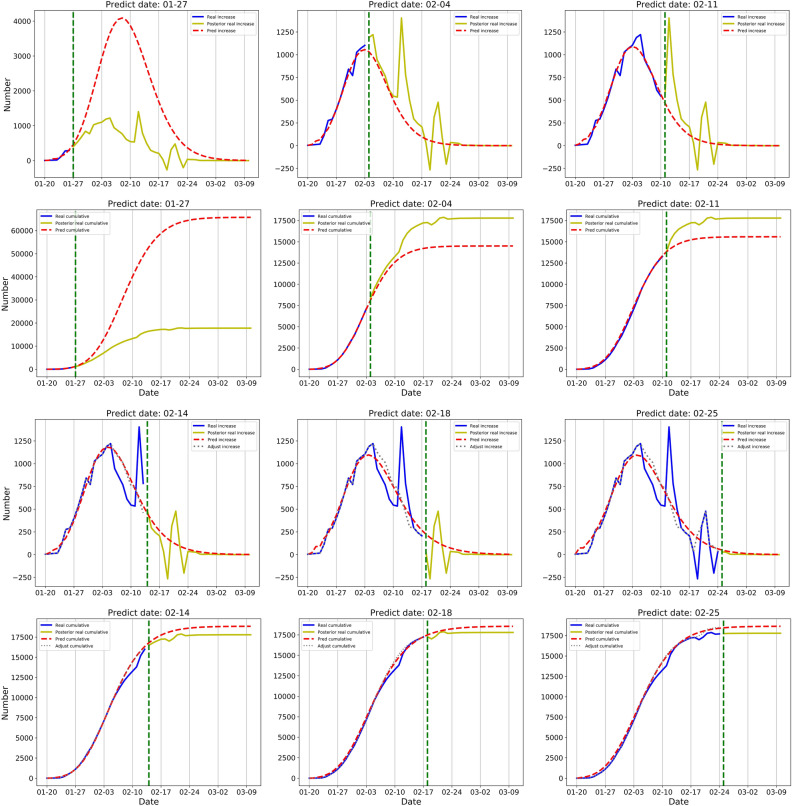
The current outbreak of coronavirus disease 2019 (COVID-19) has recently been declared as a pandemic and spread over 200 countries and territories. Forecasting the long-term trend of the COVID-19 epidemic can help health authorities determine the transmission characteristics of the virus and take appropriate prevention and control strategies beforehand. Previous studies that solely applied traditional epidemic models or machine learning models were subject to underfitting or overfitting problems. We propose a new model named Dynamic-Susceptible-Exposed-Infective-Quarantined (D-SEIQ), by making appropriate modifications of the Susceptible-Exposed-Infective-Recovered (SEIR) model and integrating machine learning based parameter optimization under epidemiological rational constraints. We used the model to predict the long-term reported cumulative numbers of COVID-19 cases in China from January 27, 2020. We evaluated our model on officially reported confirmed cases from three different regions in China, and the results proved the effectiveness of our model in terms of simulating and predicting the trend of the COVID-19 outbreak. In China-Excluding-Hubei area within 7 days after the first public report, our model successfully and accurately predicted the long trend up to 40 days and the exact date of the outbreak peak. The predicted cumulative number (12,506) by March 10, 2020, was only 3·8% different from the actual number (13,005). The parameters obtained by our model proved the effectiveness of prevention and intervention strategies on epidemic control in China. The prediction results for five other countries suggested the external validity of our model. The integrated approach of epidemic and machine learning models could accurately forecast the long-term trend of the COVID-19 outbreak. The model parameters also provided insights into the analysis of COVID-19 transmission and the effectiveness of interventions in China.
Conflict of interest statement
The authors declare no competing interests.
Figures


References
-
- WHO. Naming the coronavirus disease (COVID-19) and the virus that causes it. https://www.who.int/emergencies/diseases/novel-coronavirus-2019/technica... (2020).
-
- CSSE at Johns Hopkins University. Coronavirus COVID-19 Global Cases by the Center for Systems Science and Engineering (CSSE) at Johns Hopkins University (JHU).https://www.arcgis.com/apps/opsdashboard/index.html#/bda7594740fd4029942... (2020).
-
- WHO. WHO Director-General's opening remarks at the media briefing on COVID-19. Available at https://www.who.int/director-general/speeches/detail/who-director-genera.... 11 Mar 2020 (2020).
-
- Zhou, X. et al. Forecasting the Worldwide Spread of COVID-19 based on Logistic Model and SEIR Model. medRxiv, 2020.2003.2026.20044289. 10.1101/2020.03.26.20044289 (2020).
Publication types
MeSH terms
LinkOut - more resources
Full Text Sources
Medical
