. 2020 Dec 3;10(1):21167.
doi: 10.1038/s41598-020-78398-9.

Bladder urothelium converts bacterial lipopolysaccharide information into neural signaling via an ATP-mediated pathway to enhance the micturition reflex for rapid defense

Affiliations

Bladder urothelium converts bacterial lipopolysaccharide information into neural signaling via an ATP-mediated pathway to enhance the micturition reflex for rapid defense

Norichika Ueda et al. Sci Rep. .

Abstract

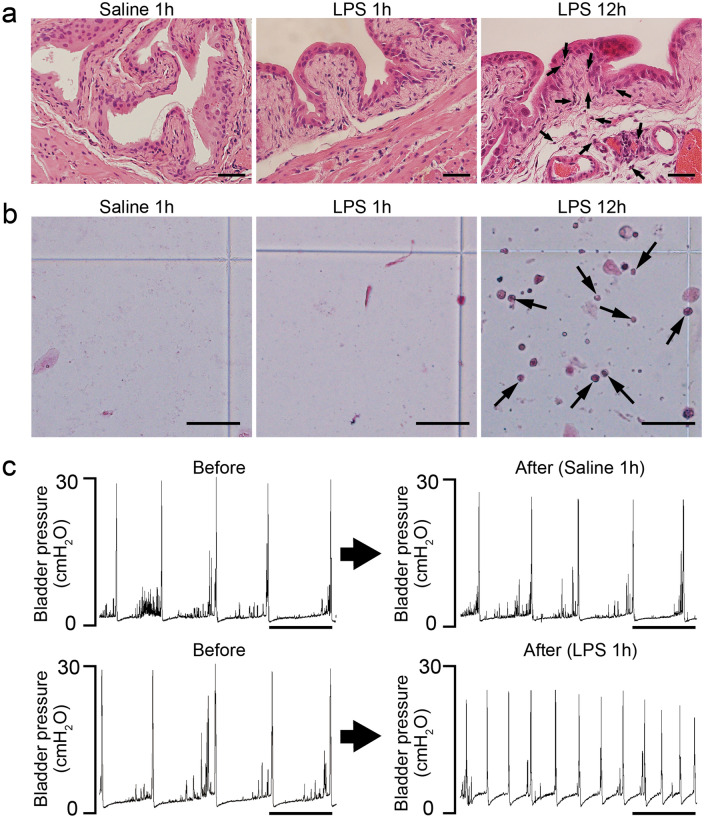
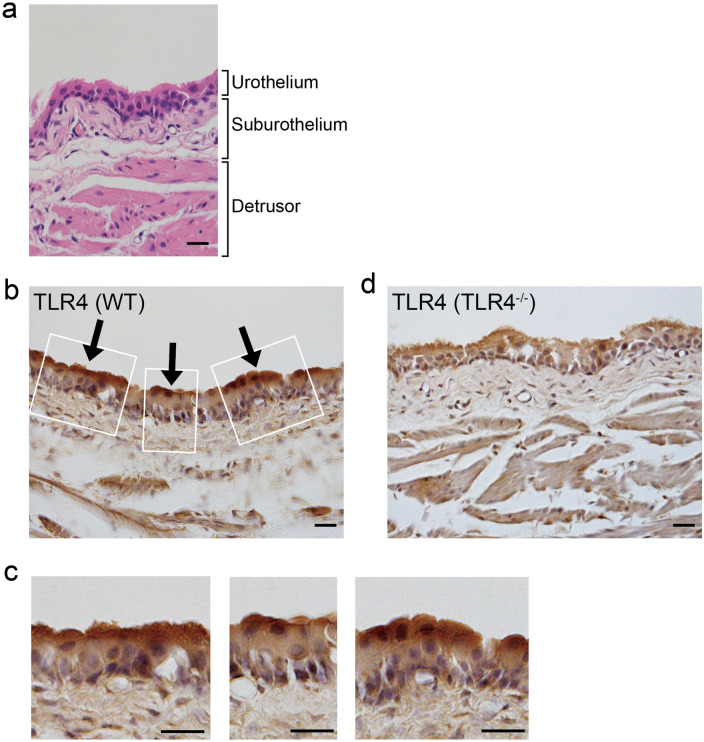
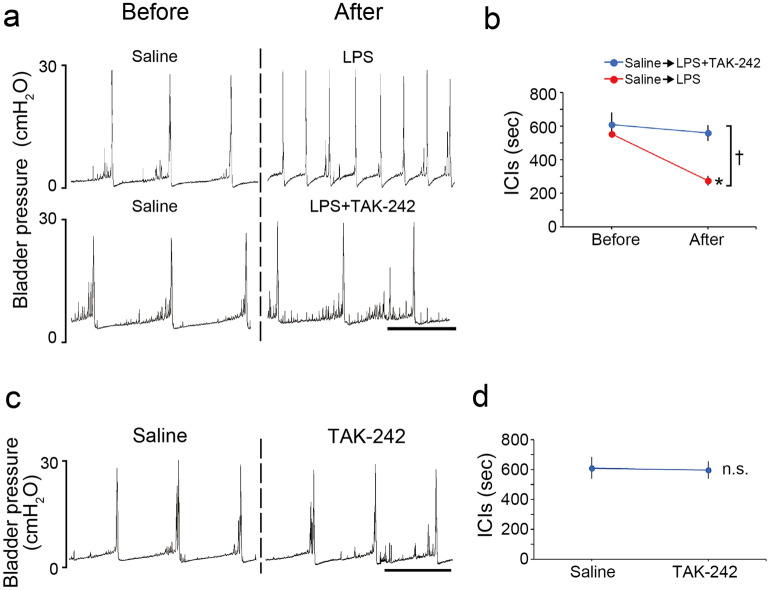
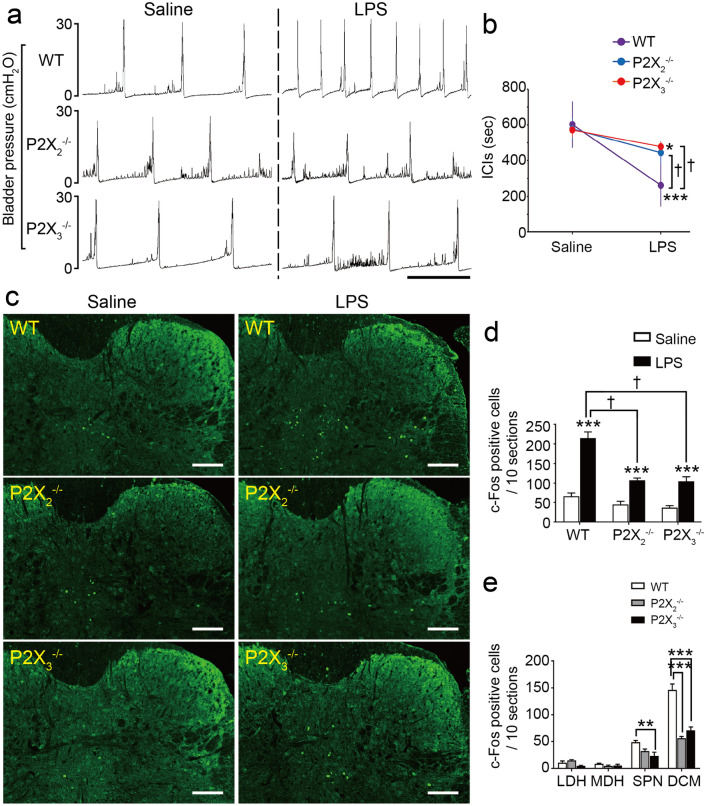
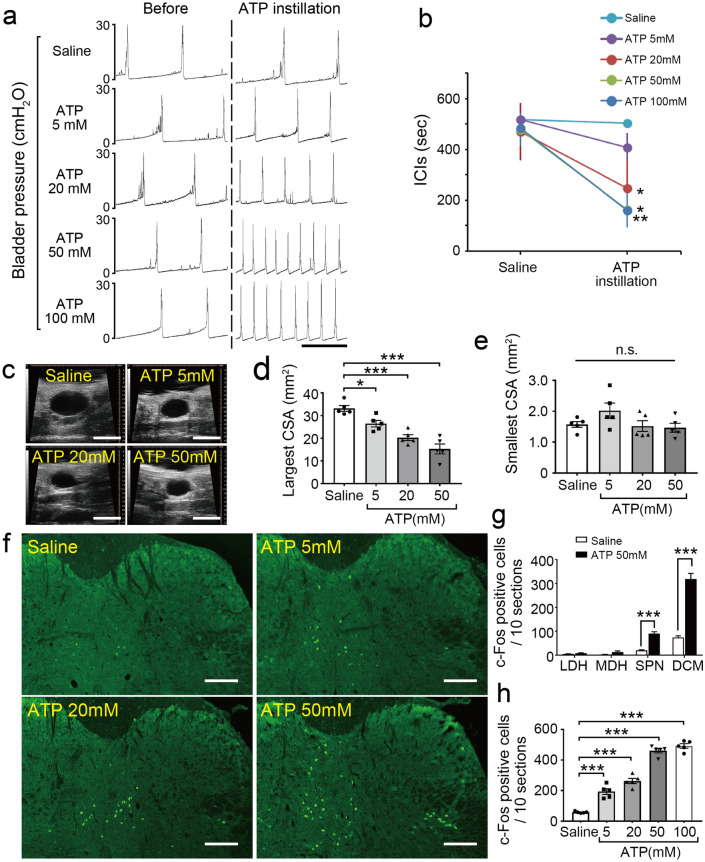
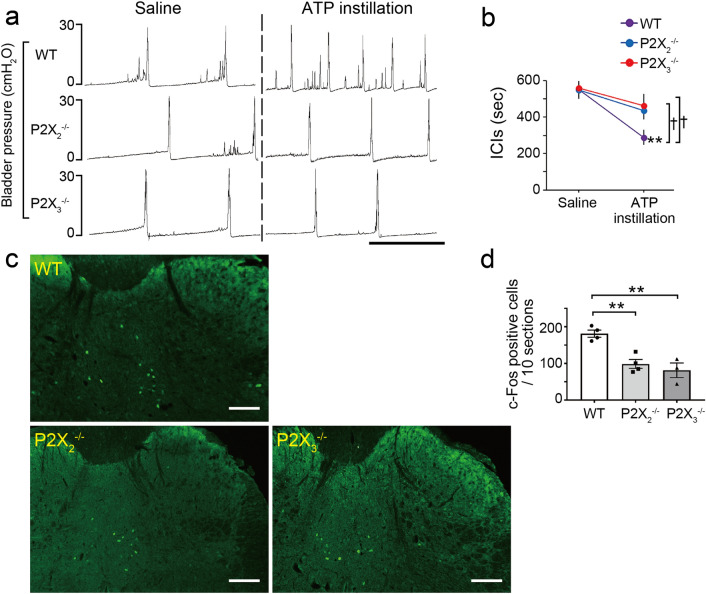
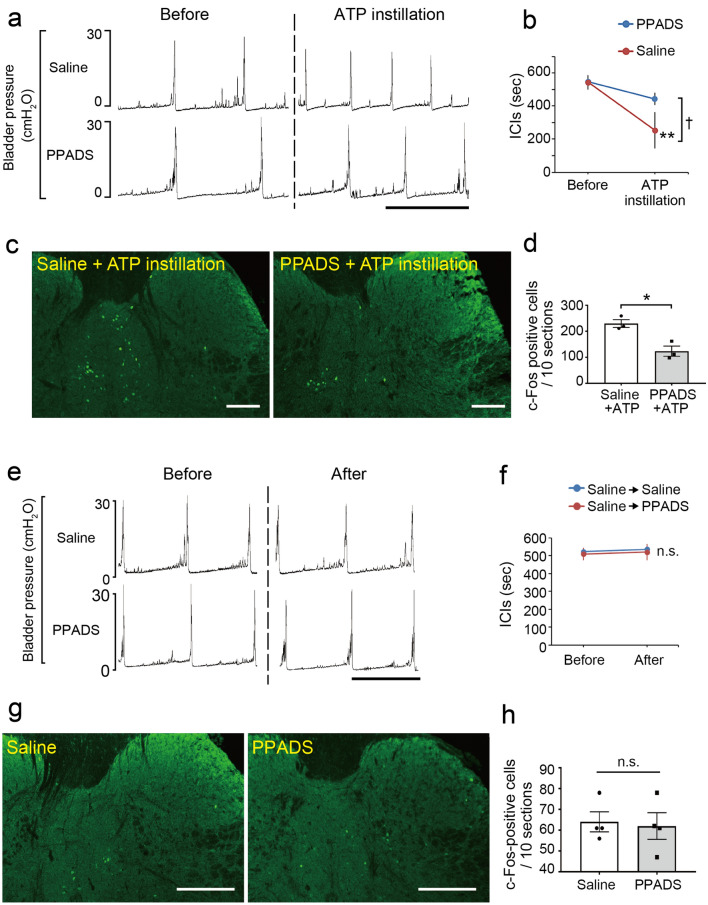
When bacteria enter the bladder lumen, a first-stage active defensive mechanism flushes them out. Although urinary frequency induced by bacterial cystitis is a well-known defensive response against bacteria, the underlying mechanism remains unclear. In this study, using a mouse model of acute bacterial cystitis, we demonstrate that the bladder urothelium senses luminal extracellular bacterial lipopolysaccharide (LPS) through Toll-like receptor 4 and releases the transmitter ATP. Moreover, analysis of purinergic P2X2 and P2X3 receptor-deficient mice indicated that ATP signaling plays a pivotal role in the LPS-induced activation of L6-S1 spinal neurons through the bladder afferent pathway, resulting in rapid onset of the enhanced micturition reflex. Thus, we revealed a novel defensive mechanism against bacterial infection via an epithelial-neural interaction that induces urinary frequency prior to bacterial clearance by neutrophils of the innate immune system. Our results indicate an important defense role for the bladder urothelium as a chemical-neural transducer, converting bacterial LPS information into neural signaling via an ATP-mediated pathway, with bladder urothelial cells acting as sensory receptor cells.


Conflict of interest statement

The authors declare no competing interests.

Figures

Figure 1
Figure 1
LPS induces urinary frequency more rapidly than inflammatory changes in the bladder and urine. (a) Representative images of the bladder stained with hematoxylin and eosin after intravesical exposure to saline or LPS. Images at 1 h after administration of saline (left) or LPS (middle) and 12 h after LPS administration (right) are shown. Arrows indicate neutrophils. Scale bars, 40 μm. (b) Representative images of Samson stained urine after intravesical exposure to saline or LPS. Images at 1 h after administration of saline (left) or LPS (middle), and 12 h after LPS administration (right) are shown. Arrows indicate neutrophils. Scale bars, 50 μm. (c) Representative cystometrograms of saline and LPS instillation in wild-type mice. Scale bars, 10 min. At least three independent experiments were performed and similar results were obtained.
Figure 2
Figure 2
Specific expression pattern of TLR4 in the bladder urothelium. (a) Representative image of wild-type bladder stained with hematoxylin and eosin. (bd) Immunohistochemical staining of TLR4 with hematoxylin counter-staining in the bladder of wild-type mice (b, c) and TLR4–/– mice (d). Panels in (c) show magnified views of boxed areas in (b). Arrows indicate TLR4 staining. Scale bars, 20 μm. At least three independent experiments were performed and similar results were obtained.
Figure 3
Figure 3
Intravesical LPS instillation induces urinary frequency through TLR4. (a) Representative cystometrograms after LPS instillation with or without TAK-242 treatment in wild-type mice. Scale bar, 10 min. (b) Changes in ICIs after LPS instillation with or without TAK-242 treatment (n = 3 mice per group); *p = 0.023 (paired t-test with Holm correction) and p = 0.003 (two-way repeated measures ANOVA). (c) Representative cystometrograms after TAK-242 treatment in wild-type mice. Scale bar, 10 min. (d) Changes in ICIs after TAK-242 treatment (n = 3 mice); p = 0.26 (paired t-test). Error bars represent s.e.m., n.s., not significant.
Figure 4
Figure 4
LPS acts on TLR4 and induces ATP release from the urothelium. An ATP release assay showing the time course of ATP concentration (ΔATP) in the chamber solution after LPS treatment with or without TAK-242 (n = 4 mice per group); ***p < 0.001 versus vehicle, and p < 0.001 versus LPS (Tukey’s test following one-way ANOVA with Holm correction). Error bars represent s.e.m.
Figure 5
Figure 5
ATP signaling via P2X2 and P2X3 receptors plays an important role in the LPS-induced activation of L6–S1 spinal neurons. (a) Representative cystometrograms after LPS instillation in wild-type, P2X2–/–, and P2X3–/– mice. Scale bar, 10 min. (b) Changes in ICIs after LPS treatment (n = 4 mice per group); *p = 0.018 in P2X3–/– mice and ***p < 0.001 in wild-type mice (paired t-test with Holm correction). p = 0.016 and p < 0.001 in wild-type versus P2X2–/– and P2X3–/– mice, respectively (time by group interaction using two-way repeated measures ANOVA with Holm correction). (c) Immunohistochemical analysis of c-Fos expression in L6–S1 spinal cord after saline or LPS instillation in wild-type, P2X2–/–, and P2X3–/– mice. Scale bars, 100 μm. (d) LPS-induced increases in c-Fos-positive cell numbers in L6–S1 spinal cord of wild-type, P2X2–/–, and P2X3–/– mice (n = 5 mice per group: 10 sections per mouse were assessed); ***p < 0.001 (Student’s t-test with Holm correction); p = 0.0025 in wild-type versus P2X2–/– mice and p = 0.0046 in wild-type versus P2X3–/– mice (LPS by group interaction using two-way repeated measures ANOVA with Holm correction). (e) The distribution of c-Fos-positive cells in the L6–S1 spinal cord induced by LPS instillation in wild-type, P2X2–/–, and P2X3–/– mice (n = 5 mice per group: 10 sections per mouse were assessed); **p = 0.0089 in wild-type versus P2X3–/– mice in SPN, and ***p < 0.001 in wild-type versus P2X2–/– and P2X3–/– mice in DCM (Tukey’s test following one-way ANOVA). Error bars represent s.e.m.
Figure 6
Figure 6
Intravesical ATP treatment triggers activation of L6–S1 spinal neurons and induces an enhanced micturition reflex. (a) Representative cystometrograms after ATP instillation in wild-type mice. Scale bar, 10 min. (b) Changes in ICIs after ATP treatment (n = 5 mice per group); *p = 0.041 for 20 mM ATP, *p = 0.010 for 50 mM ATP, and **p = 0.0018 for 100 mM ATP (paired t-test with Holm correction). (c) Ultrasonographic findings of pre-voiding with intravesical ATP treatment. Scale bars, 5 mm. (d, e) Changes in largest CSA (d) and smallest CSA, post-voiding (e) (n = 5 mice per group); *p = 0.041 in saline versus 5 mM ATP, and ***p < 0.001 in saline versus 20 mM ATP and 50 mM ATP (Tukey’s test following one-way ANOVA). (f) Immunohistochemical analysis of c-Fos expression in L6–S1 spinal cord after ATP instillation. Scale bars, 100 μm. (g) The distribution of c-Fos-positive cells in the L6–S1 spinal cord induced by ATP instillation (50 mM) in wild-type mice (n = 5 mice per group); ***p < 0.001 in SPN and DCM (Student’s t-test with Holm correction). (h) The number of c-Fos-positive cells in L6–S1 spinal cord after ATP instillation (n = 5 mice per group: 10 sections per mouse were assessed). ***p < 0.001 in saline versus all ATP concentrations (Tukey’s test following one-way ANOVA). Error bars represent s.e.m., n.s., not significant.
Figure 7
Figure 7
Effects of intravesical ATP treatment are blocked in P2X2–/– and P2X3–/– mice. (a) Representative cystometrograms after 10 mM ATP instillation in wild-type, P2X2–/–, and P2X3–/– mice. Scale bar, 10 min. (b) Changes in ICIs after ATP treatment (wild-type, P2X2–/–, n = 4 mice; P2X3–/–, n = 3 mice); **p = 0.0066 in wild-type mice (paired t-test with Holm correction) and p = 0.012 and 0.018 in wild-type versus P2X2–/– and P2X3–/– mice, respectively (time by group interaction using two-way repeated measures ANOVA with Holm correction). (c) Immunohistochemical analysis of c-Fos expression in L6–S1 spinal cord after ATP instillation in wild-type, P2X2–/–, and P2X3–/– mice. Scale bars, 100 μm. (d) The number of c-Fos-positive cells in L6–S1 spinal cord after ATP instillation in wild-type, P2X2–/–, and P2X3–/– mice (wild-type, P2X2–/–, n = 4 mice; P2X3–/–, n = 3 mice: 10 sections per mouse were assessed); **p = 0.0046 and 0.0023 in wild-type versus P2X2–/– and P2X3–/– mice, respectively (Tukey’s test following one-way ANOVA). Error bars represent s.e.m.
Figure 8
Figure 8
Effects of intravesical ATP treatment are blocked by PPADS, a non-selective purinergic receptor antagonist. (a) Representative cystometrograms after ATP instillation (20 mM) with or without PPADS treatment in wild-type mice. Scale bar, 10 min. (b) Changes in ICIs after ATP instillation with or without PPADS treatment (PPADS: n = 3 mice, Saline: n = 5 mice); **p = 0.0071 (paired t-test with Holm correction) and p = 0.026 (time by group interaction using two-way repeated measures ANOVA). (c) Immunohistochemical analysis of c-Fos expression in L6–S1 spinal cord after ATP instillation with or without PPADS treatment in wild-type mice. Scale bars, 100 μm. (d) The number of c-Fos-positive cells in L6–S1 spinal cord after ATP instillation with or without PPADS treatment (n = 3 mice per group: 10 sections per mouse were assessed); *p = 0.012 (Student’s t-test). (e) Representative cystometrograms after PPADS treatment in wild-type mice. Scale bar, 10 min. (f) Changes in ICIs after PPADS treatment (n = 4 mice, per group); p = 0.20 in saline and p = 0.38 in PPADS (paired t-test with Holm correction). (g) Immunohistochemical analysis of c-Fos expression in L6–S1 spinal cord after intravesical PPADS treatment in wild-type mice. Scale bars, 100 μm. (h) The number of c-Fos-positive cells in L6–S1 spinal cord after intravesical PPADS treatment (n = 4 mice per group: 10 sections per mouse were assessed); p = 0.81 (Student’s t-test). Error bars represent s.e.m., n.s., not significant.

References

    1. Yamamoto S, et al. Genetic evidence supporting the fecal-perineal-urethral hypothesis in cystitis caused by Escherichia coli. J. Urol. 1997;157:1127–1129. doi: 10.1016/S0022-5347(01)65154-1. - DOI - PubMed
    1. McLellan LK, Hunstad DA. Urinary tract infection: pathogenesis and outlook. Trends Mol. Med. 2016;22:946–957. doi: 10.1016/j.molmed.2016.09.003. - DOI - PMC - PubMed
    1. Ingersoll MA, Albert ML. From infection to immunotherapy: host immune responses to bacteria at the bladder mucosa. Mucosal Immunol. 2013;6:1041–1053. doi: 10.1038/mi.2013.72. - DOI - PubMed
    1. Foxman B. Urinary tract infection syndromes: occurrence, recurrence, bacteriology, risk factors, and disease burden. Infect. Dis. Clin. North Am. 2014;28:1–13. doi: 10.1016/j.idc.2013.09.003. - DOI - PubMed
    1. Apodaca G, Balestreire E, Birder LA. The uroepithelial-associated sensory web. Kidney Int. 2007;72:1057–1064. doi: 10.1038/sj.ki.5002439. - DOI - PubMed

Publication types

MeSH terms

Substances