

Two GWAS-identified variants are associated with lumbar spinal stenosis and Gasdermin-C expression in Chinese population
- PMID: 33273635
- PMCID: PMC7713291
- DOI: 10.1038/s41598-020-78249-7
Two GWAS-identified variants are associated with lumbar spinal stenosis and Gasdermin-C expression in Chinese population
Abstract
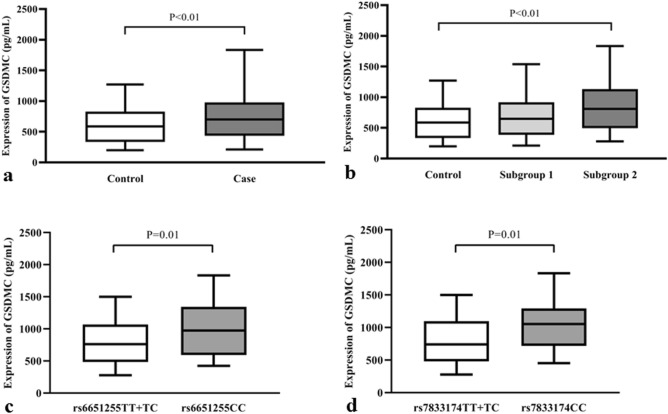
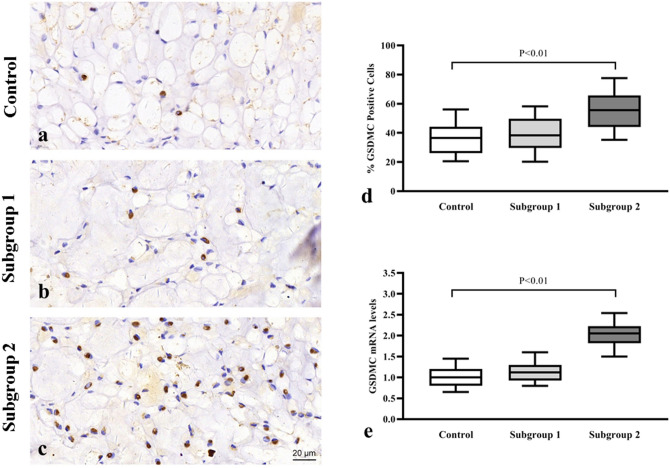
The aim of this study is to investigate the expression levels of genome-wide association studies (GWAS)-identified variants near Gasdermin-C (GSDMC) and its association with lumbar disc degeneration (LDD) in a Chinese population. In accordance with previously reported findings, our study involved the top 4 variants; rs6651255, rs7833174, rs4130415, and rs7816342. A total of 800 participants, 400 LDD patients and 400 controls were involved in the study. The LDD patients were divided into two mutually exclusive subgroups: subgroup 1: lumbar disc herniation; subgroup 2: lumbar spinal stenosis. Genotyping were performed using TaqMan assay, and Enzyme-Linked Immunosorbent Assay (ELISA) used to measure the plasma GSDMC levels, while quantitative reverse-transcription (qRT)-PCR and immunohistochemistry (IHC) were used to evaluate the GSDMC expression levels. Among the studied variants, there were no statistically significant differences in allelic and genotypic frequencies between LDD patients and their controls (all P > 0.05). However, the subgroup analysis revealed a significant association between rs6651255 and rs7833174 in patients with lumbar spinal stenosis (subgroup 2). Furthermore, the max-statistic test revealed that the inheritance models of two variants of lumbar spinal stenosis were represented by the recessive model. The plasma and mRNA expression levels of GSDMC were significantly higher in patients with lumbar spinal stenosis compared with the control group (P < 0.05). Furthermore, the CC genotypes of rs6651255 and rs7833174 were significantly associated with increased plasma expression levels of GSDMC in patients with lumbar spinal stenosis (P < 0.01). Two GWAS-identified variants (rs6651255 and rs7833174) near GSDMC were associated with a predisposition to lumbar spinal stenosis. GSDMC protein and mRNA expression levels may have prognostic qualities as biomarkers for the existence, occurrence or development of lumbar spinal stenosis.
Conflict of interest statement
The authors declare no competing interests.
Figures
References
Publication types
MeSH terms
Substances
Supplementary concepts
LinkOut - more resources
Full Text Sources
Medical
Molecular Biology Databases
