. 2020 Dec;38(12):1421-1430.
doi: 10.1038/s41587-020-00763-w. Epub 2020 Dec 3.

Generation of human striatal organoids and cortico-striatal assembloids from human pluripotent stem cells

Affiliations

Generation of human striatal organoids and cortico-striatal assembloids from human pluripotent stem cells

Yuki Miura et al. Nat Biotechnol. 2020 Dec.

Abstract

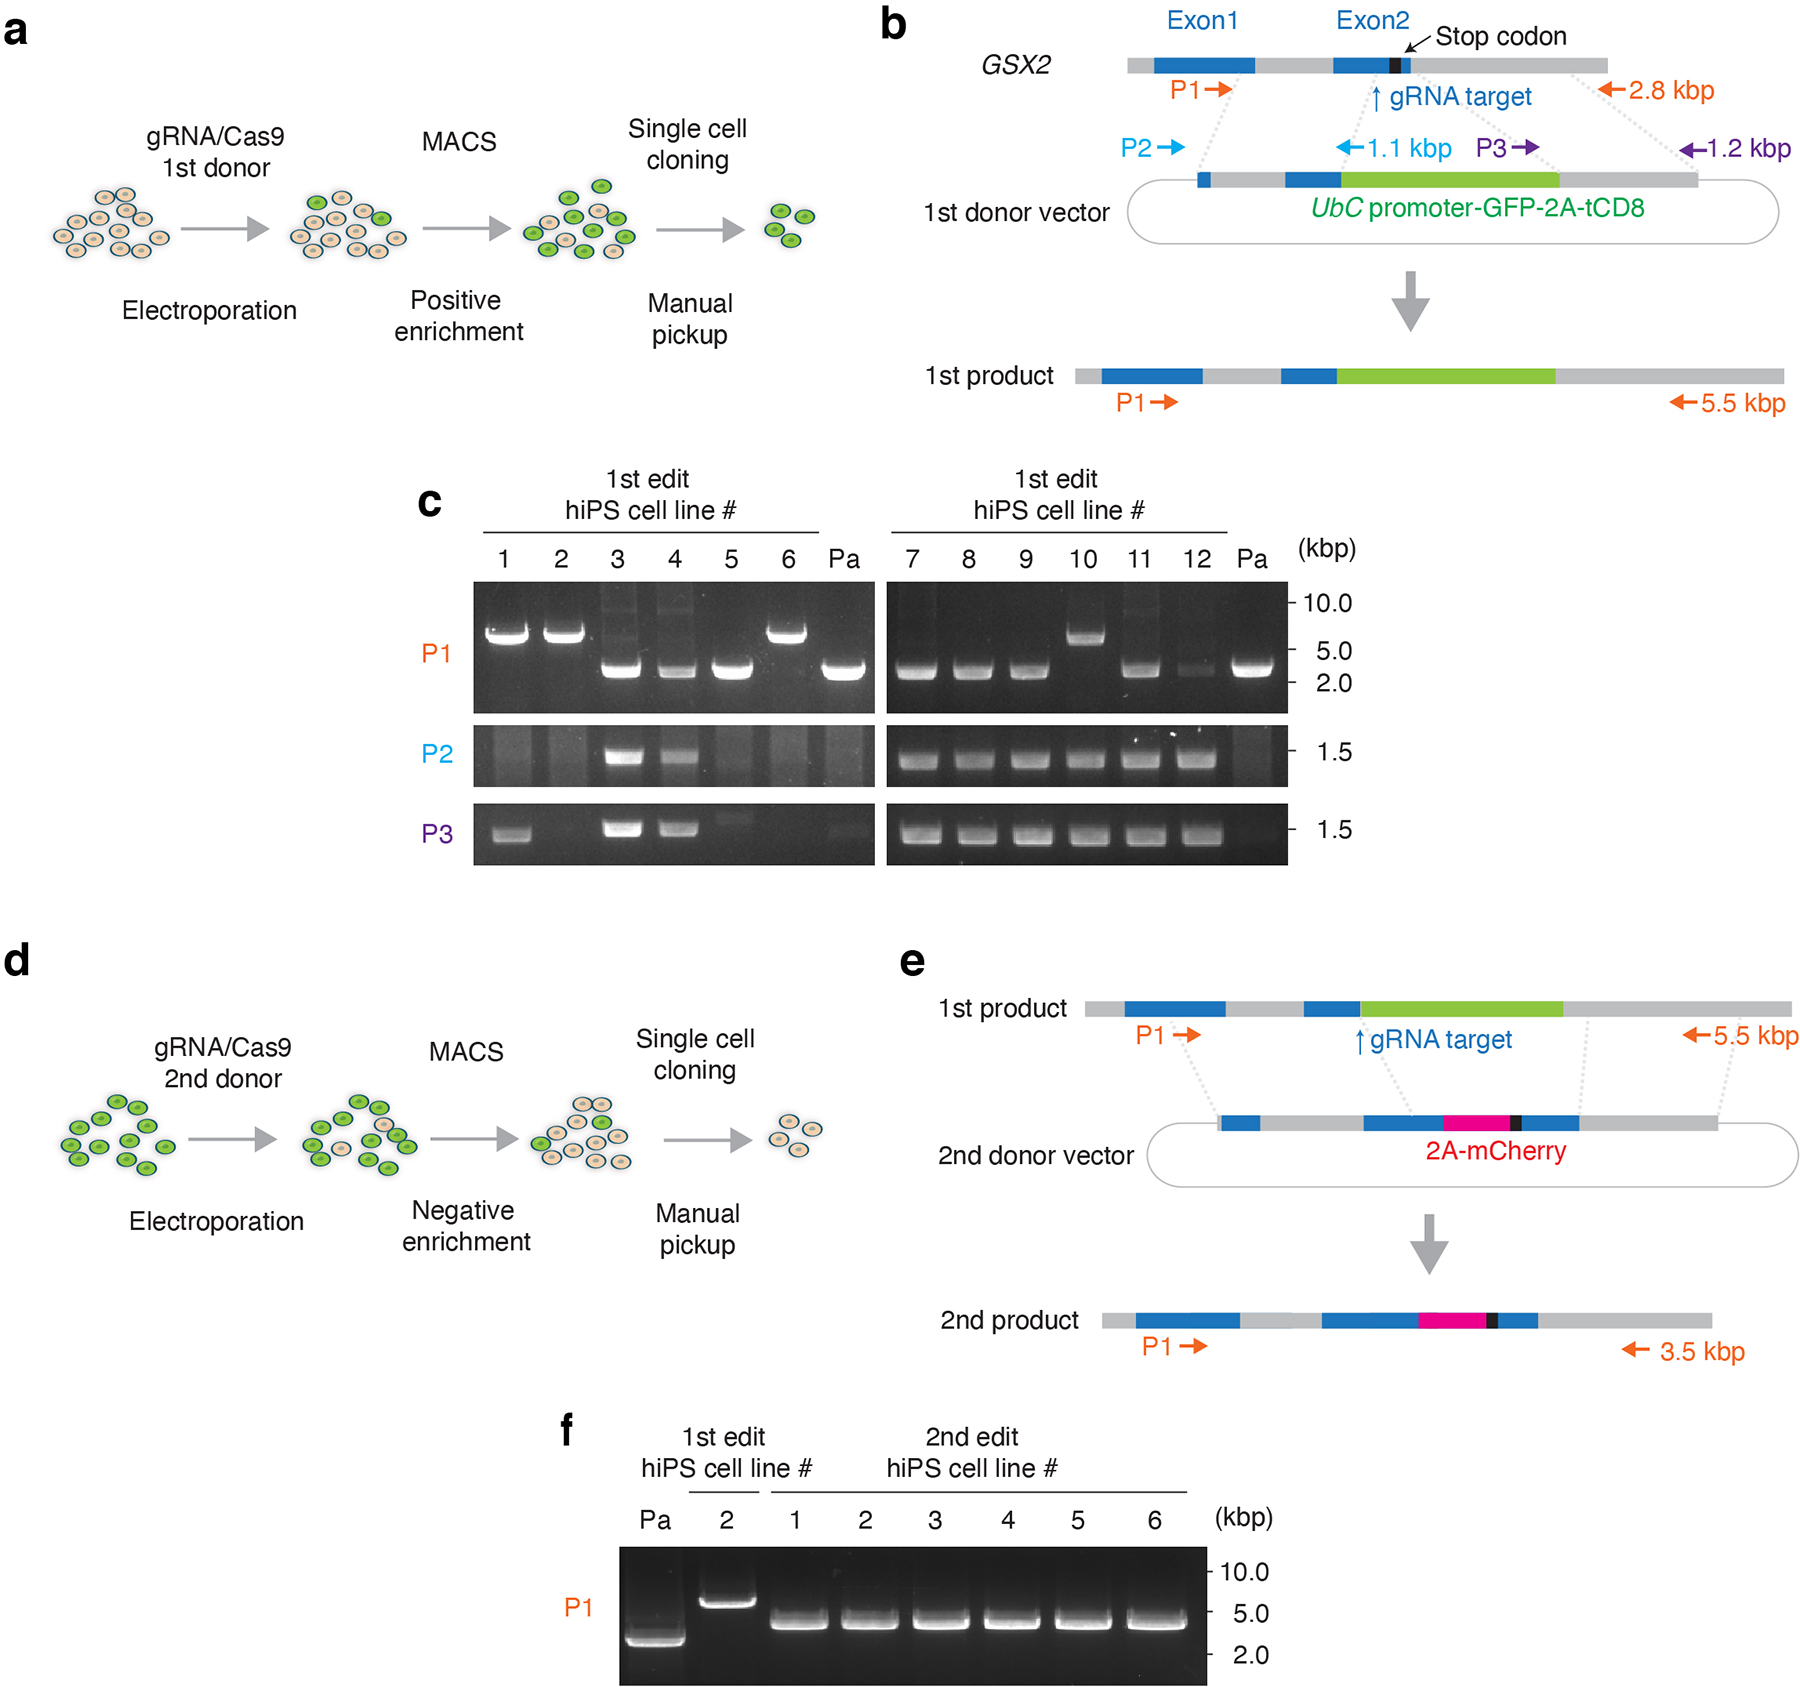
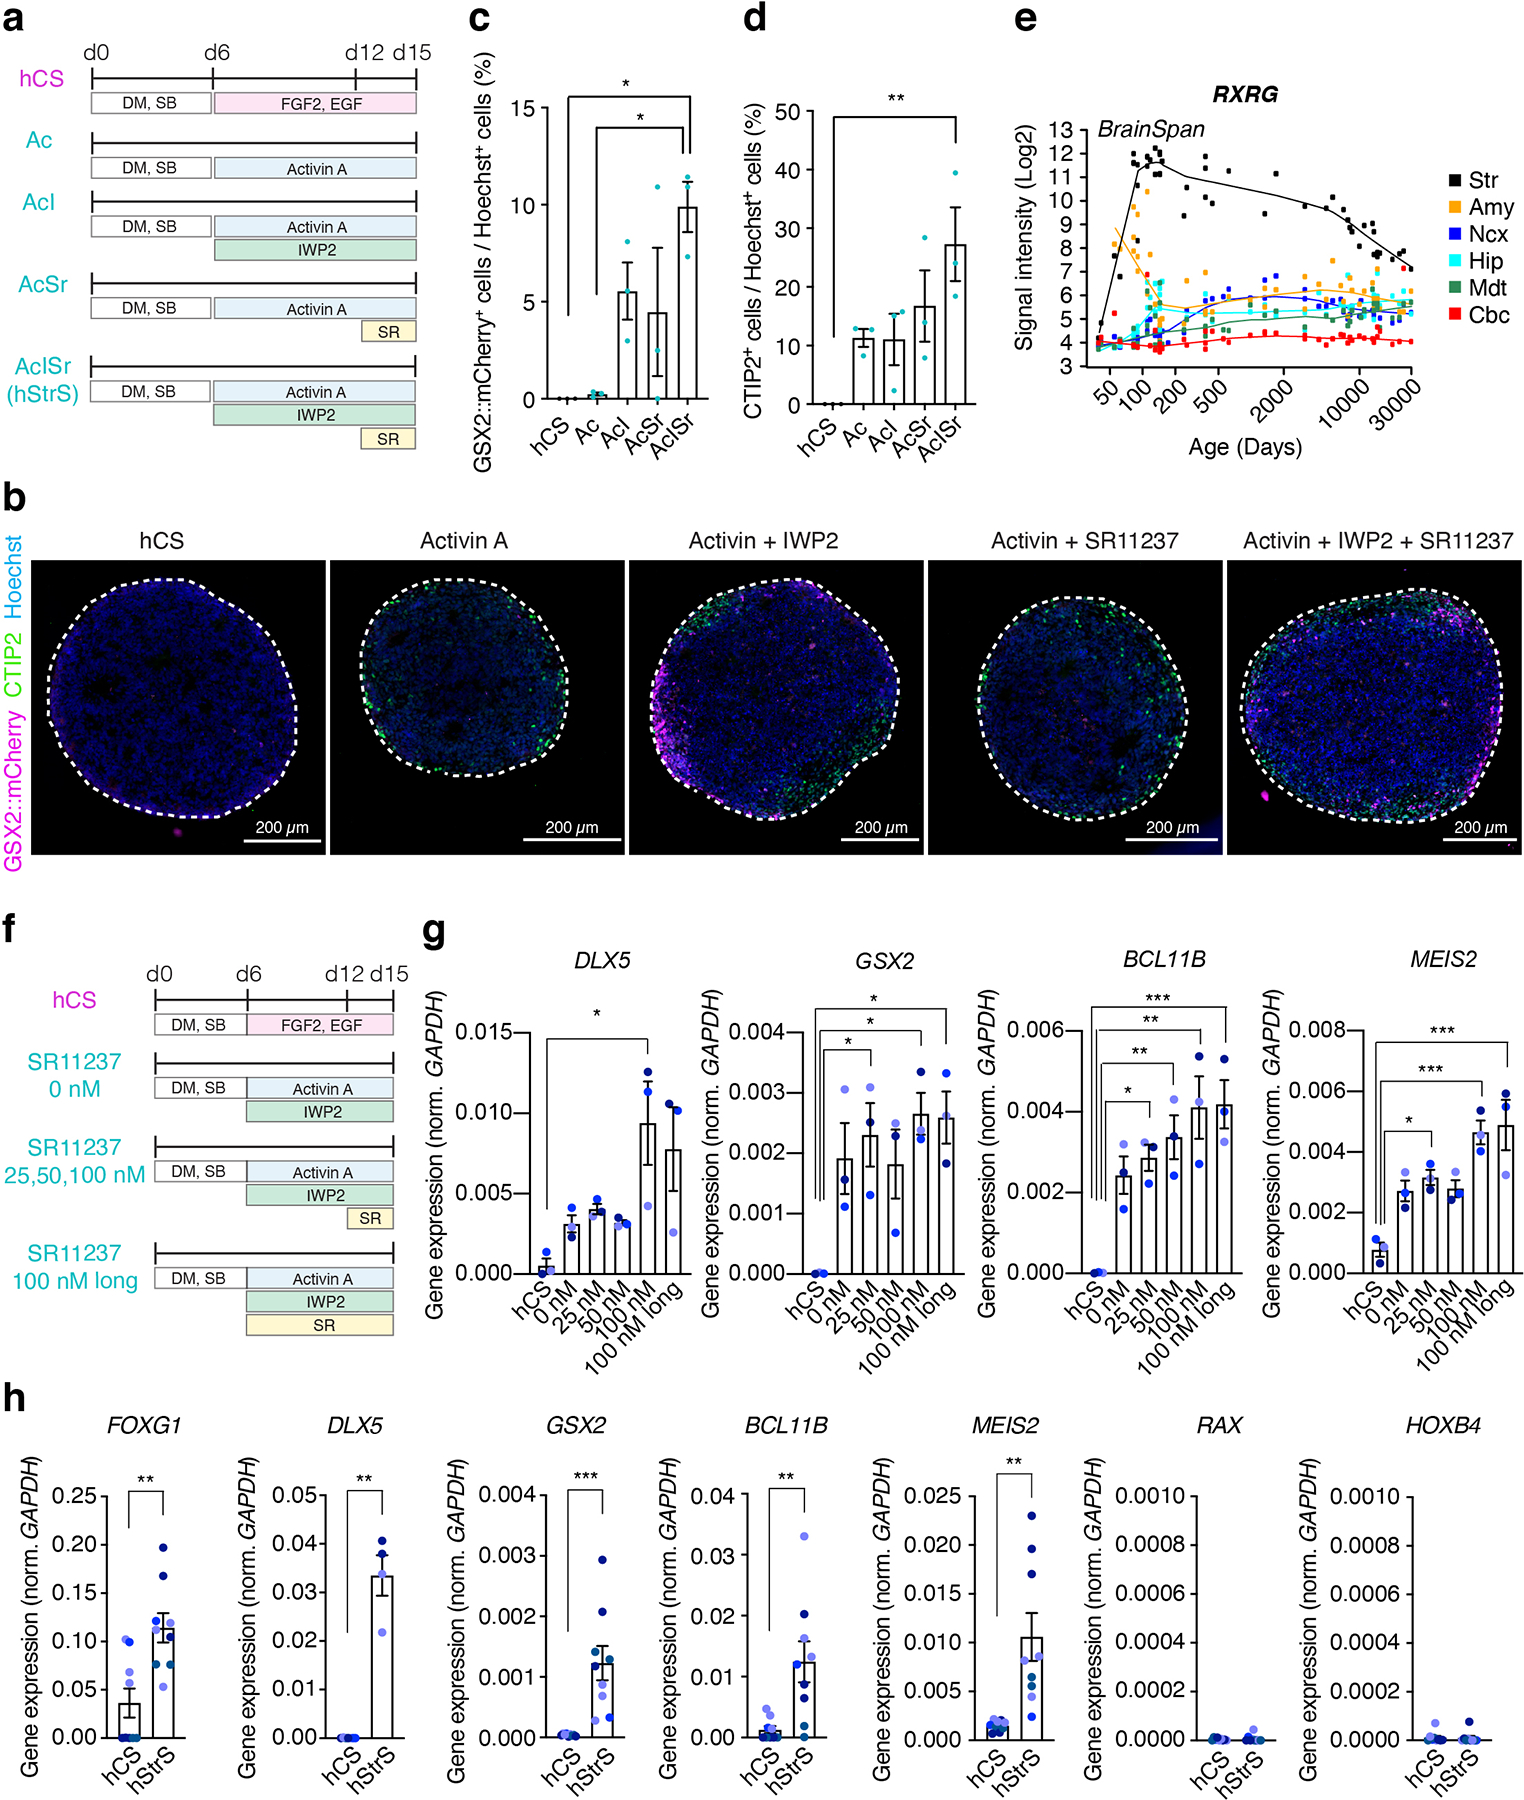
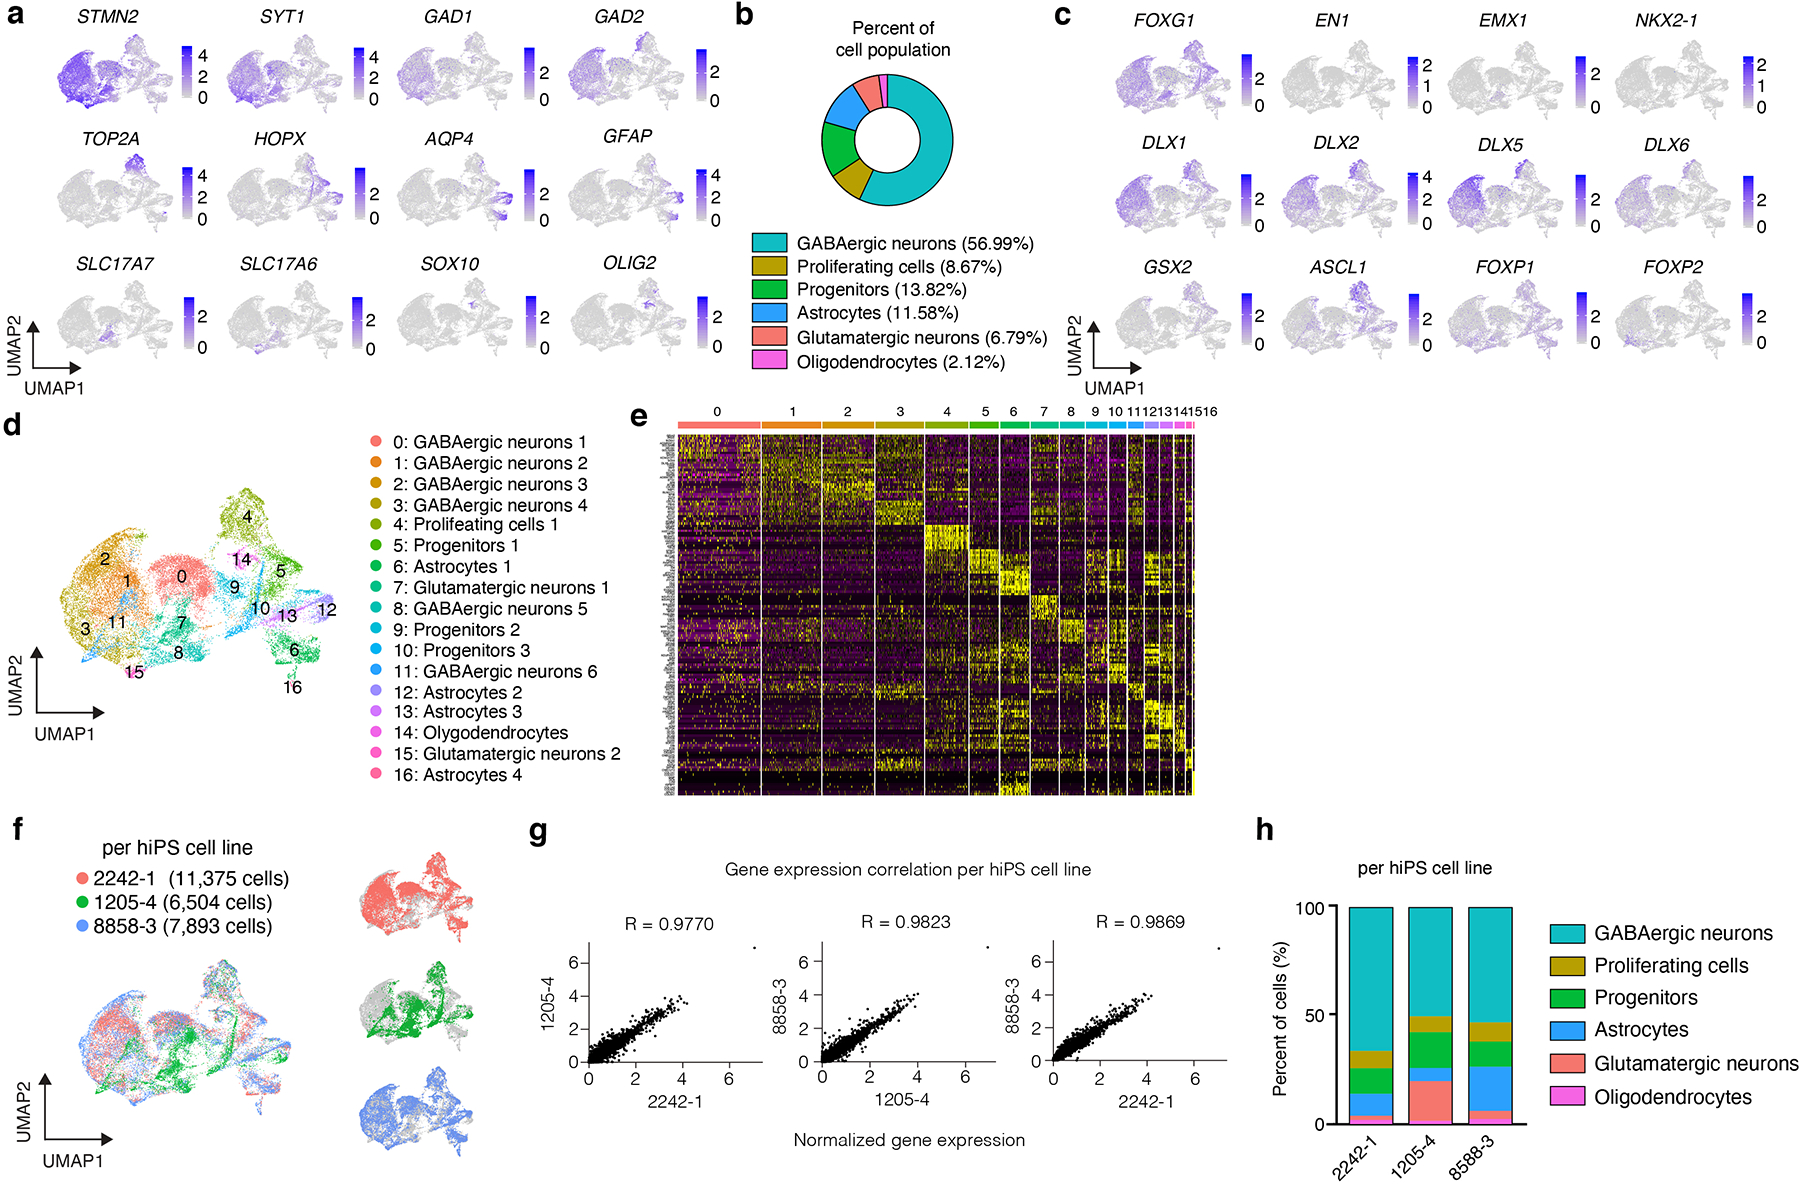
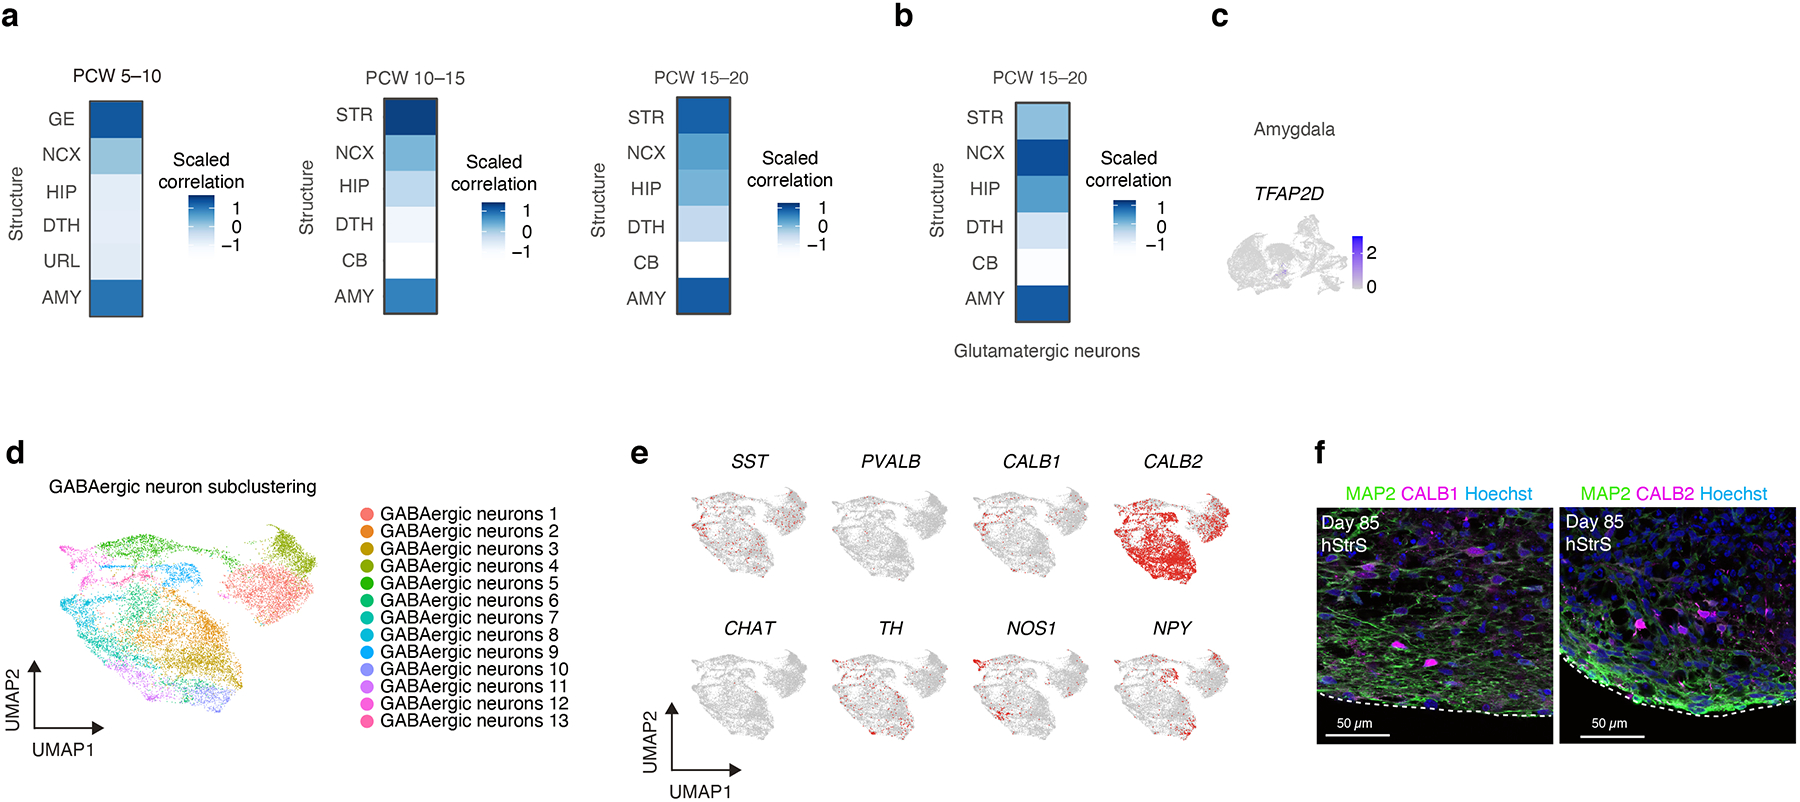
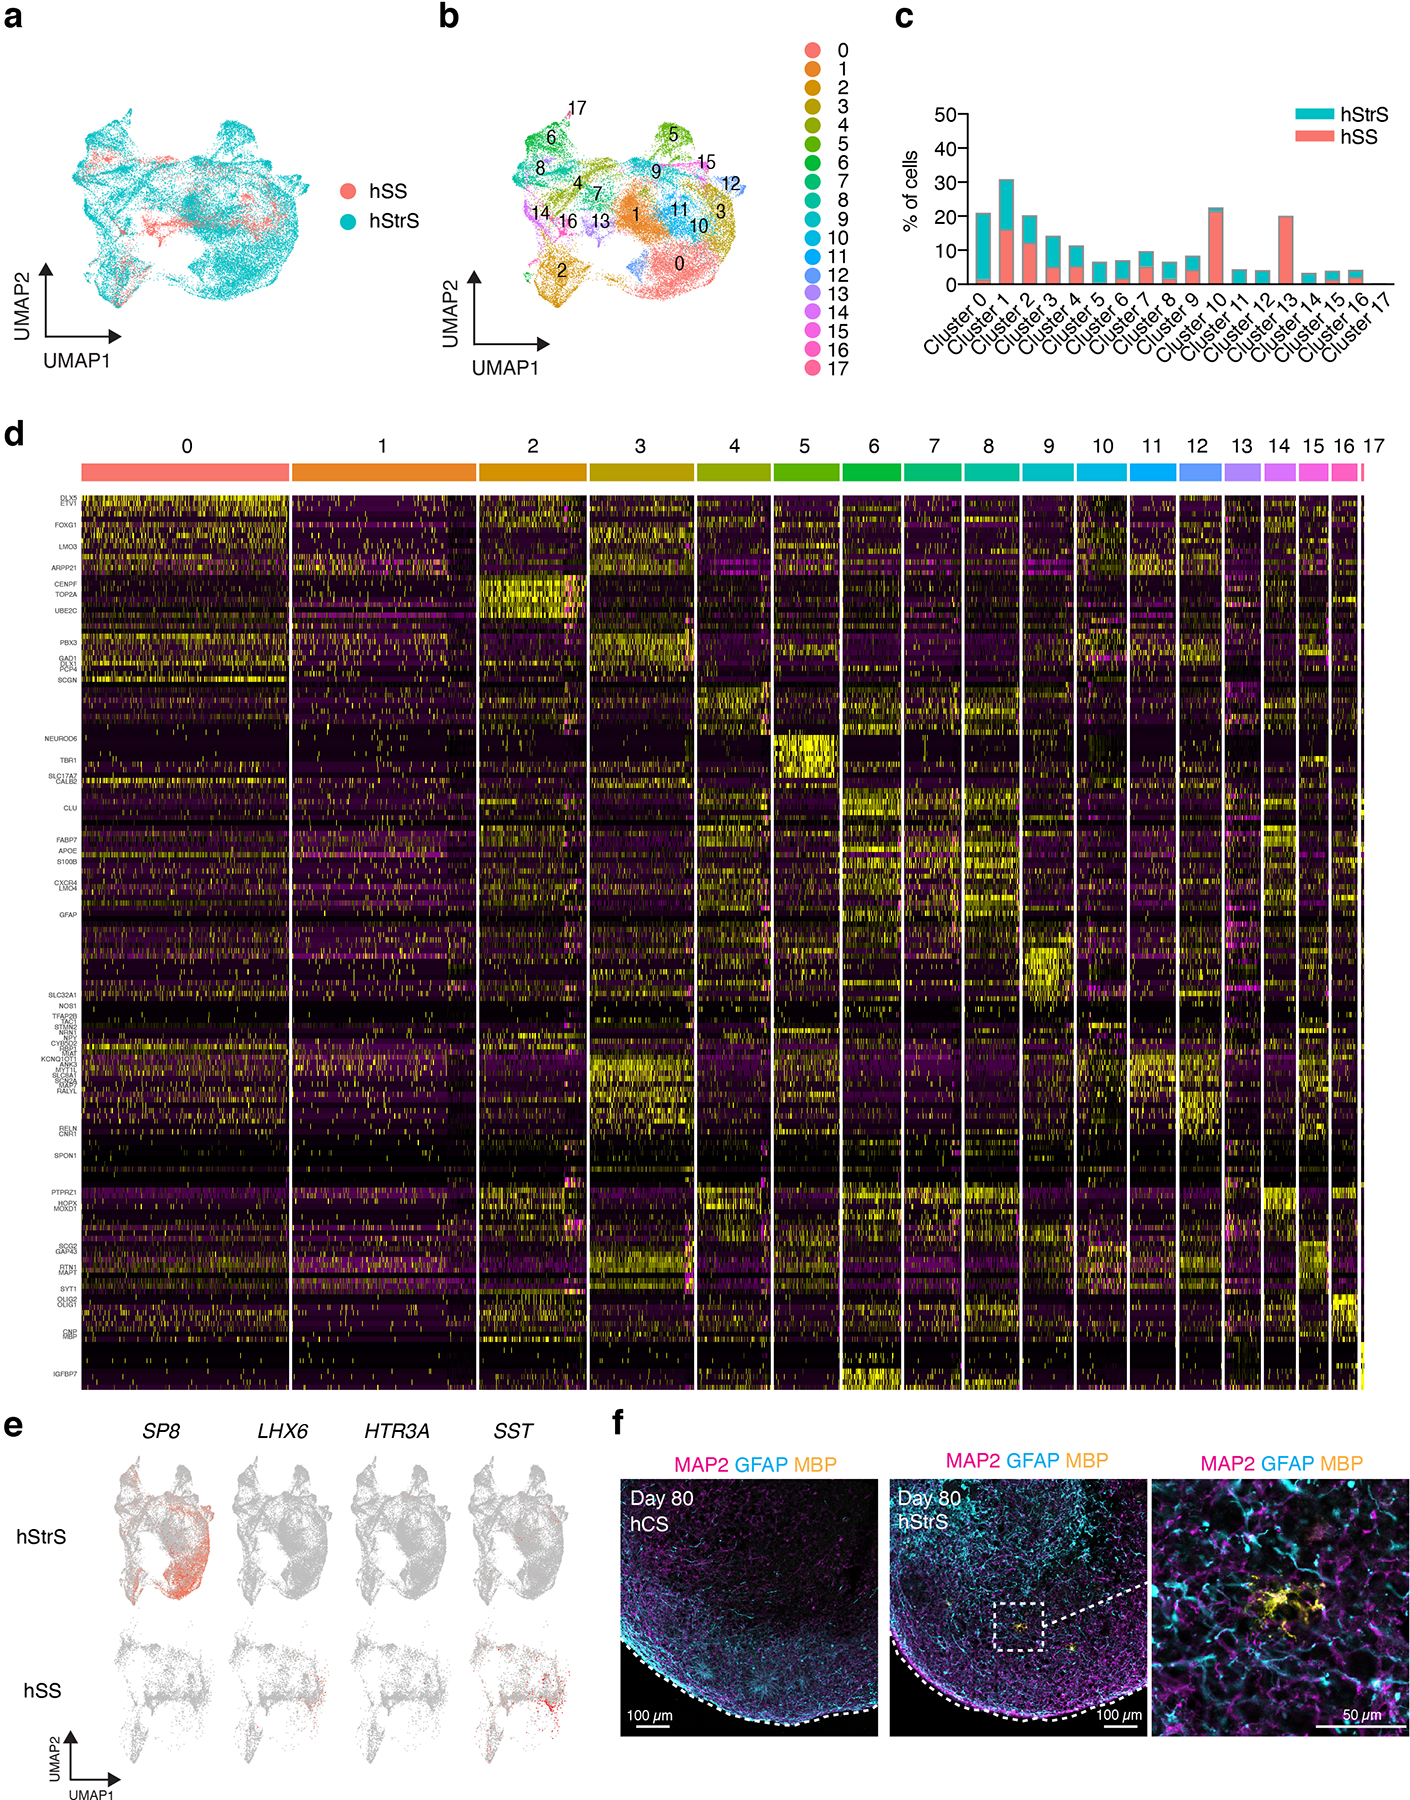
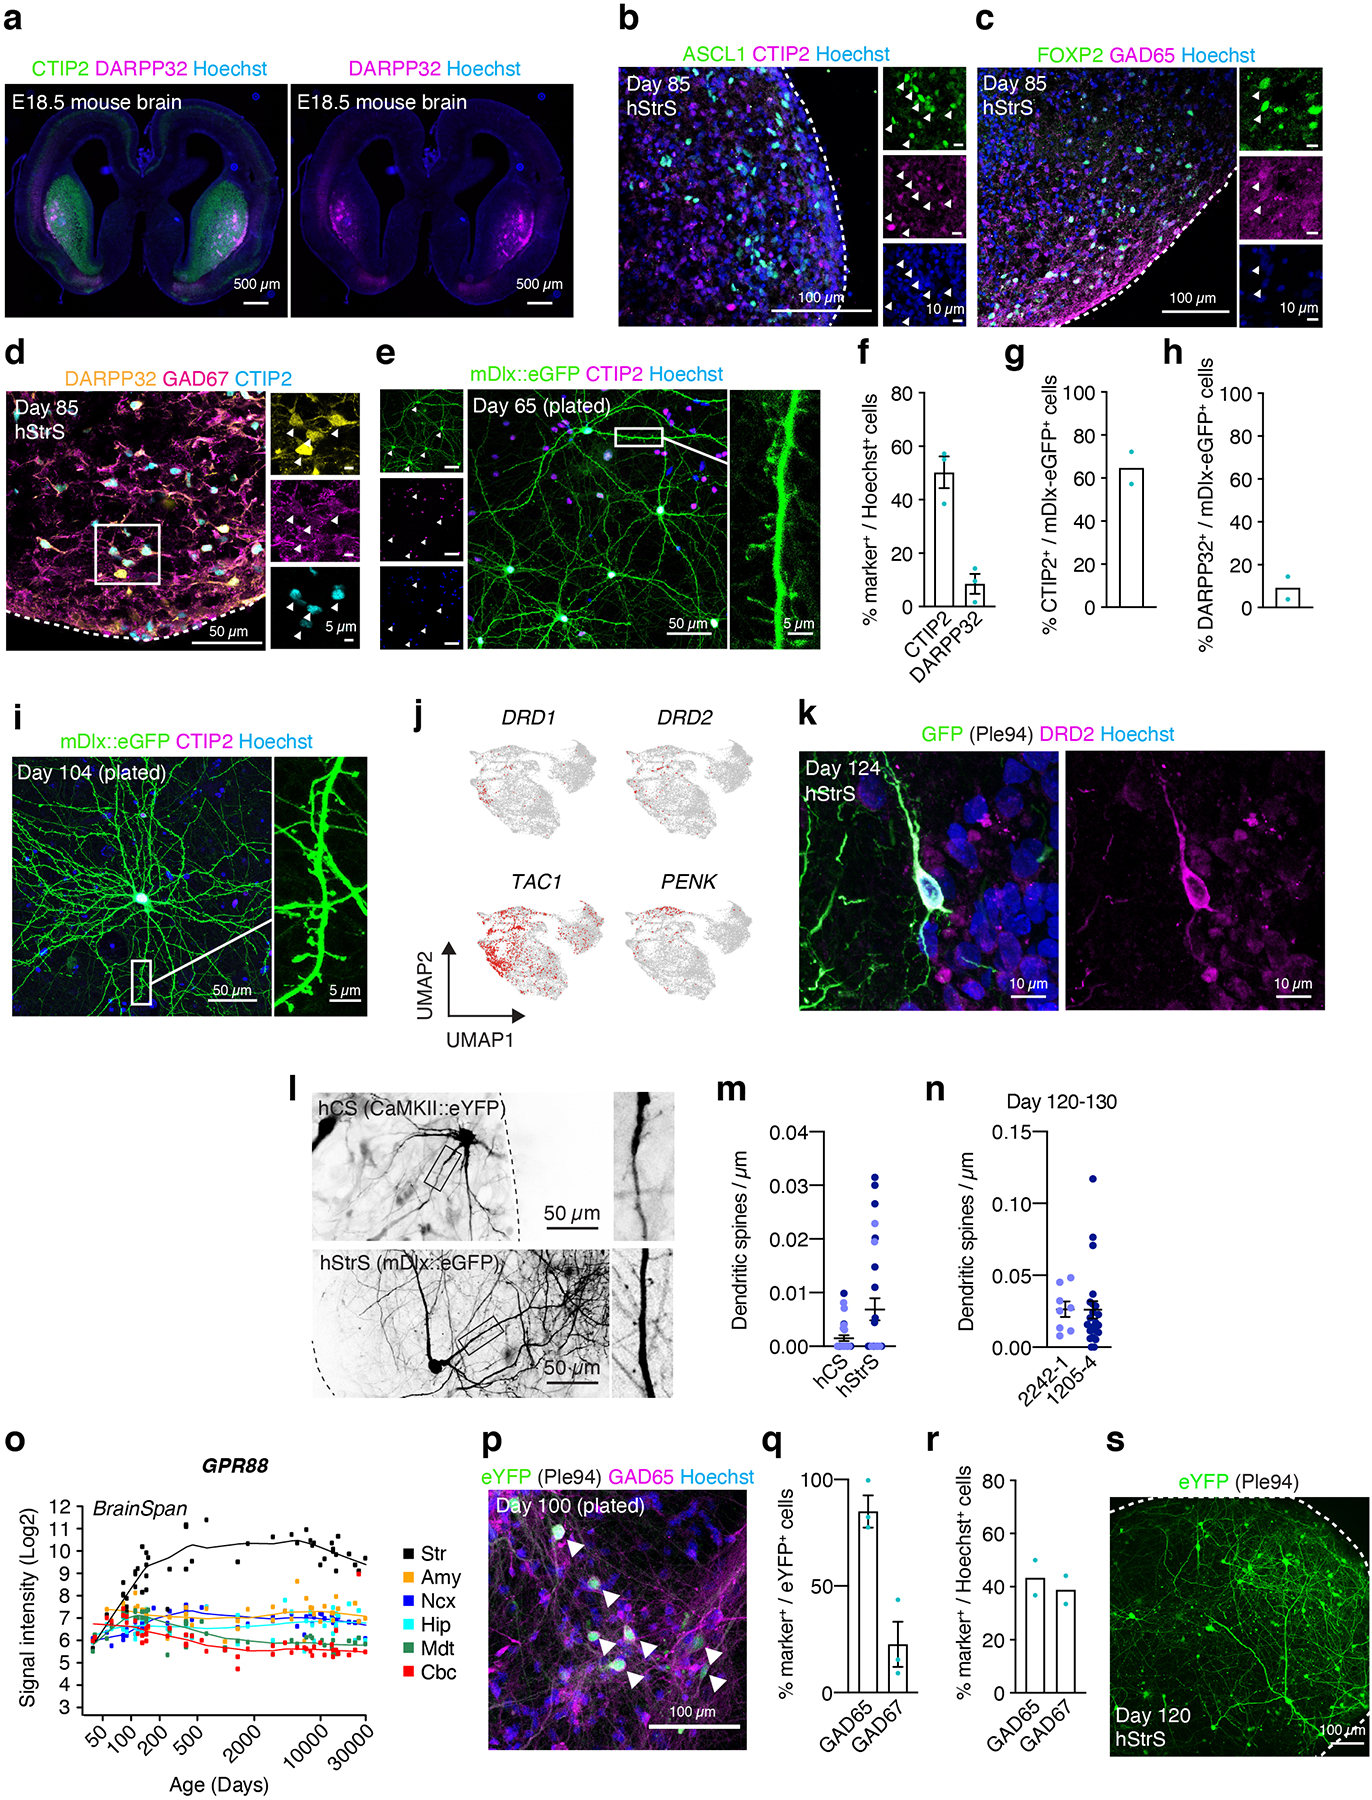
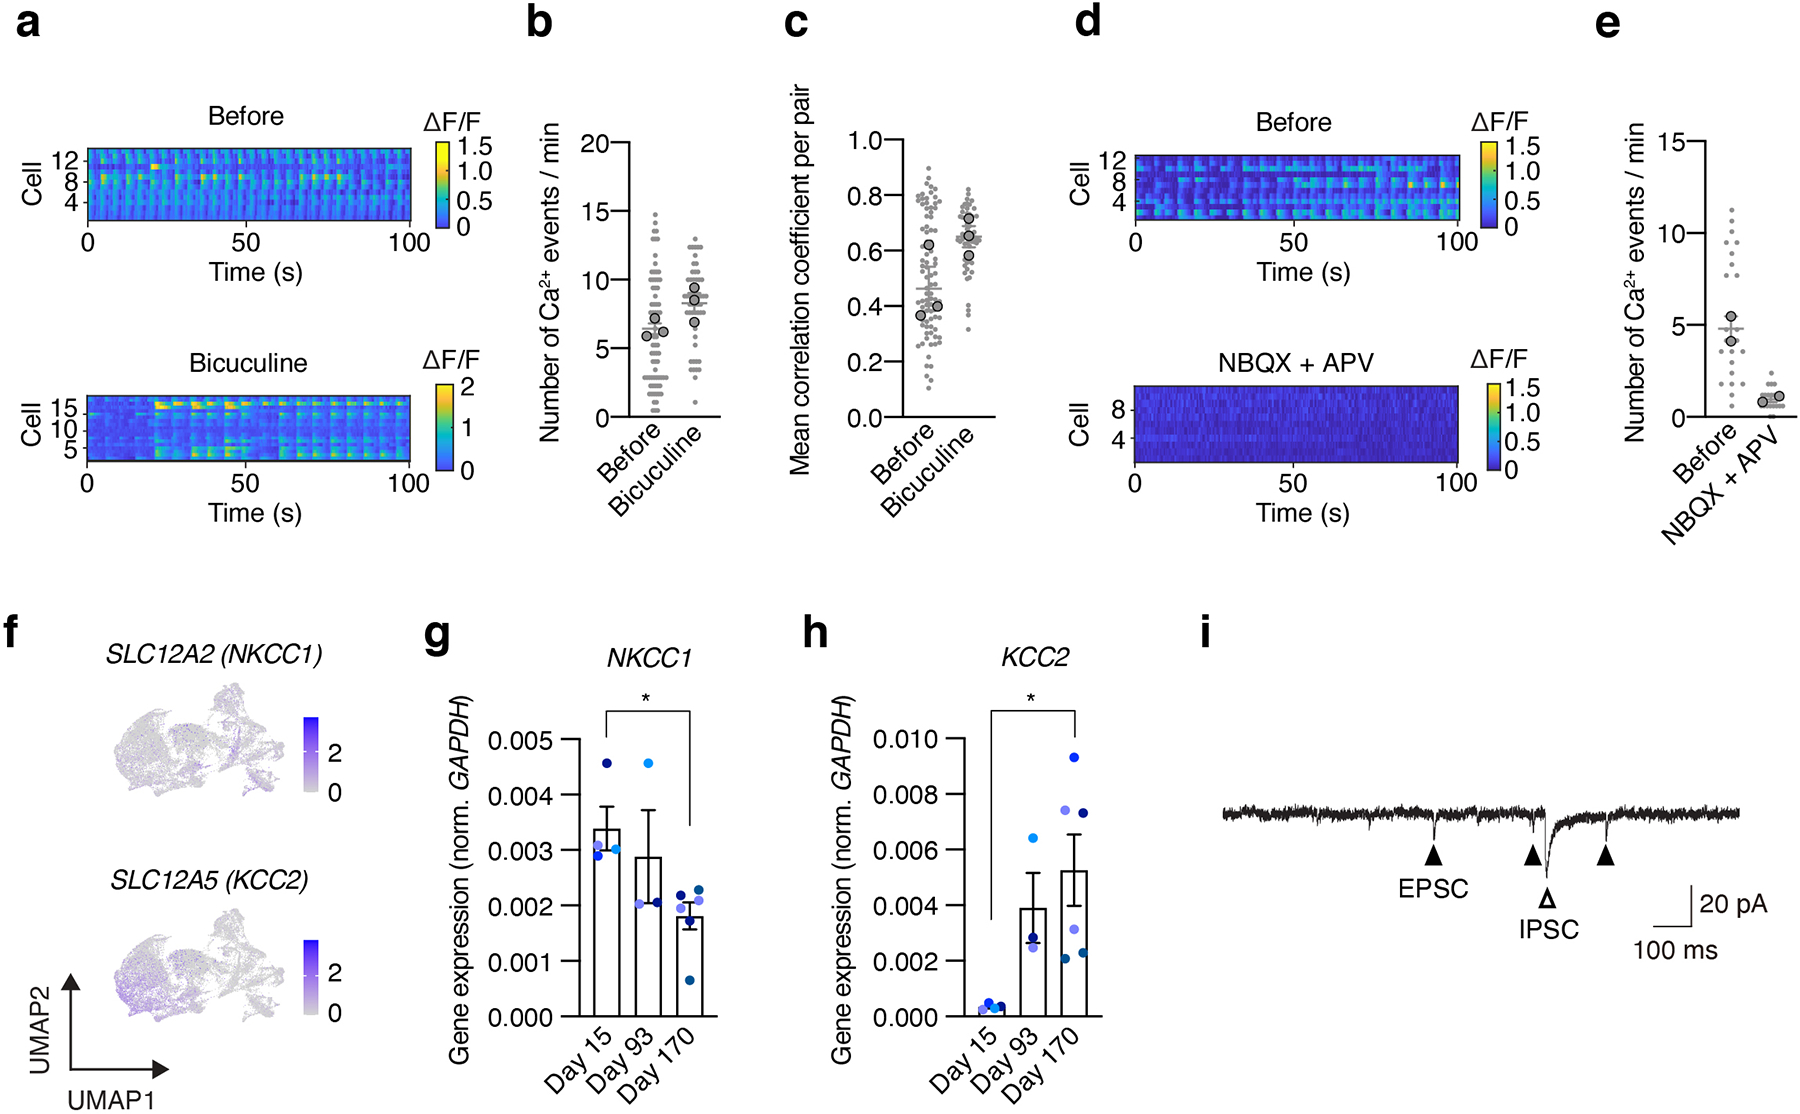
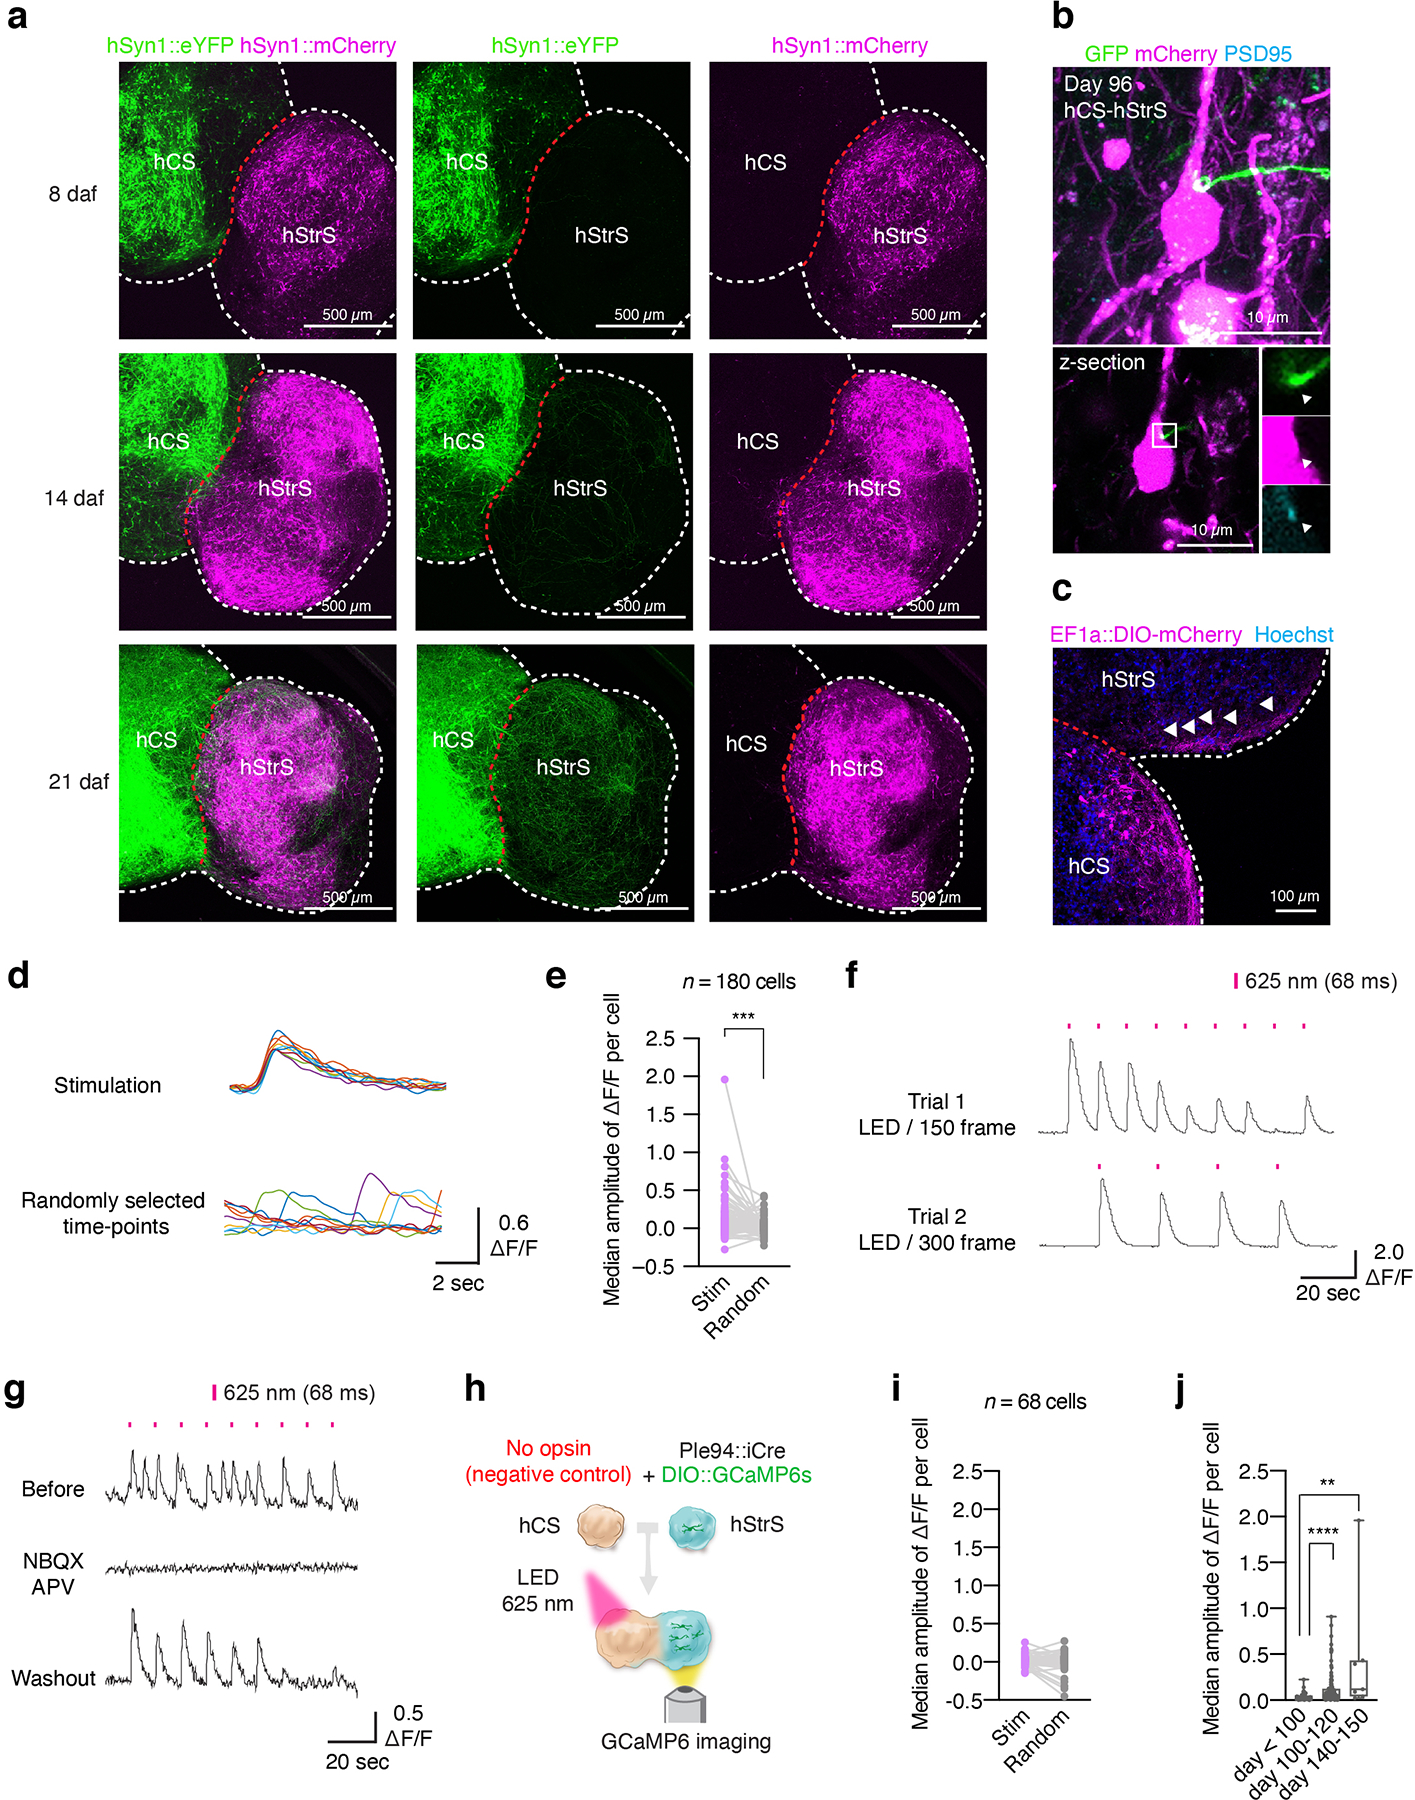
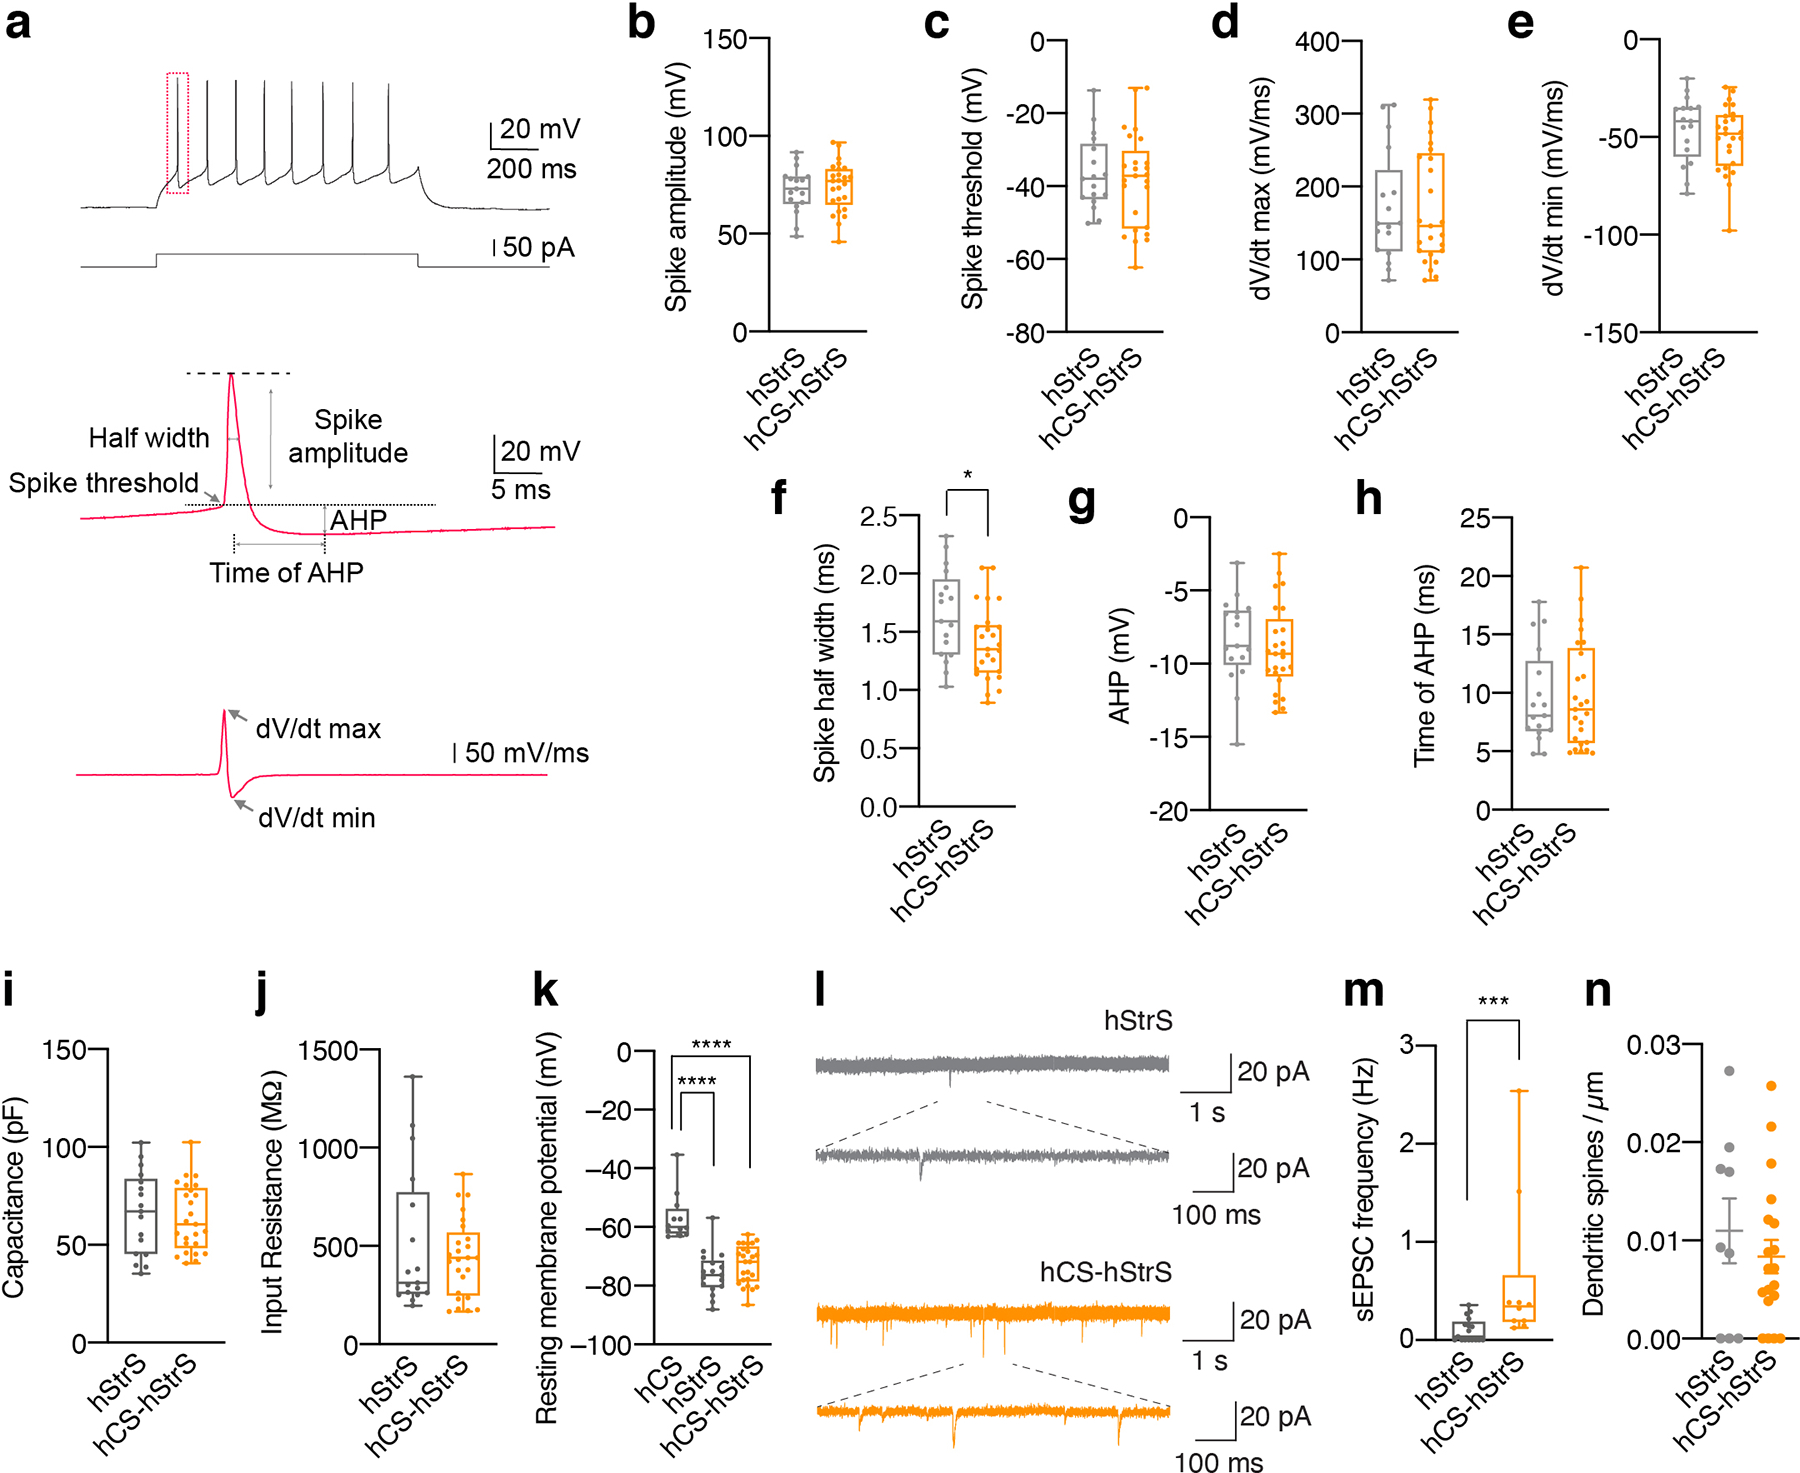
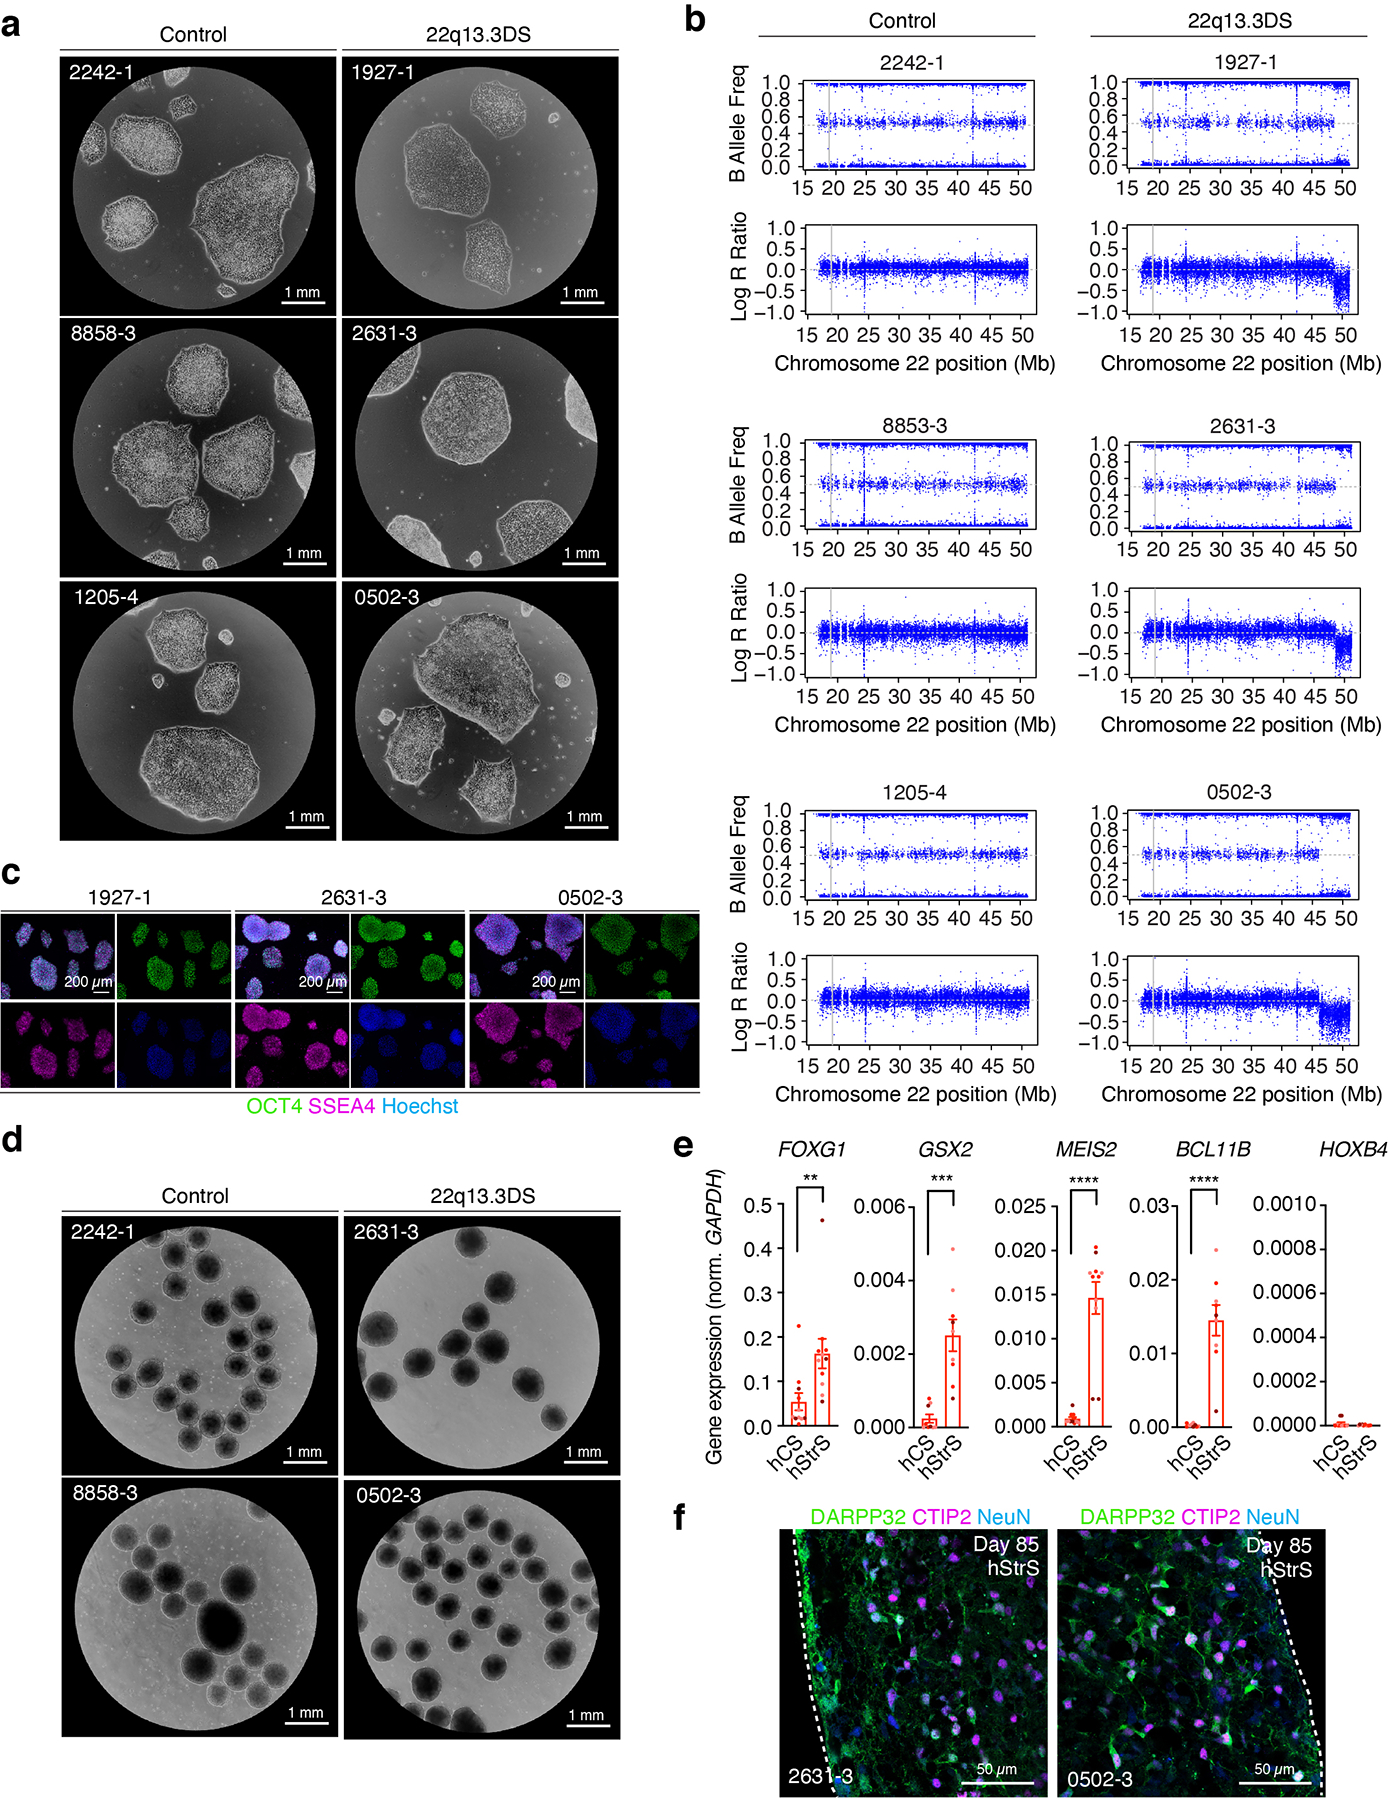
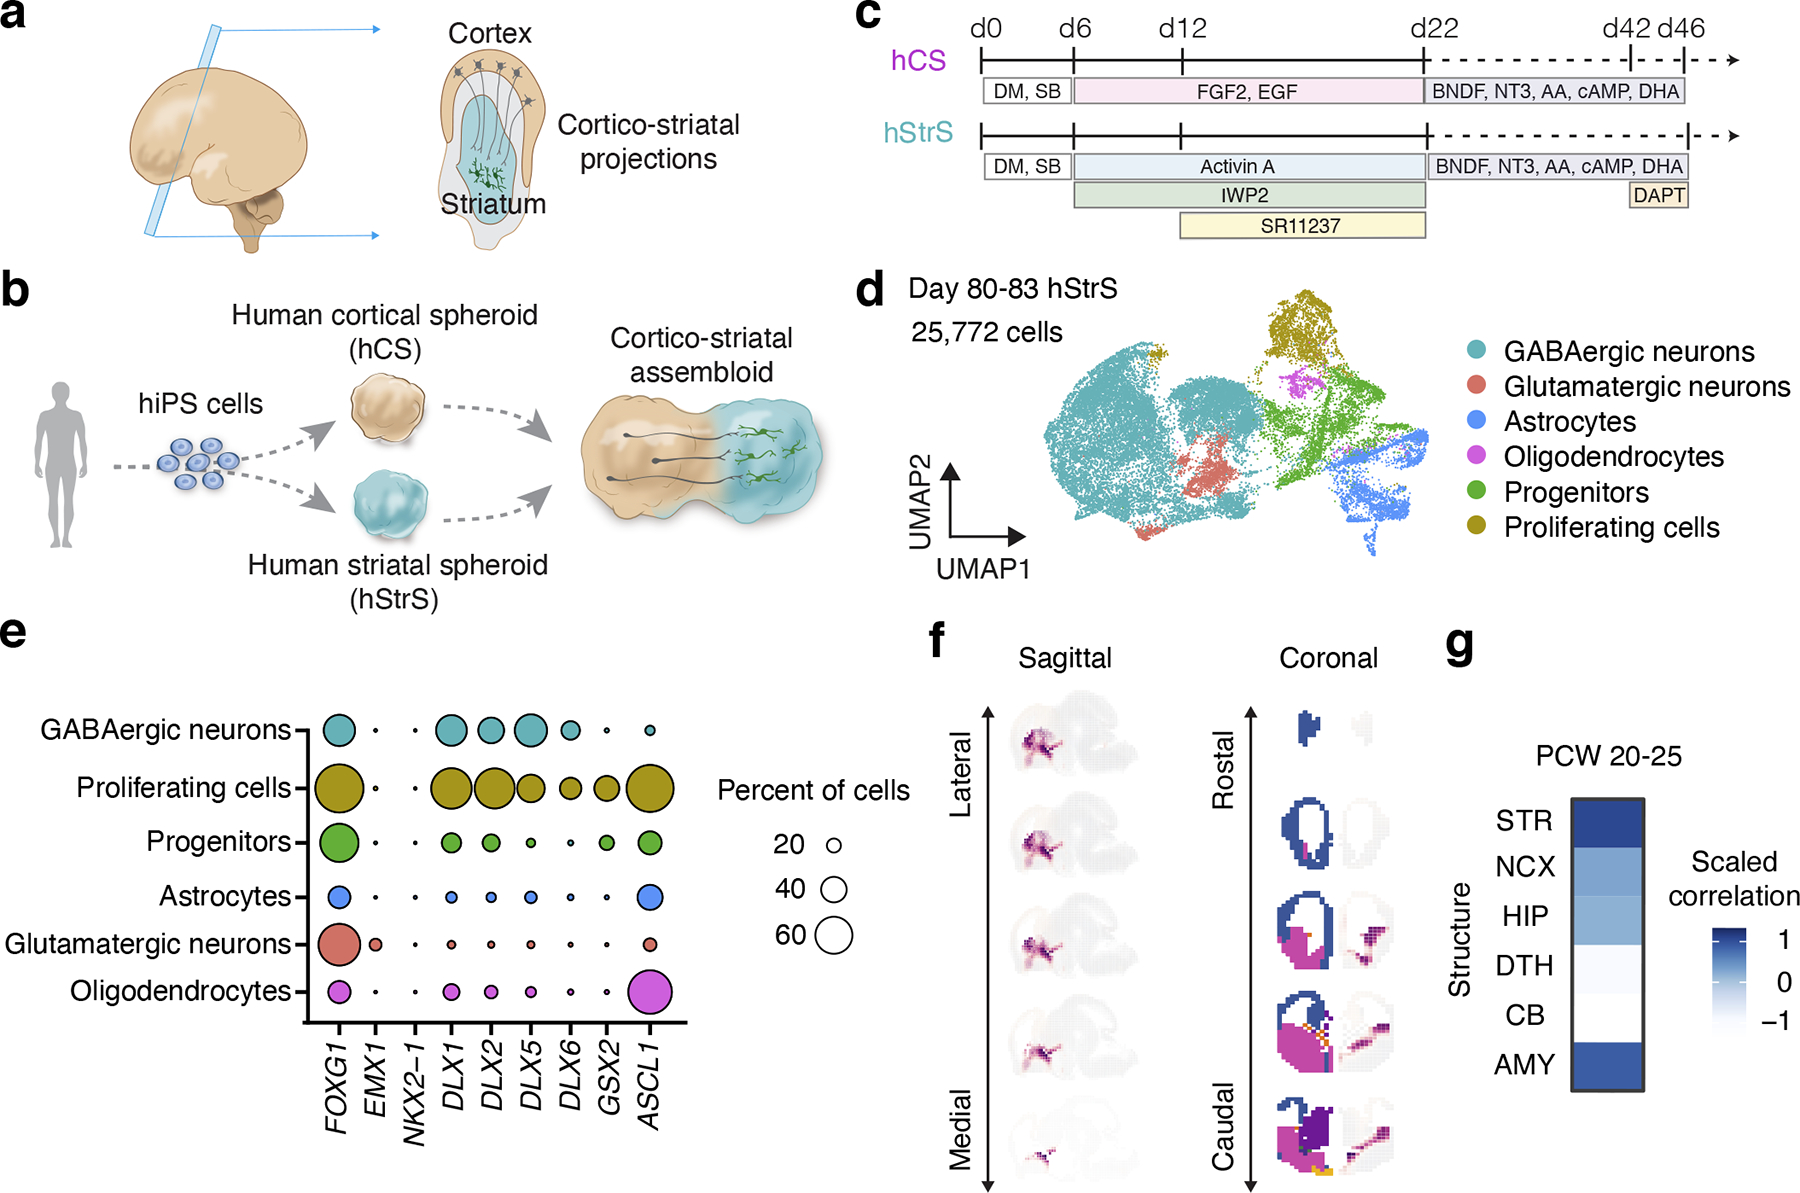
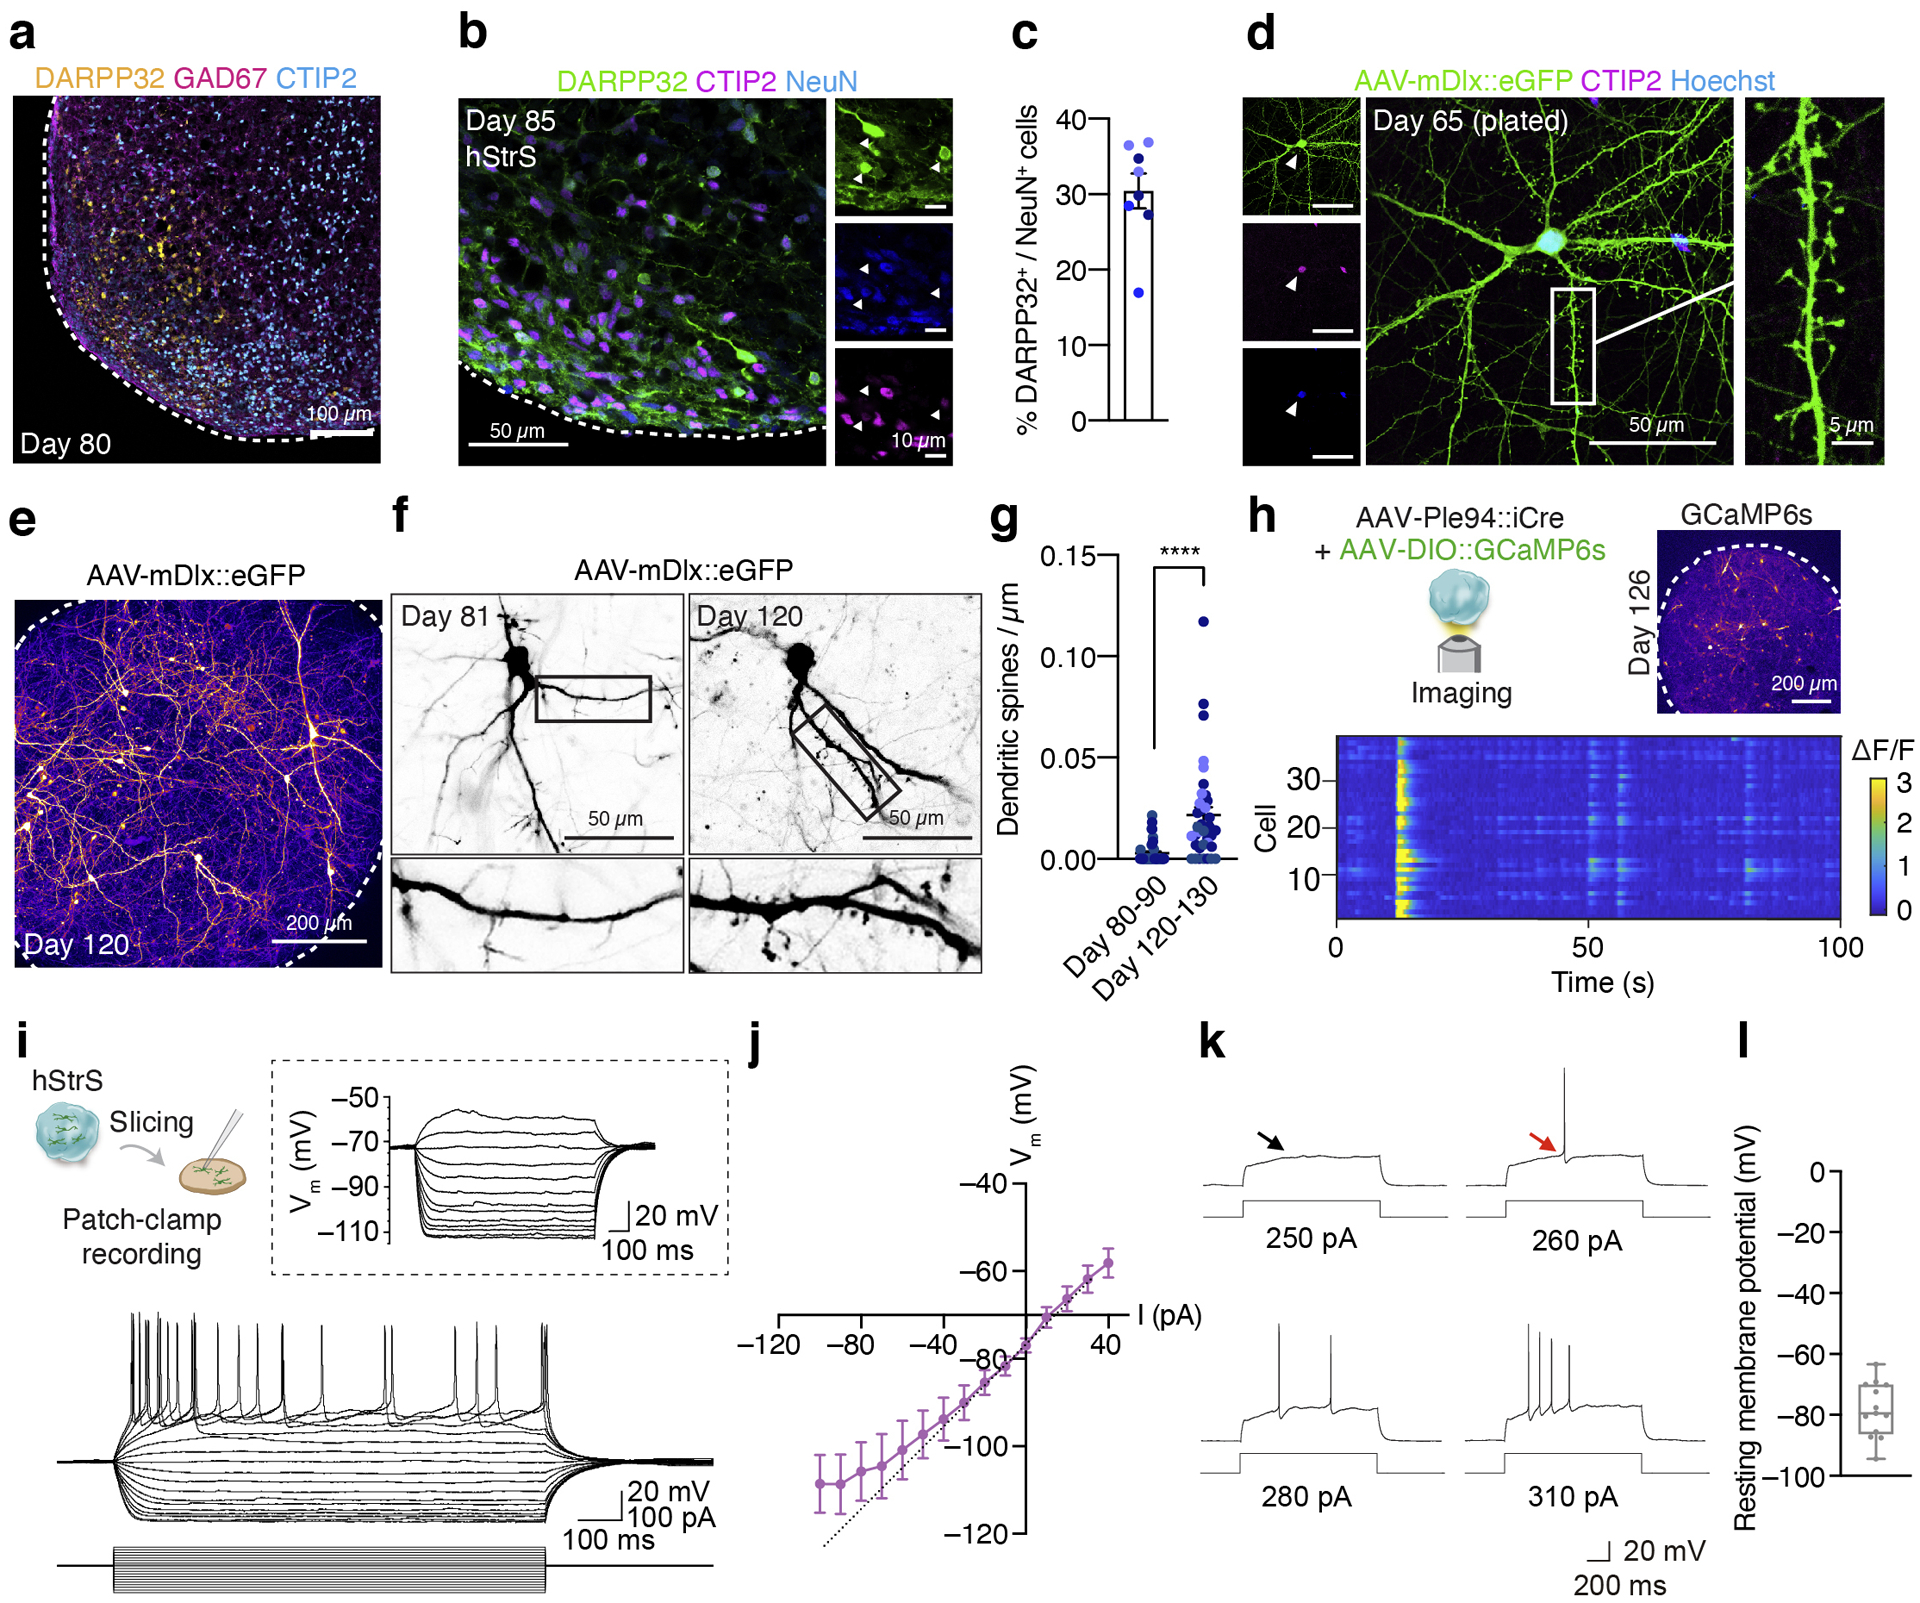
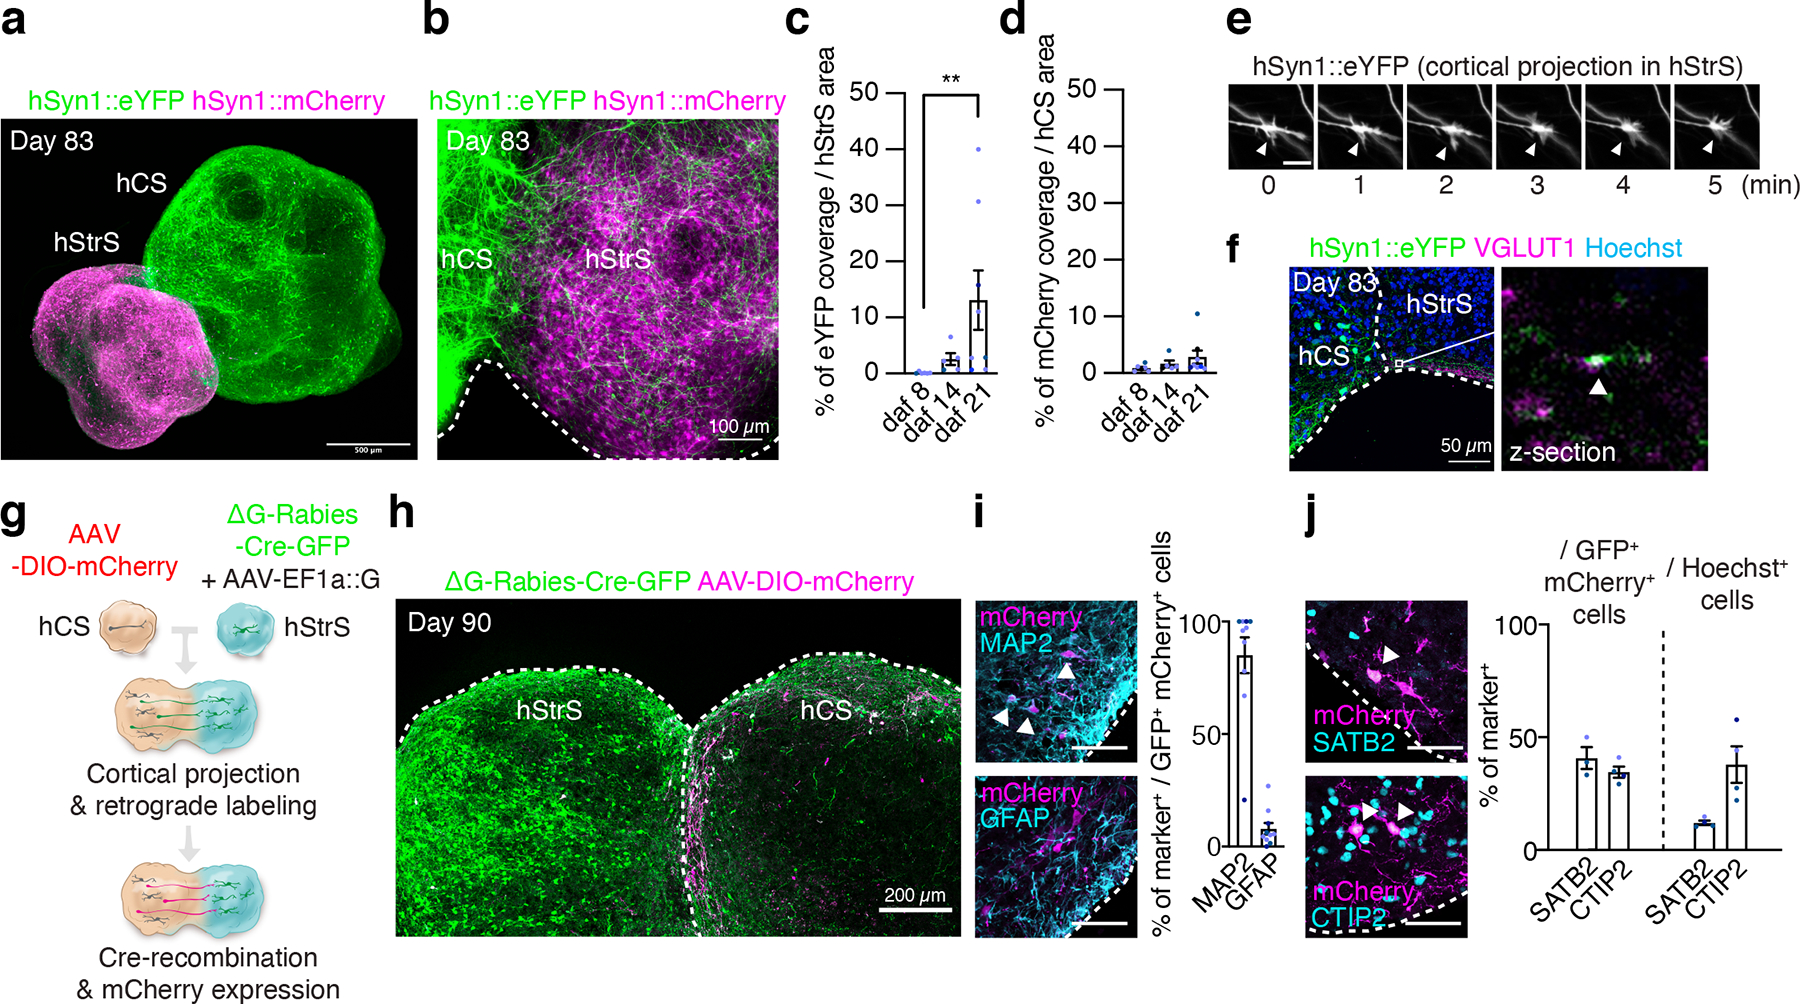
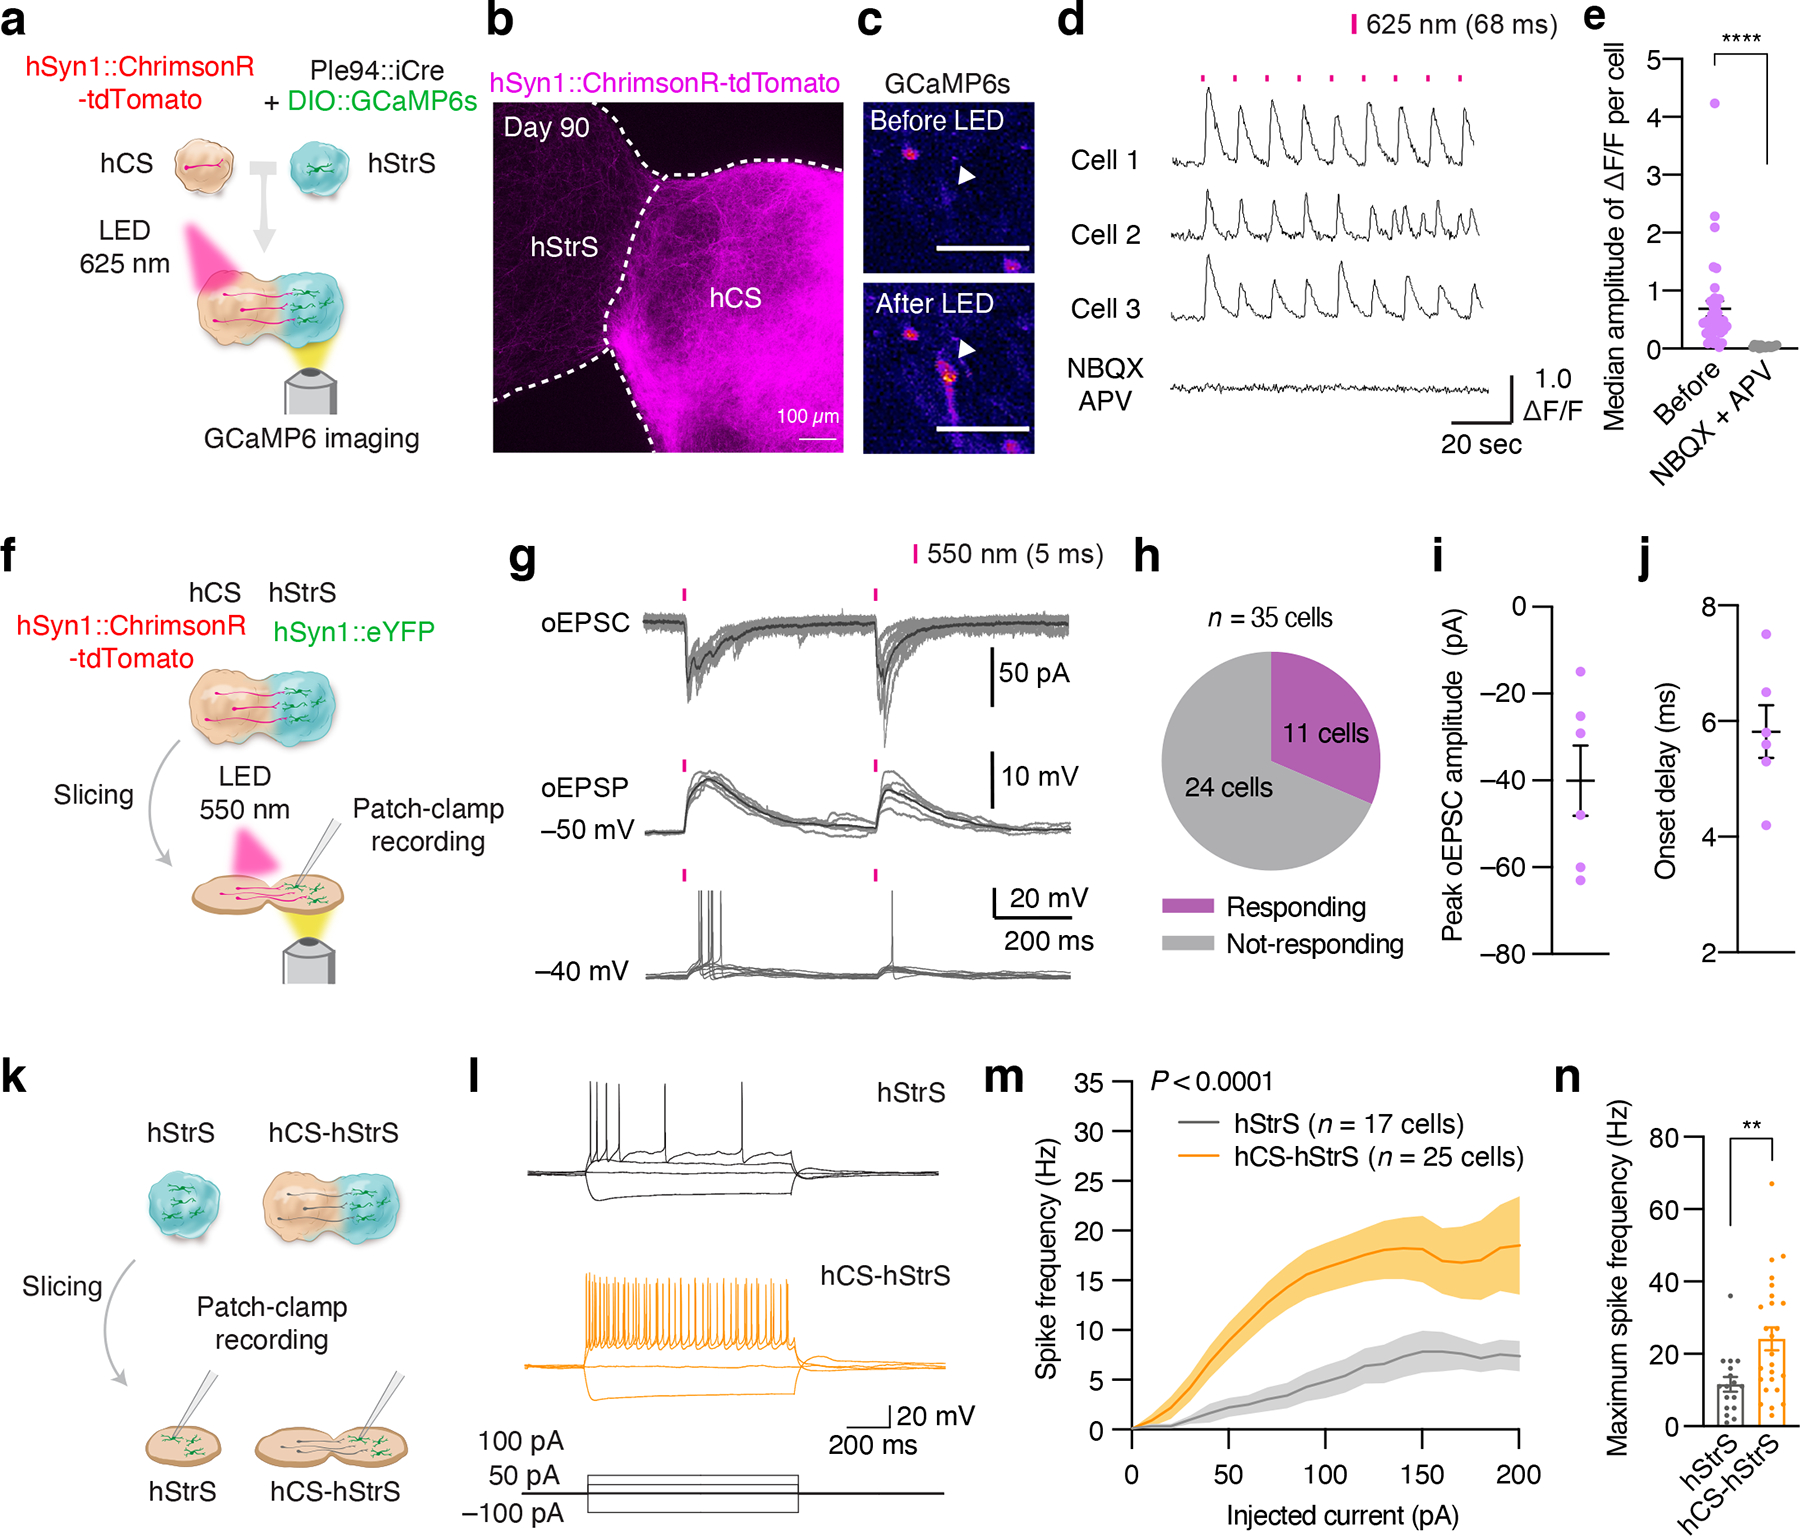
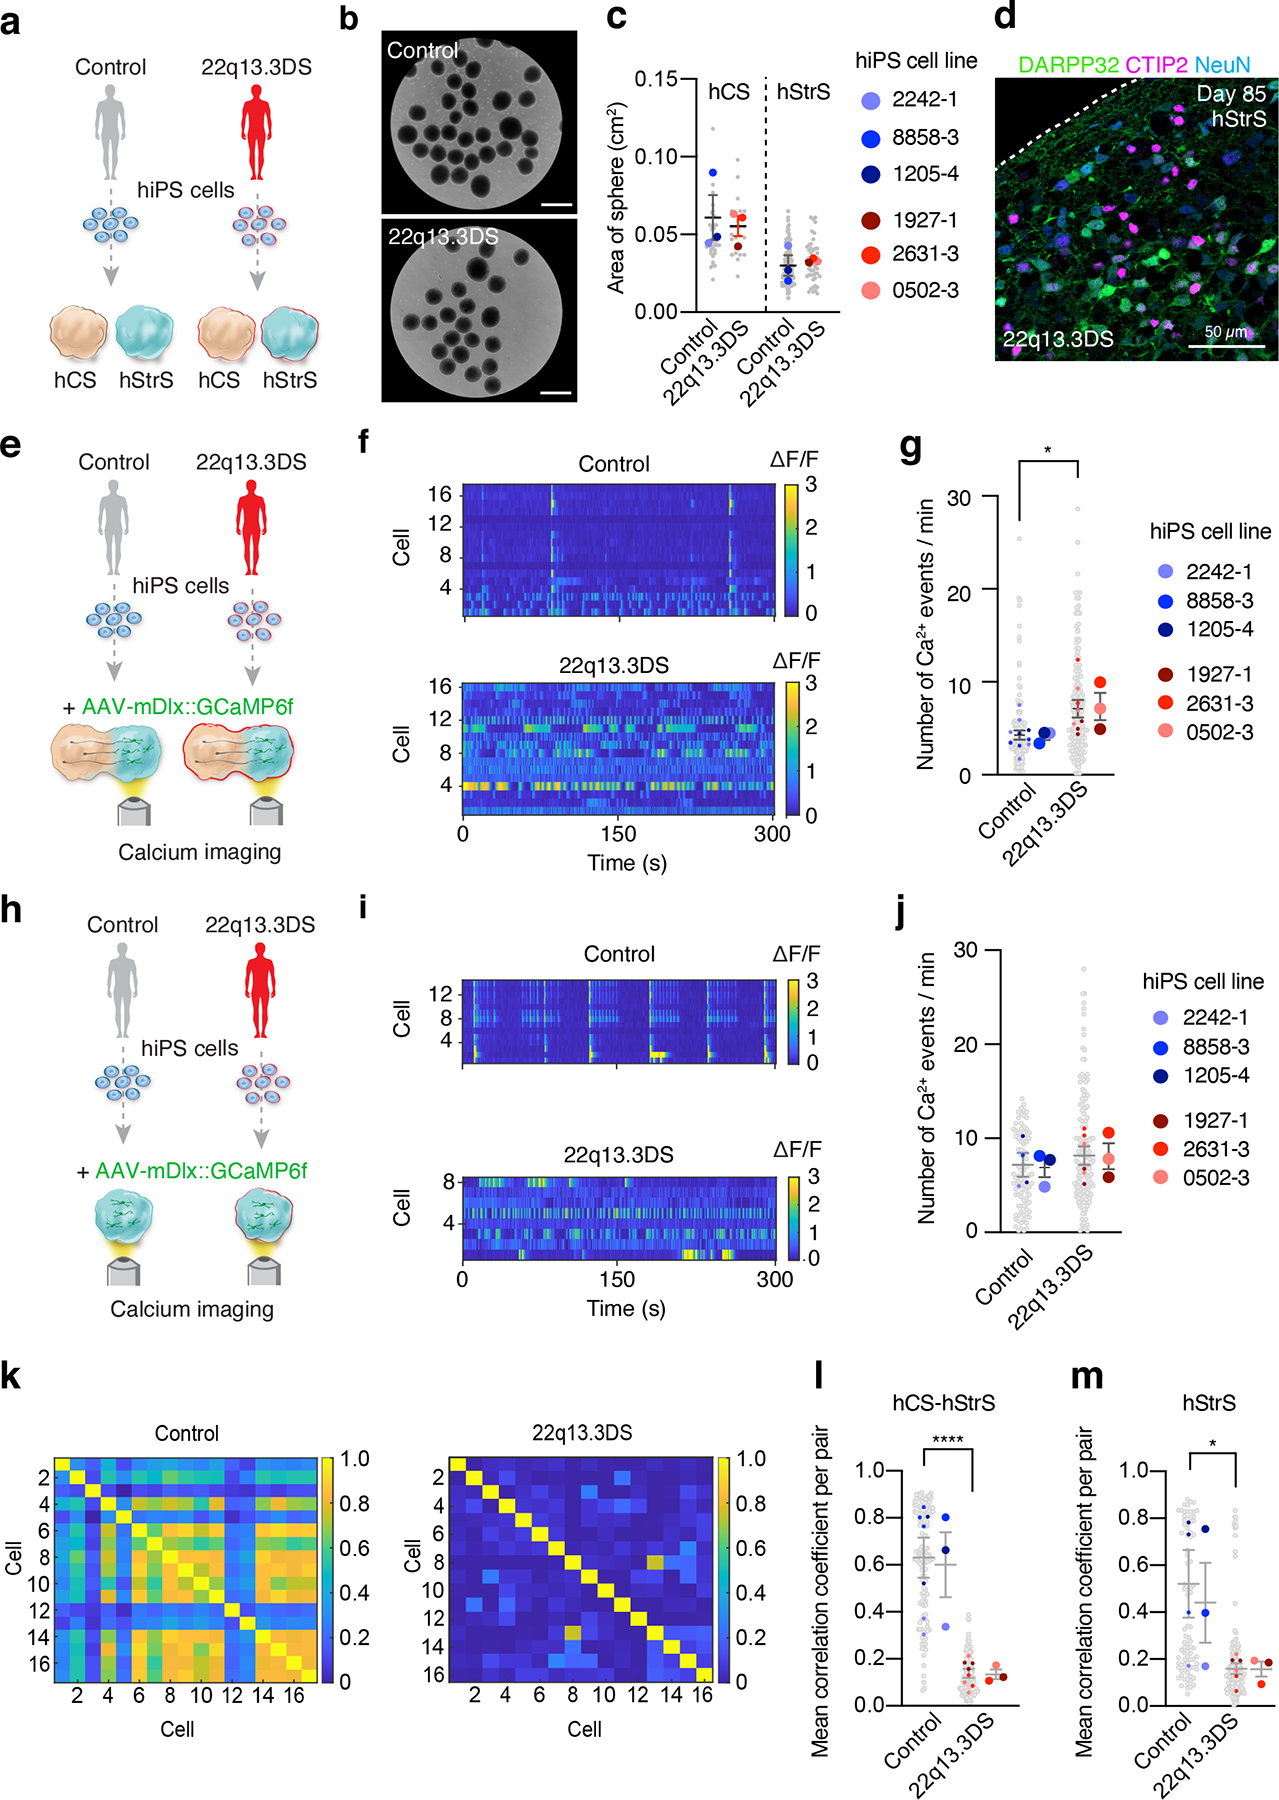
Cortico-striatal projections are critical components of forebrain circuitry that regulate motivated behaviors. To enable the study of the human cortico-striatal pathway and how its dysfunction leads to neuropsychiatric disease, we developed a method to convert human pluripotent stem cells into region-specific brain organoids that resemble the developing human striatum and include electrically active medium spiny neurons. We then assembled these organoids with cerebral cortical organoids in three-dimensional cultures to form cortico-striatal assembloids. Using viral tracing and functional assays in intact or sliced assembloids, we show that cortical neurons send axonal projections into striatal organoids and form synaptic connections. Medium spiny neurons mature electrophysiologically following assembly and display calcium activity after optogenetic stimulation of cortical neurons. Moreover, we derive cortico-striatal assembloids from patients with a neurodevelopmental disorder caused by a deletion on chromosome 22q13.3 and capture disease-associated defects in calcium activity, showing that this approach will allow investigation of the development and functional assembly of cortico-striatal connectivity using patient-derived cells.


Conflict of interest statement

COMPETING INTERESTS STATEMENT

Stanford University has filed a provisional patent application covering the protocol and methods for the generation of striatal spheroids and cortico-striatal assembloids. M.H.P. is a consultant for and has equity interest in CRIPR Tx. During the duration of this study, K.I. was an employee of Daiichi-Sankyo Co., Ltd, although the company had no input on the design, execution, interpretation, or publication of the data.

Figures

Extended Data Fig. 1
Extended Data Fig. 1. Generation of the GSX2 gene reporter hiPS cell line
(a) Schematic showing the 1st step of the HDR-based genome editing and (b) the design of the 1st donor plasmids. The genomic sequence around the stop codon of GSX2 gene was replaced by EGFP and the truncated CD8 (tCD8) expression cassette. Arrows indicate the position of primer sets used for the genotyping PCR. Details on genome editing design and the sequence of 1st donor vector are available in Supplementary Table 1. (c) Genotyping and detection of random integration. Primer set 1 (P1) shows targeted integration of the selection marker expression cassette in the GSX2 locus. Primer set 2 (P2) and set 3 (P3) show random integration. For hiPS cell lines #2 and #6, a single 5.5 kb band was detected by P1 and no band was detected by P2 or P3. Subsequent ddPCR showed that 2 copies of exogenous UbC promoter were integrated in #2 and #6. Line #2 was used in the next step of genome engineering. Pa: parental hiPS cell line. (d) Schematic showing the 2nd editing step, and (e) the design of the 2nd donor plasmid. The selection marker expression cassette was replaced by mCherry. Arrows show the primer sets used in the genotyping PCR. The size of amplicons is indicated by arrows. Information on the 2nd donor is available in Supplementary Table 2. (f) Genotyping of the negatively selected lines by PCR. The single 3.5 kbp band indicate biallelic editing. Line #1 from the 2nd editing step was used for further experiments. Full-length, unprocessed gel images for c and f are included in Source Data 1.
Extended Data Fig. 2
Extended Data Fig. 2. Generation of hStrS
(a) Schematic illustrating the differentiation conditions for striatal differentiation as compared to the protocol for generating hCS. Ac (Activin), AcI (Activin + IWP-2), AcSr (Activin + SR11237), AcISr (Activin + IWP-2 + SR11237) (b) Immunostaining of neural spheroids at day 15 differentiation in the reporter GSX2::mCherry line. Scale bars: 200 μm. (c–d) Percentage of (c) GSX2::mCherry+ cells and (d) CTIP2+ cells in neural spheroids at day 15 (n = 3 differentiation experiments with GSX2::mCherry line; one-way ANOVA, F4,10 = 5.7, P = 0.01, following Tukey’s multiple comparison test: *P = 0.01 for hCS vs AcISr and *P = 0.01 for A vs AcISr in c, one-way ANOVA F4,10= 5.03, P = 0.01, following Tukey’s multiple comparison test for d; **P = 0.009 for hCS vs AcISr). (e) Gene expression pattern of RXRG in developing striatum (Str), amygdala (Amy), neocortex (Ncx), hippocampus (Hip), mediodorsal nucleus thalamus (Mdt) and cerebellar cortex (Cbc) in the BrainSpan transcriptome dataset (https://hbatlas.org/). (f) Schematic illustrating differentiation conditions and different SR11237 concentrations as compared to the protocol for generating hCS, and (g) level of gene expression (RT-qPCR) for DLX5, GSX2, BCL11B (CTIP2), and MEIS2. n = 3 neural spheroids from 3 hiPS cell lines; one-way ANOVA, F5,12 = 4.6, P = 0.01, following Tukey’s multiple comparison test: *P = 0.01 for hCS vs 100 nM for DLX5, one-way ANOVA, F5,12 = 4.6, P = 0.01, following Tukey’s multiple comparison test: *P = 0.03 for hCS vs 25 nM, *P = 0.01 for hCS vs 100 nM, *P = 0.01 for hCS vs long 100 nM for GSX2, one-way ANOVA, F5,12 = 9.07, P = 0.0009, following Tukey’s multiple comparison test: *P = 0.01 for hCS vs 25 nM, **P = 0.005 for hCS vs 50 nM, **P = 0.001 for hCS vs 100 nM, ***P = 0.001 for hCS vs long 100 nM for BCL11B, one-way ANOVA, F5,12 = 11.69, P = 0.0003, following Tukey’s multiple comparison test: *P = 0.02 for hCS vs 25 nM, ***P = 0.0005 for hCS vs 100 nM, ***P = 0.0003 for hCS vs long 100 nM for MEIS2. (h) Gene expression (by RT-qPCR) of FOXG1, DLX5, GSX2, BCL11B (CTIP2), MEIS2, RAX, and HOXB4. For FOXG1, GSX2, BCL11B (CTIP2), MEIS2, RAX and HOXB4: n = 9 neural spheroids (hCS or hStrS) from 3 differentiation experiments of 4 hiPS cell lines. For DLX5: n = 7 hCS from 2 differentiation experiments of 4 hiPS cell lines, n = 4 hStrS from 2 differentiation experiments of 2 hiPS cell lines. Two-tailed unpaired t-test **P = 0.002 for FOXG1, two-tailed Mann-Whitney test **P = 0.006 for DLX5, two-tailed unpaired t-test **P = 0.004 for GSX2, two-tailed unpaired t-test ***P = 0.0007 for BCL11B, two-tailed unpaired t-test **P = 0.002 for MEIS2, two-tailed Mann-Whitney test P = 0.67 for RAX, two-tailed unpaired t-test P = 0.88 for HOXB4. The 2242–1 hiPS cell line is shown in orchid blue, 8858–3 in blueberry blue, 1205–4 in midnight blue, and 0524–1 in ocean blue. Data shown are mean ± s.e.m.
Extended Data Fig. 3
Extended Data Fig. 3. Characterization of hStrS
(a) UMAP visualization of expression of selected genes in the hStrS single cell RNA-seq data at day 80–83 of in vitro differentiation (n = 25,772 cells from 3 hiPS cell lines). (b) Percentage of major cell type clusters in hStrS. (c) Expression of forebrain (FOXG1), midbrain, hindbrain (EN1), dorsal forebrain (EMX1), LGE and MGE markers in hStrS. (d) UMAP visualization of the resolved single cell RNA-seq data of hStrS, and (d) heat map for the top 10 genes in each cluster. (f) UMAP visualization of the single cell RNA-seq data color coded by the hiPS cell lines: 2242–1 (red), 1205–4 (green), 8858–3 (blue). (g) Plots showing the Pearson correlation of the normalized average gene expression between each of the three hiPS cell lines used. (h) Graph showing the percentage of cells in each of the three hiPS cell lines belonging to each cluster in hStrS.
Extended Data Fig. 4
Extended Data Fig. 4. Characterization of hStrS
(a) VoxHunt mapping of the hStrS GABAergic neuron cluster to the BrainSpan human brain dataset (PCW 5–10, 10–15, and 15–20). (b) VoxHunt mapping of the glutamatergic neuronal cluster in hStrS. (c) Expression of early amygdala marker TFAP2D in hStrS. (d) UMAP visualization of single cell RNA expression in GABAergic neurons subcluster of hStrS at day 80–83 of in vitro differentiation. (e) Expression of SST, PVALB, CALB1, CALB2, CHAT, TH, NOS1, NPY in the hStrS GABAergic subcluster. (f) Left, immunostaining for MAP2 (green), CALB1 (magenta), Hoechst (blue) in hStrS at day 85. Right, immunostaining for MAP2 (green), CALB2 (magenta), Hoechst (blue) in hStrS at day 85. n = 4 hiPS cell lines. Scale bar: 50 μm.
Extended Data Fig. 5
Extended Data Fig. 5. Comparison of hStrS to hSS
(a,b) UMAP visualization of scRNA-seq data from hStrS and hSS. (c) Percentage of cells from hStrS and hSS in each cluster. (d) Heat map for the top 10 genes in each cluster. (e) Expression of SP8, LHX6, HTR3A, SST in hStrS (top) and hSS (bottom). (f) Representative immunocytochemistry images of hCS and hStrS (day 80) for the neuron marker MAP2 (magenta), astrocyte marker GFAP (cyan) and oligodendrocyte marker MBP (yellow). Scale bar: 100 μm for left and middle images, and 50 μm for right image. Immunostainings were repeated in spheroids from 2 independent differentiation experiments with similar results.
Extended Data Fig. 6
Extended Data Fig. 6. Characterization of hStrS neurons
(a) Representative image of an E18.5 mouse brain section immunostained with antibodies against CTIP2 (BCL11B) (green), DARPP32 (magenta) and Hoechst (blue). Scale bar: 500 μm. (b–d) Immunostaining for ASCL1 (green), CTIP2 (magenta), Hoechst (blue) in b, FOXP2 (green), GAD65 (magenta) and Hoechst (blue) in c, DARPP32 (yellow), GAD67 (magenta) and CTIP2 (cyan) in d, hStrS at day 85. n = 3 hiPS cell lines. Scale bar: 100 μm in b,c, and 50 μm in d. (ei) Representative immunocytochemistry images of dissociated hStrS neurons that have been labeled with an AAV-mDlx::eGFP at day 65 or at day 104. Scale bar: 50 μm for the left and middle image, and 5 μm for the right image (e). 50 μm for left, and 5 μm for right image (i). Quantification of CTIP2+ and DARPP32+ cells in mDlx::eGFP infected and 2D-plated hStrS cells. n = 3 neural spheroids from 2 hiPS cell lines in f, n = 2 neural spheroids from 2 hiPS cell lines in h. (j) Expression of DRD1, DRD2, TAC1, PENK in hStrS. (k) Immunostaining for GFP (green), DRD2 (magenta), Hoechst (blue), hStrS at day 124. Scale bar: 10 μm. Immunostainings were repeated in spheroids from 3 independent differentiation experiments with similar results. (l,m) Dendritic spine morphology of hCS neurons labelled with CaMKII::eYFP and of hStrS neurons labelled with AAV-mDlx::eGFP. Quantification of the number of dendritic spines (day 100–110: n = 26 neurons for hCS, n = 27 neurons for hStrS; from 2 hiPS cell lines; two-tailed, Mann-Whitney test, P = 0.17). (n) Quantification of number of dendritic spines (day 120–130: n = 8 neurons from the 2242–1 line, n = 22 neurons from the 1205–4 line; two-tailed, Mann-Whitney test, P = 0.44). (o) Gene expression of GPR88 in developing human brain in the BrainSpan transcriptome dataset (https://hbatlas.org/). (p) Representative image of dissociated hStrS neurons labeled with Ple94::iCre and DIO-eYFP at day 100. Expression of eYFP is induced by iCre expression under a mini-promoter including regulatory region of striatal gene GPR88 (Ple94). Arrow heads indicate eYFP+/GAD65+ cells. Scale bar: 100 μm. (q) Quantitative results showing percentage of GAD65+ and GAD67+ cells out of eYFP+ cells following recombination with the Ple94 reporter. n = 3 hiPS cell lines. (r) Percentage of GAD65+ and GAD67+ cells out of Hoechst+ cells (n = 2 differentiation with 2 iPS cell lines. (s) Representative confocal live image of hStrS labeled with Ple94::iCre and DIO-eYFP at day 120. Scale bar: 100 μm. Data shown are mean ± s.e.m. Imaging were repeated in spheroids from 2 independent differentiation experiments with similar results.
Extended Data Fig. 7
Extended Data Fig. 7. Functional characterization of hStrS
(a–e) Effect of bicuculine (50 μM) (a–c) and NBQX (20 μM) + APV (50 μM) (d,e) on calcium signals (GCaMP6s) in hStrS neurons at day 104. GCaMP6s was induced by iCre expression under a minipromoter that includes the regulatory region of the striatal gene GPR88 (Ple94). Heatmap showing ΔF/F of GCaMP6s signals. n = 74 cells before and n = 55 cells after bicuculine treatment in b; two-tailed, Mann-Whitney test, P = 0.09. n = 87 cells before and n = 56 cells after bicuculine exposure in c; two-tailed, unpaired t-test, P = 0.10. n = 25 cells before and n = 21 cells after NBQX + APV exposure in e. Data show mean ± s.e.m. (f) Expression of SLC12A2 and SLC12A5 in hStrS. (g,h) RT-qPCR for NKCC1 and KCC2. n = 4 neural spheroids from 4 hiPS cell lines at day 15, n = 3 neural spheroids from 3 hiPS cell lines at day 93, n = 6 neural spheroids from 3 hiPS cell lines at day 170; Kruskal-Wallis test, *P = 0.01, Dunn’s multiple comparisons test: *P = 0.02 for day 15 vs day 170 in NKCC1, one-way ANOVA, F3,12 = 4.38, P = 0.02, following Tukey’s multiple comparison test: *P = 0.04 for day 15 vs day 170 in KCC2. (i) Representative recording of spontaneous IPSC in hSyn1::eYFP expressing hStrS neurons at day 160. The 2242–1 hiPS cell line is shown in orchid blue, 8858–3 in blueberry blue, 1205–4 in midnight blue, 0524–1 in ocean blue, 0410–1 in aqua blue. Data show mean ± s.e.m.
Extended Data Fig. 8
Extended Data Fig. 8. Characterization of cortico-striatal assembloids
(a) Representative images of cortico-striatal assembloids at 8, 14, 21 days after assembly (daf). Scale bar: 500 μm. Imaging was repeated in assembloids from 2 independent differentiation experiments with similar results. (b) hCS neurons (Syn1::YFP+) projecting towards PSD95+ puncta on dendrites of mCherry+ hStrS neurons at day 96. Immunostainings were repeated in assembloids from 2 independent differentiation experiments with similar results. (c) mCherry+ projections from hCS in cortico-striatal assembloids (hCS was infected with a AAV-EF1a::DIO-mCherry; hStrS was infected with ΔG-Rabies virus-Cre-GFP and a AAV-EF1a::G). Scale bar: 100 μm. (d,e) Comparison of stimulus-triggered change in amplitude of ΔF/F of GCaMP6 signals to random time-locked ΔF/F in the same cell; (d) Representative traces of ΔF/F from real stimulation (top) and randomly selected time-points (bottom), and (e) quantitative results. n = 180 cells from 10 assembloids with 3 hiPS cell lines; two-tailed Wilcoxon test ***P = 0.0002. (f) Representative trace of ΔF/F of GCaMP6 signal at LED / 150 frame (top) and at LED / 300 frame (bottom). (g) Representative traces of GCaMP6s imaging and median amplitude of ΔF/F per cell before, during NBQX (20 μM) and APV (50 μM) treatment and after wash. Data show mean ± s.e.m. (h,i) Schematics of a control optogenetics coupled with calcium imaging experiment in cortico-striatal assembloids. Quantitative results of ΔF/F from a real stimulation and a randomly selected time-point at day 108. n = 68 cells from 3 assembloids derived from 2 hiPS cell lines; two-tailed Wilcoxon test, P = 0.33. (j) Quantitative results of ΔF/F from day 90 to day 145 cortico-striatal assembloids. n = 68 cells from 3 assembloids derived from 2 hiPS cell lines; Kruskal-Wallis test, ****P < 0.0001, Dunn’s multiple comparisons test: ****P < 0.0001 for day < 100 vs day 100–120, **P = 0.004 for day < 100 vs day 140–150. Data show mean ± s.e.m. Box plots show maximum, third quartile, median, first quartile, and minimum values.
Extended Data Fig. 9
Extended Data Fig. 9. Electrophysiological characterization of cortico-striatal assembloids
(a) Analyses on individual action potential traces in hStrS and hCS-hStrS neurons. (b) Quantification of spike amplitude, (c) spike threshold, (d) dV/dt max, (e) dV/dt min, (f) spike half width, (g) AHP, (h) time of AHP, (i) capacitance, (j) input resistance and (k) resting membrane potential in hCS, hStrS and hCS-hStrS neurons; n = 17 cells from hStrS, n = 25 cells from hCS-hStrS derived from 3 hiPS cell lines; two-tailed unpaired t-test P = 0.64 for b, two-tailed unpaired t-test P = 0.60 for c, two-tailed unpaired t-test P = 0.94 for d, two-tailed unpaired t-test P = 0.37 for e, two-tailed unpaired t-test *P = 0.02 for f, two-tailed unpaired t-test P = 0.53 for g, two-tailed unpaired t-test P = 0.87 for h, two-tailed unpaired t-test P = 0.68 for i, Mann-Whitney test P = 0.82 for j, Kruskal-Wallis test, ****P < 0.0001, Dunn’s multiple comparisons test: ****P < 0.0001 for hCS vs hStrS, ****P < 0.0001 for hCS vs hCS-hStrS, P = 0.80 for hStrS vs hCS-hStrS for k. (l) Representative traces of spontaneous EPSC (sEPSC) and (m) frequency of sEPSCs in hStrS and hCS-hStrS (n = 17 cells in hStrS, n =10 cells in hCS-hStrS from 3 hiPS cell lines; two-tailed Mann-Whitney test ***P = 0.0006. (n) Quantification of the number of dendritic spines (day 100–110: n = 9 neurons for hStrS, n = 27 neurons for hCS-hStrS from one hiPS cell line; two-tailed, Mann-Whitney test, P = 0.17).Data shown are mean ± s.e.m. Box plots show maximum, third quartile, median, first quartile, and minimum values.
Extended Data Fig. 10
Extended Data Fig. 10. Characterization of hiPS cells derived from subjects with 22q13.3 deletion syndrome.
(a) Representative images showing morphology of hiPS cells from control and 22q13.3DS patients. Scale bars: 1 mm. Imaging was repeated in 2 independent differentiation experiments with similar results. (b) SNP array of hiPS cells showing the 22q13.3 deletion locus. Upper shows B Allele Frequency, and bottom Log R Ratio for chromosome 22q region. (c) Immunostaining for pluripotency stem cell markers OCT4 (green) and SSEA4 (magenta). Scale bars: 200 μm. (d) Representative images of 3D neural spheroids at day 5 of differentiation from control and 22q13.3DS hiPS cell lines. Scale bars: 1 mm. Imaging was repeated in spheroids from 3 independent differentiation experiments with similar results. (e) Gene expression (RT-qPCR) for the forebrain marker FOXG1, the LGE markers GSX2, MEIS2, BCL11B (CTIP2), and the spinal cord marker HOXB4 at day 22 of differentiation in hCS and hStrS derived from 22q13.3DS hiPS cells (n = 9 neural spheroids from 3 hiPS cell lines; two-tailed Mann-Whitney test **P < 0.002 for FOXG1, two-tailed unpaired t-test ***P = 0.0001 for GSX2, two-tailed Mann-Whitney test ****P < 0.0001 for MEIS2, two-tailed unpaired t-test ****P < 0.0001 for BCL11B (CTIP2), two-tailed Mann-Whitney test P = 0.99 for HOXB4. (f) Immunostaining for DARPP32 (green), CTIP2 (magenta) and NeuN (blue) in day 85 hStrS. Scale bar: 50 μm. Data shown are mean ± s.e.m. Immunostainings were repeated in spheroids from 2 independent differentiation experiments with similar results.
FIGURE 1.
FIGURE 1.. Generation of 3D human striatal spheroids (hStrS)
(a) Schematic diagram describing cortico-striatal projection in the developing human forebrain at mid-gestation, and (b) in vitro modeling of the cortico-striatal projections using assembloid derived from hiPS cells. (c) Differentiation condition for human cortical spheroids (hCS) and human striatum spheroids (hStrS). (d) UMAP visualization of single cell RNA expression in hStrS at day 80–83 of in vitro differentiation (n = 25,772 cells from 3 hiPS cell lines). (e) Dot plot shows percentage of selected markers for each cell cluster. (f) VoxHunt spatial brain mapping of the GABAergic neuron cluster in hStrS onto E13.5 mouse brain data from the Allen Brain Institute, and (g) correlation to the BrainSpan dataset of the human developing brain (PCW 20–25).
FIGURE 2.
FIGURE 2.. Characterization of 3D human striatal spheroids (hStrS)
(a) Immunostaining for DARPP32 (yellow), GAD67 (magenta) and CTIP2 (cyan) in hStrS at day 80. n = 5 hiPS cell lines. Scale bar: 100 μm. (b,c) Immunostaining for DARPP32 (green), CTIP2 (magenta), and NeuN (blue), and quantification of CTIP2+ and DARPP32+ cells in hStrS at day 85. n = 8 neural differentiation experiments of 3 hiPS cell lines. (d) Representative image showing dissociated hStrS cells labelled with AAV-mDlx::eGFP reporter, and. eGFP (green), CTIP2 (magenta), and Hoechst (blue). Scale bar: 50 μm (left) and 5 μm (right). Immunostainings were repeated in dissociated hStrS cultures from 4 independent differentiation experiments with similar results. (e–g) Dendritic spine morphology in the hStrS neurons labelled with AAV-mDlx::eGFP and quantification of number of dendritic spines (day 80–90: n = 40 neurons from 3 neural differentiation experiments of 2 hiPS cell lines; day 120–130: n = 38 neurons from 4 differentiation experiments of 3 iPS cell lines; two-tailed, Mann-Whitney test, ****P < 0.0001). (h) Calcium imaging of hStrS neurons expressing the genetically encoded calcium indicator GCaMP6s at day 126 of differentiation. GCaMP6s is induced by iCre expression under a minipromoter including regulatory region of striatal gene GPR88 (Ple94). Heatmap showing ΔF/F of GCaMP6s signal from 39 cells. Imaging was repeated in hStrS from 3 independent differentiation experiments with similar results. Scale bar: 200 μm. (i) Whole cell patch-clamp recording and representative membrane response of hSyn1::eYFP labeled hStrS neurons following intracellular current pulse injection. (j) Current-frequency (I-V) curve showing inward rectification in hSyn1::eYFP+ hStrS neurons (n= 17 cells from hStrS at day 110–120). (k) Representative traces showing slow-ramp depolarization of hSyn1::eYFP+ hStrS neurons at day 160. The black arrow indicates slow-ramp depolarization, the red arrow indicates delayed first spike. (l) Resting membrane potential (n = 13 cells from hStrS at day 160–170). Data show mean ± s.e.m. Box plots show maximum, third quartile, median, first quartile, and minimum values.
FIGURE 3.
FIGURE 3.. Generation of cortico-striatal assembloids
(a) Three-dimensional immunostaining of CUBIC-cleared cortico-striatal assembloids expressing AAV-hSyn1::eYFP in hCS and AAV-hSyn1::mCherry in hStrS (day 83). Scale bar: 500 μm. (b) Axon projections (YFP+) from hCS into hStrS in cortico-striatal assembloids at 21 days after fusion (daf) (day 83 of differentiation). Scale bar 100 μm. (c) Quantification of percentage of eYFP fluorescence coverage per hStrS area, and (d) of mCherry fluorescence over hCS area. n = 6 assembloids for daf 8, n = 5 assembloids for daf 14, and n= 8 assembloids for daf 21; Kruskal-Wallis test, ***P = 0.0002, **P = 0.001 with Dunnett’s multiple comparison test for daf 21 versus daf 8 in c, and Kruskal-Wallis test, P = 0.17 for d. (e) Time lapse imaging in the hStrS side of cortico-striatal assembloids showing growth cones of hCS neurons labeled with eYFP. Arrow heads indicate the growth cone. Scale bar: 10 μm. Imaging was repeated in assembloids from 3 independent differentiation experiments with similar results. (f) Representative image showing glutamatergic terminal labeled with VGLUT1 in the hStrS side of cortico-striatal assembloids. Immunostainings were repeated in assembloids from 2 independent differentiation experiments with similar results. (g, h) Experimental design schematic and image showing retrograde viral labeling of projection neurons from hCS into hStrS using ΔG-Rabies-Cre-GFP virus. Cells labeled with AAV-DIO-mCherry in hCS that project to hStrS and receive the ΔG-Rabies-Cre-GFP retrogradely co-express GFP+ and mCherry+. Immunostainings were repeated in assembloids from 4 independent differentiation experiments with similar results. (i) Representative image and quantitative results showing percentage of neurons (MAP2+) and glial cells (GFAP+) that are retrogradely labeled (GFP+/mCherry+); n = 10 assembloids from 4 differentiation experiments of 3 hiPS cell lines. Scale bar: 50 μm. (j) Percentage of SATB2+ or CTIP2+ that are retrogradely labeled in the hCS side of assembloids (GFP+/mCherry+) (left), as compared to percentages of SATB2+ and CTIP2+ cells out of all cells in the same slice (right); n = 3 assembloids for SATB2+ / GFP+ mCherry+ cells, 4 assembloids for CTIP2+ / GFP+ mCherry+ cells, and 4 assembloids for SATB2+ and CTIP2+ / Hoechst+ cells from 2 differentiation experiments of 2–3 hiPS cell lines. Scale bar: 50 μm. Data show mean ± s.e.m.
FIGURE 4.
FIGURE 4.. Functional neural circuits in cortico-striatal assembloids
(a) Optogenetics coupled with calcium imaging of the cortico-striatal assembloid. hCS expressing AAV-ChrimsonR-tdTomato and hStrS expressing AAV-Ple94::iCre and AAV-EF1a::DIO-GCaMP6s are assembled. GCaMP6 expressing neurons in hStrS were imaged with 625 nm LED light stimulation (68 ms) at day 90–145 of differentiation. (b) Axon projection of ChrimsonR-tdTomato expressing neurons in hCS to hStrS of cortico-striatal assembloids at day 90. Scale bar: 100 μm. Imaging was repeated in assembloids from one differentiation experiment. (c) Cells in hStrS responding to 625 nm LED stimulation. Scale bar: 50 μm. Imaging was repeated in assembloids from 5 independent differentiation experiments with similar results. (d) Representative traces of GCaMP6s imaging, and (e) median amplitude of ΔF/F per cell of before and during NBQX (20 μM) and APV (50 μM) treatment. n = 36 cells for Before NBQX + APV, and 17 cells for during NBQX + APV; two-tailed Mann-Whitney test ****P < 0.0001. (f) Schematic diagram illustrating method for whole cell patch-clamp recording with optogenetic activation in cortico-striatal assembloids. (g) Representative traces of optically-evoked EPSC (oEPSC), optically-evoked EPSP (oEPSP) and neuronal firing of hStrS neurons by LED light stimulation (5-ms duration of 550 nm whole field LED illumination). (h) Percentage of responding cells (11/35 cells), (i) Peak oEPSC amplitude and (j) onset delay (n = 6 cells) of hStrS neurons in cortico-striatal assembloids. (k) Schematic showing whole-cell patch-clamp recording in hStrS or cortico-striatal assembloids in slices. (l) Representative electrophysiology traces of neurons in hStrS and hCS-hStrS neurons. (m) Frequency-current (F-I) curve showing spike frequency versus current injected in hStrS and hCS-hStrS neurons (n = 17 cells in hStrS, n = 25 cells in hCS-hStrS from 3 hiPS cell lines; two-way ANOVA, F1,840 = 131.6, ****P < 0.0001 for current injection), and (n) Maximum spike frequency (n = 17 cells in hStrS, n = 25 cells in hCS-hStrS from 3 hiPS cell lines; two-tailed unpaired t-test **P = 0.005). Data show mean ± s.e.m.
FIGURE 5.
FIGURE 5.. Modeling altered neural activity in cortico-striatal assembloids derived from 22q13.3 deletion syndrome patients
(a) Schematic illustrating the generation of hCS and hStrS derived from control and 22q13.3 deletion (22q13.3DS) hiPS cells. (b) Representative images of 3D neural spheroids (at day 5) derived from control and 22q13.3DS hiPS cell lines. Scale bars: 1 mm. (c) Quantification of the area of hCS and hStrS derived from control and 22q13.3DS at day 87–145; n = 40 spheroids for control hCS, n = 25 spheroids for 22q13.3DS hCS, n = 94 spheroids for control hStrS, n = 51 spheroids for 22q13.3DS from 4 differentiation experiments of 3 hiPS cell lines for control and 3 hiPS cell lines for 22q13.3DS; one-way ANOVA, F3,8 = 3.2, P = 0.07. (d) Immunostaining for DARPP32 (green), CTIP2 (magenta) and NeuN (blue) in day 85 hStrS derived from 22q13.3DS; n = 3 hiPS cell lines. Scale bar: 50 μm. (e) Schematic showing the functional characterization of cortico-striatal assembloids derived from 22q13.3 deletion patients. (f,g) Calcium imaging of hStrS neurons labeled with AAV-mDlx::GCaMP6f in hCS-hStrS (day 80, 18 daf) derived from control and 22q13.3DS patients, and quantitative result showing number of Ca2+ events per minute (n = 142 control cells from 10 assembloids with 3 hiPS cell lines, n = 164 22q13.3DS cells from 8 assembloids with 3 hiPS cell lines; two-tailed unpaired t-test *P = 0.01). (h) Schematic illustrating the calcium imaging of hStrS derived from 22q13.3DS patients. (i,j) Calcium imaging of hStrS neurons labeled with AAV-mDlx::GCaMP6f (day 80, 18 daf) derived from control and 22q13DS patients, and quantitative result showing number of Ca2+ events per minute (n = 91 control cells from 4 assembloids with 3 hiPS cell lines, n = 143 22q13.3DS cells from 6 assembloids with 3 hiPS cell lines; two-tailed unpaired t-test P = 0.54. (k) Heatmap showing mean correlation coefficient of ΔF/F of GCaMP6 per pair of cells in cortico-striatal assembloids from control (left) and 22q13.3DS (right), and (l,m) quantification in cortico-striatal assembloids (l) and spheroids (m). n = 127 cells for control from 7 assembloids and n = 173 cells for 22q13.3DS from 8 assembloids; two-tailed, unpaired t-test ****P < 0.0001 in l, n = 86 cells for control from 4 spheroids and n = 168 cells for 22q13.3DS from 6 spheroids; two-tailed, unpaired t-test *P = 0.01 in m. Data shown are mean ± s.e.m. Gray dots indicates cells, small colored dots show spheroids/assembloids and large colored dots show different hiPS cell line in c, g, j, l, m.

Comment in

  • Assembling organs in vitro.
    Mukhopadhyay M. Mukhopadhyay M. Nat Methods. 2021 Feb;18(2):119. doi: 10.1038/s41592-021-01068-9. Nat Methods. 2021. PMID: 33542506 No abstract available.

References

    1. Alexander GE, DeLong MR & Strick PL Parallel organization of functionally segregated circuits linking basal ganglia and cortex. Annu Rev Neurosci 9, 357–381 (1986). - PubMed
    1. Shepherd GM Corticostriatal connectivity and its role in disease. Nat Rev Neurosci 14, 278–291 (2013). - PMC - PubMed
    1. Milad MR & Rauch SL Obsessive-compulsive disorder: beyond segregated cortico-striatal pathways. Trends Cogn Sci 16, 43–51 (2012). - PMC - PubMed
    1. Peca J et al. Shank3 mutant mice display autistic-like behaviours and striatal dysfunction. Nature 472, 437–442 (2011). - PMC - PubMed
    1. Welch JM et al. Cortico-striatal synaptic defects and OCD-like behaviours in Sapap3-mutant mice. Nature 448, 894–900 (2007). - PMC - PubMed

Publication types