Quantification of spatial tumor heterogeneity in immunohistochemistry staining images
- PMID: 33275142
- PMCID: PMC8208754
- DOI: 10.1093/bioinformatics/btaa965
Quantification of spatial tumor heterogeneity in immunohistochemistry staining images
Abstract
Motivation: Quantitative immunofluorescence is often used for immunohistochemistry quantification of proteins that serve as cancer biomarkers. Advanced image analysis systems for pathology allow capturing expression levels in each individual cell or subcellular compartment. However, only the mean signal intensity within the cancer tissue region of interest is usually considered as biomarker completely ignoring the issue of tumor heterogeneity.
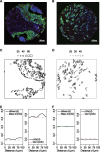
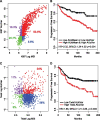
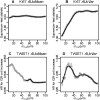
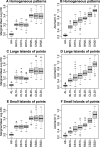
Results: We propose using immunohistochemistry image-derived information on the spatial distribution of cellular signal intensity (CSI) of protein expression within the cancer cell population to quantify both mean expression level and tumor heterogeneity of CSI levels. We view CSI levels as marks in a marked point process of cancer cells in the tissue and define spatial indices based on conditional mean and conditional variance of the marked point process. The proposed methodology provides objective metrics of cell-to-cell heterogeneity in protein expressions that allow discriminating between different patterns of heterogeneity. The prognostic utility of new spatial indices is investigated and compared to the standard mean signal intensity biomarkers using the protein expressions in tissue microarrays incorporating tumor tissues from 1000+ breast cancer patients.
Supplementary information: Supplementary data are available at Bioinformatics online.
© The Author(s) 2021. Published by Oxford University Press. All rights reserved. For permissions, please e-mail: journals.permissions@oup.com.
Figures


References
-
- Baddeley A. et al. (2000) Non- and semiparametric estimation of interaction in inhomogeneous point patterns. Stat. Neerl., 54, 329–350.
-
- Baddeley A., Turner R. (2005) Spatstat: an R package for analyzing spatial point patterns. J. Stat. Softw., 12, 1–42.
-
- Doyle S. et al. (2008) Automated grading of breast cancer histopathology using spectral clustering with textural and architectural image features. In: 2008 5th IEEE International Symposium on Biomedical Imaging: From Nano to Macro, pp. 496–49, IEEE, Piscataway, New Jersey.
Publication types
MeSH terms
Substances
Grants and funding
LinkOut - more resources
Full Text Sources
Medical

