. 2020 Dec 10;183(6):1714-1731.e10.
doi: 10.1016/j.cell.2020.10.038. Epub 2020 Dec 3.

Mapping the Degradable Kinome Provides a Resource for Expedited Degrader Development

Affiliations

Mapping the Degradable Kinome Provides a Resource for Expedited Degrader Development

Katherine A Donovan et al. Cell. .

Abstract

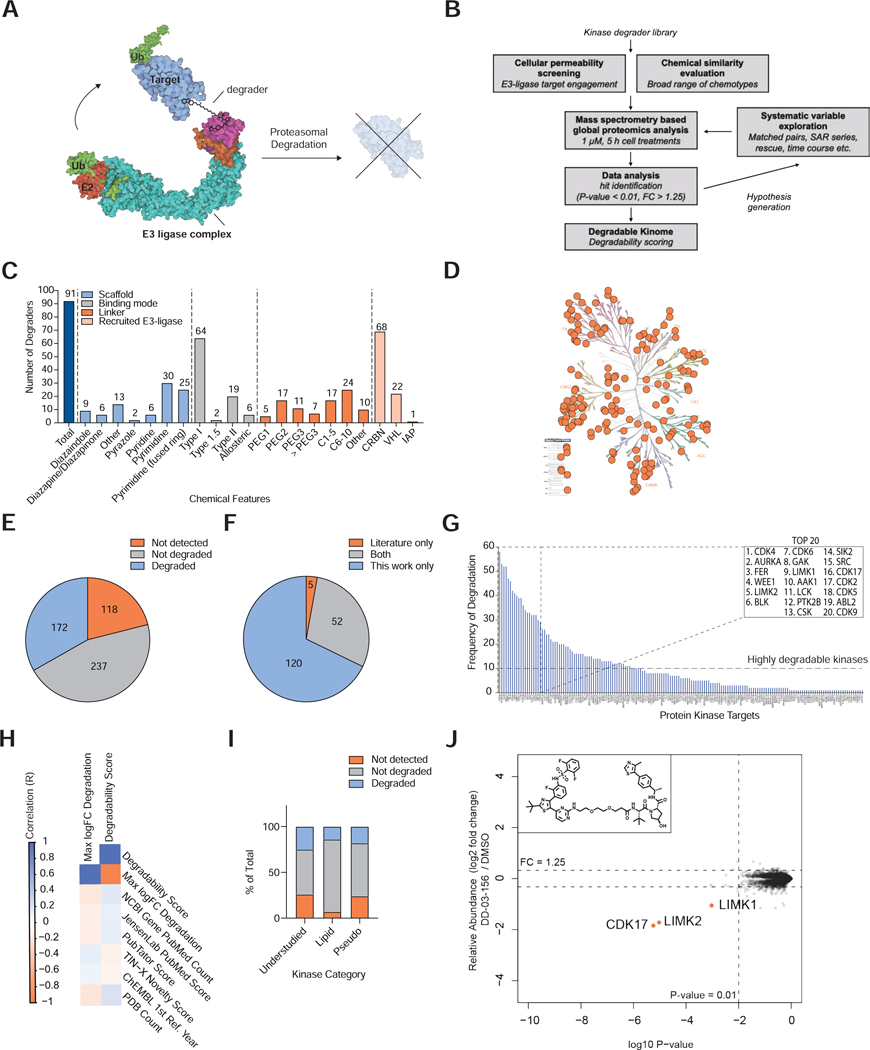
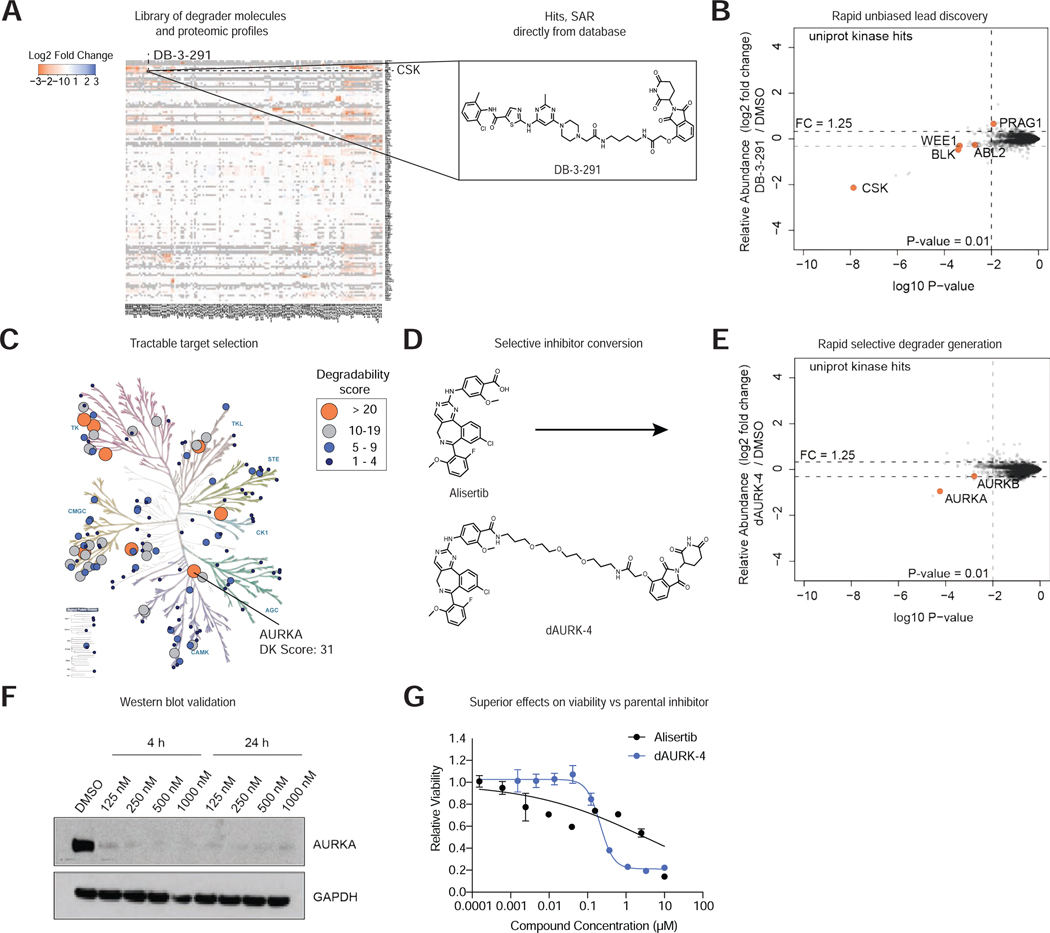
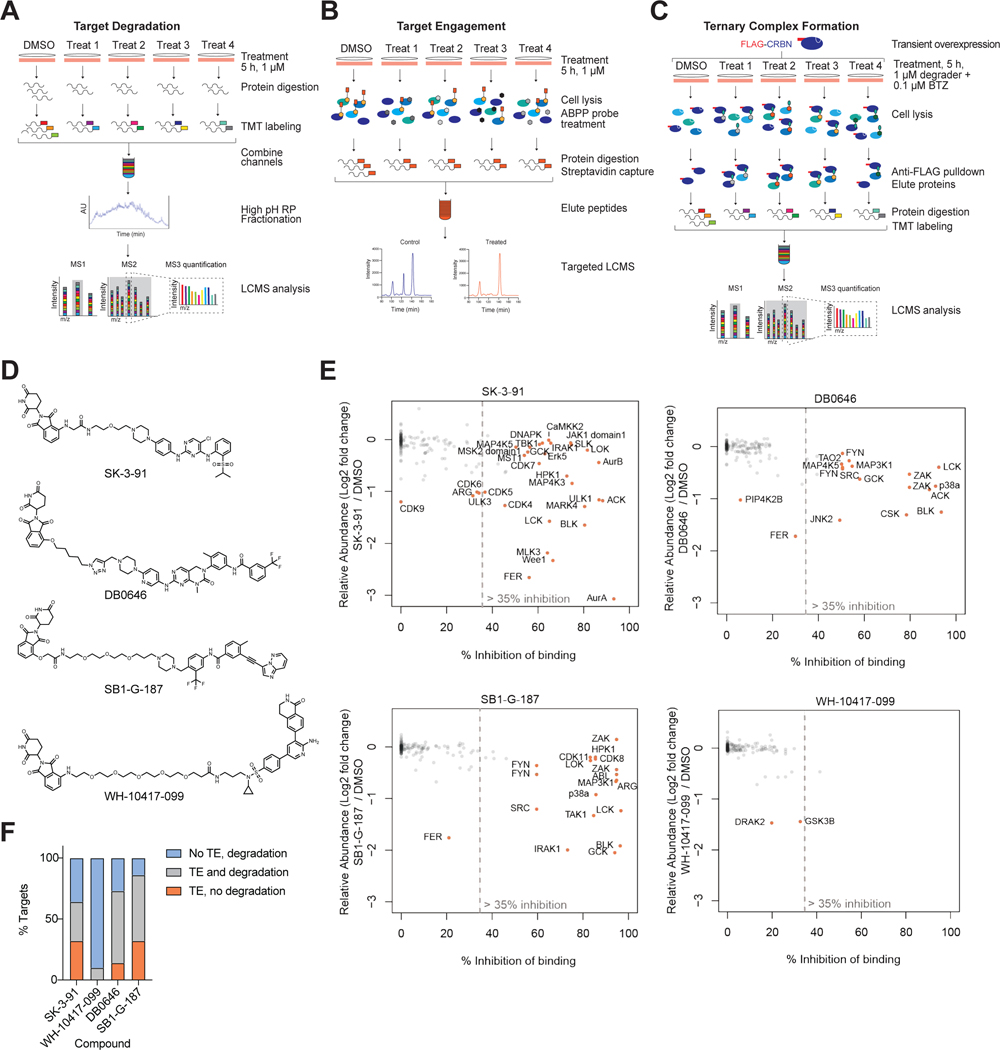
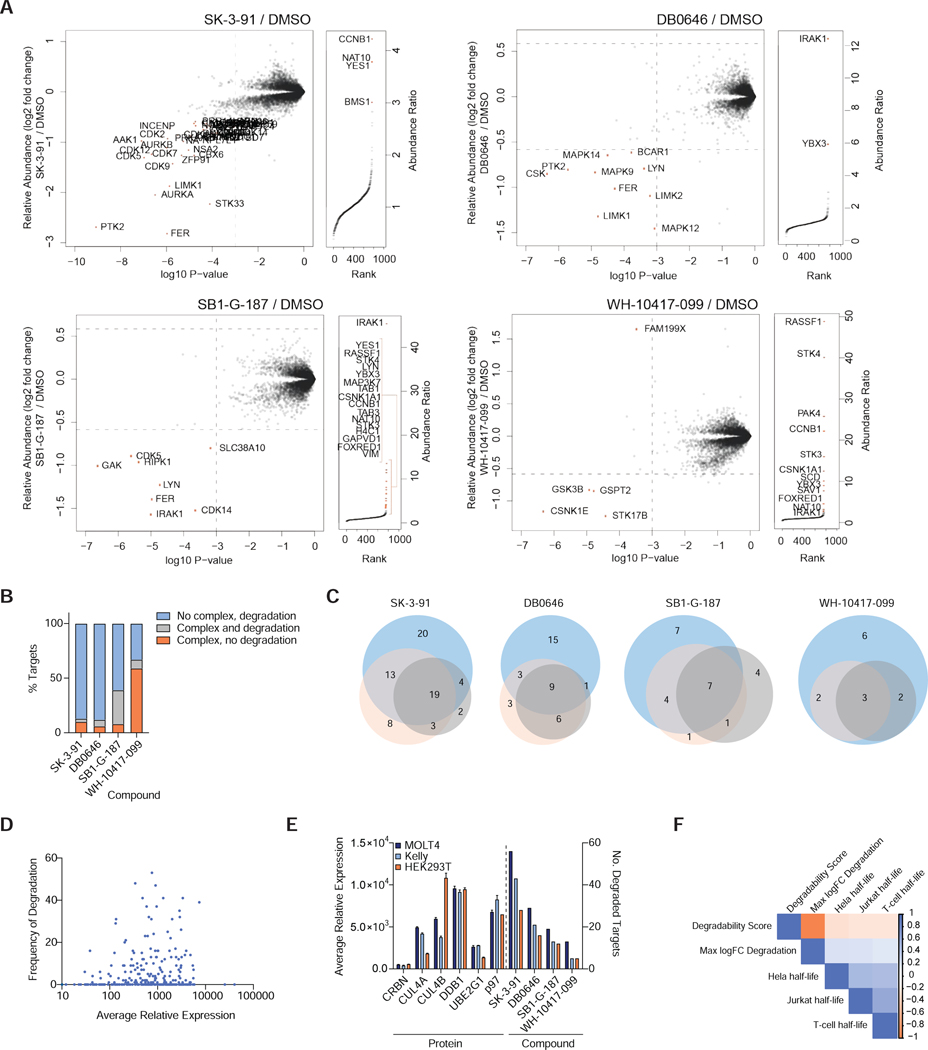
Targeted protein degradation (TPD) refers to the use of small molecules to induce ubiquitin-dependent degradation of proteins. TPD is of interest in drug development, as it can address previously inaccessible targets. However, degrader discovery and optimization remains an inefficient process due to a lack of understanding of the relative importance of the key molecular events required to induce target degradation. Here, we use chemo-proteomics to annotate the degradable kinome. Our expansive dataset provides chemical leads for ∼200 kinases and demonstrates that the current practice of starting from the highest potency binder is an ineffective method for discovering active compounds. We develop multitargeted degraders to answer fundamental questions about the ubiquitin proteasome system, uncovering that kinase degradation is p97 dependent. This work will not only fuel kinase degrader discovery, but also provides a blueprint for evaluating targeted degradation across entire gene families to accelerate understanding of TPD beyond the kinome.

Keywords: E3 ligase; IMiD; PROTAC; degrader; kinase; targeted degradation; ubiquitin; ubiquitin proteasome system.


Conflict of interest statement

Declaration of Interests N.S.G. is a founder, science advisory board (SAB) member, and equity holder in Gatekeeper, Syros, Petra, C4, B2S, Aduro, Jengu, and Soltego (board member). The Gray lab receives or has received research funding from Novartis, Takeda, Astellas, Taiho, Janssen, Kinogen, Voronoi, Her2llc, Deerfield, and Sanofi. E.S.F. is a founder, science advisory board member, and equity holder in Civetta, Jengu (board member), and Neomorph, an equity holder in C4, and a consultant to Astellas, Novartis, Deerfield, and EcoR1. The Fischer lab receives or has received research funding from Novartis, Astellas, and Deerfield. K.A.D., F.M.F., J.W.B., T.S., E.S.F., and N.S.G. are inventors on a patent application relating to this work, owned by DFCI.

Figures

Figure 1 |
Figure 1 |. An Experimental Map of the Degradable Kinome.
(A) Mode of action of targeted protein degraders. (B) Experimental approach taken in this study. (C) Features of the profiled degrader library. Chemical structures reported in Table S1. (D) Kinome tree presenting protein kinases that were significantly downregulated by at least one degrader. Image created using KinMap, illustration reproduced courtesy of Cell Signaling Technology, Inc. (www.cellsignal.com). (E) Proportion of the human protein kinome detected and degraded by proteomics in at least one experiment. Data reported in Table S1, 4. (F) Comparison of degraded kinase targets reported in the literature and in this study. Literature searching was performed in PubMed, using search terms ‘kinase PROTAC’ and ‘kinase degrader’. Data reported in Table S5. (G) The number of independent compound treatments for which degradation was observed for each kinase. Inset, the top 20 most frequently degraded kinases. (H) Comparison of kinase degradability score with PubMed Count and PDB count. (I) Proportion of understudied kinases, lipid kinases and pseudokinases detected and degraded by proteomics in at least one experiment in this study. Data reported in Tables S4. (J) Scatterplot displaying relative fold change in protein abundance following treatment of MOLT-4 cells with 1 μM DD-03–156 for 5 h. Inset, chemical structure of DD-03-156. Data are from n = 1 biologically independent treatment samples. The associated dataset is provided in Table S3-4.
Figure 2 |
Figure 2 |. Degradable Kinome Dataset Accelerates Lead Discovery.
(A) Heatmap comparing relative fold change in protein abundance in response to treatment with indicated degrader (see Table S1 for treatment details and Table S3 for data). Inset, chemical structure of degrader DB-3-291. (B) Scatterplot displaying relative fold change in protein abundance following treatment of MOLT-4 cells with 1 μM DB-3-291 for 5 h. (C) Kinome tree representing the kinase degradability (DK) score calculated for each of the protein kinases degraded in this study. Data reported in Table S8. Image created using KinMap, illustration reproduced courtesy of Cell Signaling Technology, Inc. (www.cellsignal.com). (D) Strategy for conversion of Alisertib into selective AURKA degrader dAURK-4. (E) Scatterplot depicting relative fold change in protein abundance following treatment of MOLT-4 cells with 1 μM dAURK-4 for 5 h. Data in B, E are from n = 1 biologically independent treatment samples. Associated dataset is provided in Table S3. (F) Immunoblot analysis of MM.1S cells treated with the indicated concentration of dAURK-4 for 4 or 24 h. Data in F are representative of n = 2 independent experiments. (G) DMSO-normalized antiproliferation of MM.1S cells treated with Alisertib or dAURK-4. Data are presented as mean ± s.d. of n = 3 biologically independent samples and are representative of n = 2 independent experiments.
Figure 3 |
Figure 3 |. Cellular Target Engagement Does Not Predict Degradation Efficiency.
Multiplexed TMT-based quantitative proteomics workflow used in this study. (B) ABPP-based KiNativ proteomics workflow used for target engagement measurements. (C) AP-MS approach used to enrich for degrader-mediated ternary complexes with CRBN. (D) Chemical structures of the 4 multitargeted degrader probes. (E) Scatterplot comparing kinase engagement (KiNativ, B) with kinase degradation (proteomics, A). KiNativ data are from n = 2 technically independent samples, proteomics analysis data are from n = 1 biologically independent treatment samples. Associated datasets are provided in Table S3, 4, 6. Negative KiNativ values were interpreted as 0% inhibition of binding. (F) Bar chart showing the proportion of degraded kinase targets for which detectable target engagement (TE, > 35% inhibition of binding) and degradation (FC > 1.25, P-value < 0.01) were observed for the 4 compounds tested.
Figure 4 |
Figure 4 |. Effects of ternary complex formation and target protein abundance on degrader efficacy.
(A) Left. Scatterplot depicts relative fold change in protein abundance following treatment of HEK293T cells (See Fig. 3A). Right. Rank order plot showing the ranked relative abundance ratios of enriched proteins in FLAG-CRBN AP-MS experiments from HEK293T cells (see Fig. 3C). Data in scatterplots are from n = 2 biologically independent treatment samples. Data in rank order plots are from n = 3 biologically independent treatment samples. Associated datasets are provided in Tables S3, 7, 6. (B) Bar chart depicting the proportion of targets complexed and degraded by the indicated compounds. (C) Venn diagrams showing number of unique and overlapping kinase hits found for each compound in MOLT-4 (blue), KELLY (orange) and HEK293T (gray) cells. (D) Kinome wide comparison of the degradation frequency and the relative protein abundance in MOLT-4 cells. (E) Bar plot showing the average relative expression the indicated proteins (left) and number of kinases degraded by the indicated degraders (right) in MOLT-4, KELLY and HEK293T cells. Average abundance measurements were derived from n = 2 independent biological samples. Associated datasets are provided in Tables S2. (F) Correlation of kinase degradability score and reported protein half-life in listed cell types.
Figure 5 |
Figure 5 |. Varying the target recruiting ligase can influence degrader selectivity.
(A-C) Chemical structures and scatterplot log2 FC pairwise comparisons from treatment with VHL vs CRBN degrader pairs. Relative fold change in protein abundance measurements were determined from global quantitative proteomics experiments (Fig. 3C). Quantitative proteomics analysis data are from n = 2 biologically independent treatment samples. (D) Venn diagram illustrating the target overlap for the aggregated data in A, for lists see Table S9.
Figure 6 |
Figure 6 |. Protein kinases and IMiD off-target proteins have varied tolerance for subtle changes in linker design.
(A) Chemical structures of the compounds evaluated. (B) Intracellular ligase engagement assay. Data are represented as means ± s.d of n = 3 biologically independent replicates. (C, D) Heatmap showing log2 FC of (C) kinases, (D) known IMiD targets determined to be hits (FC >1.25 and P-value <0.01) following a 5 h treatment of MOLT-4 cells with 0.1 μM of the indicated compounds. (E) Split bar plot showing the number of CRBN-recruiting degraders found to hit at least one known IMiD off-target compared to the number that do not hit IMiD off-targets. CRBN-recruiting degraders are categorized according their linker attachment chemistry. Associated dataset is provided in Table S10.
Figure 7 |
Figure 7 |. Proteasomal degradation of most kinases is p97 dependent.
(A) Scatterplots depicting the fold change in relative abundance following a 5 h treatment of MOLT-4 cells with 1 μM of the indicated compounds with (blue) and without (orange) co-treatment with 5 μM of p97 inhibitor CB-5083. Relative expression data are derived from n = 2 biologically independent treatment. Datasets are provided in Table S3. (B) Bar chart comparing the relative protein abundance of the top 5 degraded kinases from each of the indicated treatments in A. Bars indicate relative protein expression in response to inhibition of p97 with 5 μM of CB-5083, over a time course experiment in MOLT-4 cells. Relative expression data are represented as mean ± s.d. of from n = 2 biologically independent treatment. (C) Chemical structures of GNF7-based kinase degraders utilizing either a CRBN, VHL or IAP binding moiety. (D) As in A but for compounds indicated in C. (A-D) Datasets are provided in Table S3.

References

    1. Backus KM, Correia BE, Lum KM, Forli S, Horning BD, González-Páez GE, Chatterjee S, Lanning BR, Teijaro JR, and Olson AJ (2016). Proteome-wide covalent ligand discovery in native biological systems. Nature 534, 570–574. - PMC - PubMed
    1. Becher I, Andrés-Pons A, Romanov N, Stein F, Schramm M, Baudin F, Helm D, Kurzawa N, Mateus A, and Mackmull M-T (2018). Pervasive protein thermal stability variation during the cell cycle. Cell 173, 1495–1507. e1418. - PMC - PubMed
    1. Bingqi T, Mai L, Yi X, Jessica S, John A, Jeffrey M,M, Markus S, Thomas J,M, and Daniel N. (2020). Targeted Protein Degradation via a Covalent Reversible Degrader Based on Bardoxolone. ChemRxiv.
    1. Bondeson DP, and Crews CM (2017). Targeted protein degradation by small molecules. Annu Rev Pharmacol Toxicol 57, 107–123. - PMC - PubMed
    1. Bondeson DP, Mares A, Smith IE, Ko E, Campos S, Miah AH, Mulholland KE, Routly N, Buckley DL, and Gustafson JL (2015). Catalytic in vivo protein knockdown by small-molecule PROTACs. Nat Chem Biol 11, 611. - PMC - PubMed

Publication types