

Trends in prevalence of blindness and distance and near vision impairment over 30 years: an analysis for the Global Burden of Disease Study
- PMID: 33275950
- PMCID: PMC7820390
- DOI: 10.1016/S2214-109X(20)30425-3
Trends in prevalence of blindness and distance and near vision impairment over 30 years: an analysis for the Global Burden of Disease Study
Abstract
Background: To contribute to the WHO initiative, VISION 2020: The Right to Sight, an assessment of global vision impairment in 2020 and temporal change is needed. We aimed to extensively update estimates of global vision loss burden, presenting estimates for 2020, temporal change over three decades between 1990-2020, and forecasts for 2050.
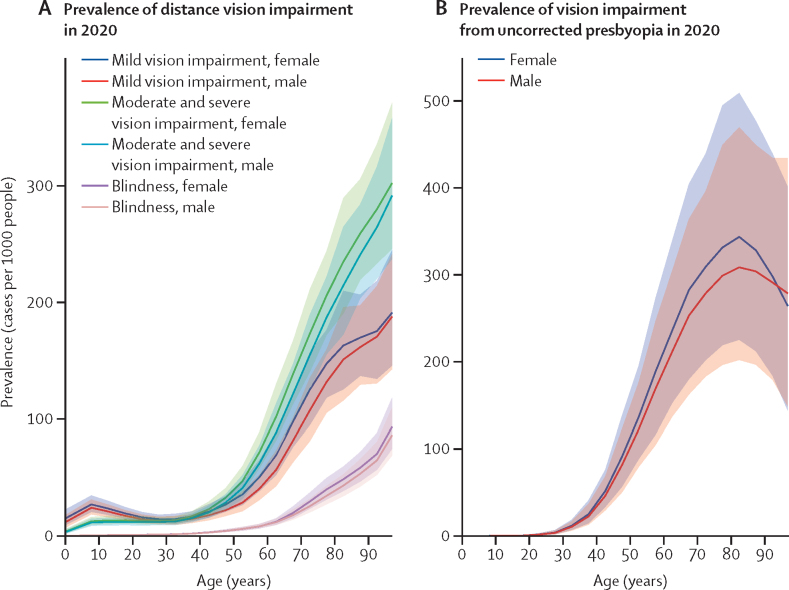
Methods: We did a systematic review and meta-analysis of population-based surveys of eye disease from January, 1980, to October, 2018. Only studies with samples representative of the population and with clearly defined visual acuity testing protocols were included. We fitted hierarchical models to estimate 2020 prevalence (with 95% uncertainty intervals [UIs]) of mild vision impairment (presenting visual acuity ≥6/18 and <6/12), moderate and severe vision impairment (<6/18 to 3/60), and blindness (<3/60 or less than 10° visual field around central fixation); and vision impairment from uncorrected presbyopia (presenting near vision <N6 or <N8 at 40 cm where best-corrected distance visual acuity is ≥6/12). We forecast estimates of vision loss up to 2050.
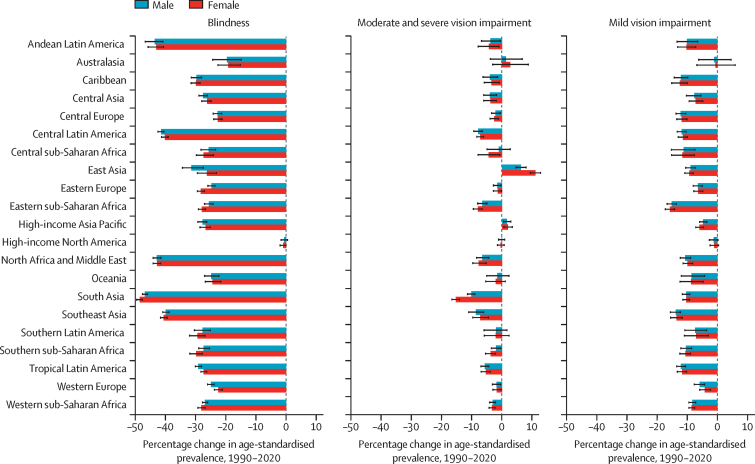
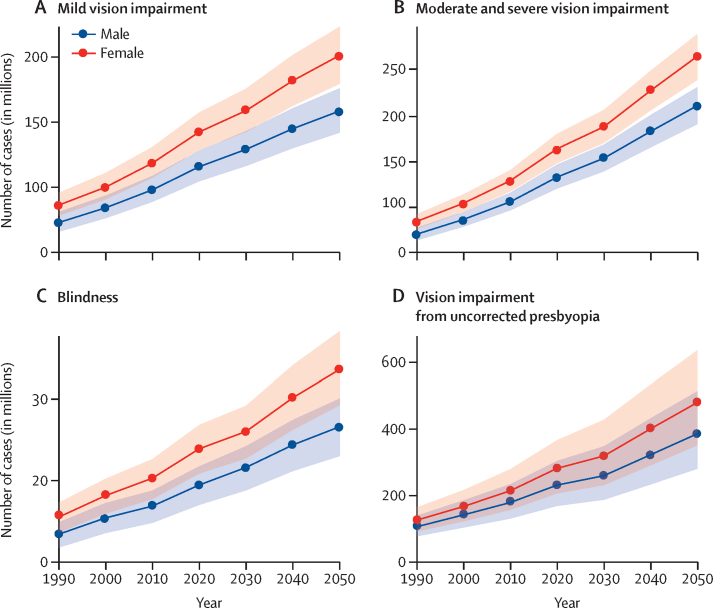
Findings: In 2020, an estimated 43·3 million (95% UI 37·6-48·4) people were blind, of whom 23·9 million (55%; 20·8-26·8) were estimated to be female. We estimated 295 million (267-325) people to have moderate and severe vision impairment, of whom 163 million (55%; 147-179) were female; 258 million (233-285) to have mild vision impairment, of whom 142 million (55%; 128-157) were female; and 510 million (371-667) to have visual impairment from uncorrected presbyopia, of whom 280 million (55%; 205-365) were female. Globally, between 1990 and 2020, among adults aged 50 years or older, age-standardised prevalence of blindness decreased by 28·5% (-29·4 to -27·7) and prevalence of mild vision impairment decreased slightly (-0·3%, -0·8 to -0·2), whereas prevalence of moderate and severe vision impairment increased slightly (2·5%, 1·9 to 3·2; insufficient data were available to calculate this statistic for vision impairment from uncorrected presbyopia). In this period, the number of people who were blind increased by 50·6% (47·8 to 53·4) and the number with moderate and severe vision impairment increased by 91·7% (87·6 to 95·8). By 2050, we predict 61·0 million (52·9 to 69·3) people will be blind, 474 million (428 to 518) will have moderate and severe vision impairment, 360 million (322 to 400) will have mild vision impairment, and 866 million (629 to 1150) will have uncorrected presbyopia.
Interpretation: Age-adjusted prevalence of blindness has reduced over the past three decades, yet due to population growth, progress is not keeping pace with needs. We face enormous challenges in avoiding vision impairment as the global population grows and ages.
Funding: Brien Holden Vision Institute, Fondation Thea, Fred Hollows Foundation, Bill & Melinda Gates Foundation, Lions Clubs International Foundation, Sightsavers International, and University of Heidelberg.
Copyright © 2021 The Author(s). Published by Elsevier Ltd. This is an Open Access article under the CC BY 4.0 license. Published by Elsevier Ltd.. All rights reserved.
Figures
Comment in
-
Rising to the challenge: estimates of the magnitude and causes of vision impairment and blindness.Lancet Glob Health. 2021 Feb;9(2):e100-e101. doi: 10.1016/S2214-109X(21)00008-5. Lancet Glob Health. 2021. PMID: 33482137 Free PMC article. No abstract available.
References
-
- Pizzarello L, Abiose A, Ffytche T. VISION 2020: the right to sight: a global initiative to eliminate avoidable blindness. Arch Ophthalmol. 2004;122:615–620. - PubMed
-
- WHO . World Health Organization, April 28; Geneva: 2003. Resolution of the World Health Assembly: elimination of avoidable blindness.https://apps.who.int/gb/archive/pdf_files/WHA56/ea5626.pdf
-
- WHO . World Heath Organization; Geneva: 2013. Universal eye health: a global action plan 2014–2019.https://www.who.int/blindness/actionplan/en/
-
- Bourne RRA, Flaxman SR, Braithwaite T. Magnitude, temporal trends, and projections of the global prevalence of blindness and distance and near vision impairment: a systematic review and meta-analysis. Lancet Glob Health. 2017;5:e888–e897. - PubMed
-
- WHO . World Health Organization; Geneva: Oct 8, 2019. World report on vision.https://www.who.int/publications-detail/world-report-on-vision
Publication types
MeSH terms
Grants and funding
LinkOut - more resources
Full Text Sources
Other Literature Sources
Medical
Miscellaneous
