. 2021 May;74(5):1145-1154.
doi: 10.1016/j.jhep.2020.11.037. Epub 2020 Dec 1.

CD40-mediated immune cell activation enhances response to anti-PD-1 in murine intrahepatic cholangiocarcinoma

Affiliations

CD40-mediated immune cell activation enhances response to anti-PD-1 in murine intrahepatic cholangiocarcinoma

Laurence P Diggs et al. J Hepatol. 2021 May.

Abstract

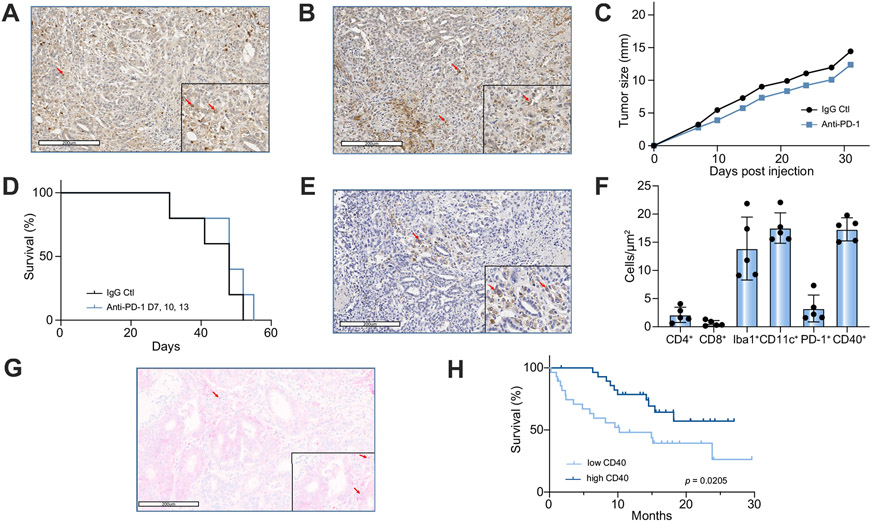
Background & aims: While cholangiocarcinomas (CCAs) commonly express programmed cell death 1 (PD-1) and its ligand (PD-L1), they respond poorly to immune checkpoint inhibitors (ICIs). We aimed to determine whether stimulating antigen-presenting cells, including macrophages and dendritic cells, using a CD40 agonist could improve this response.

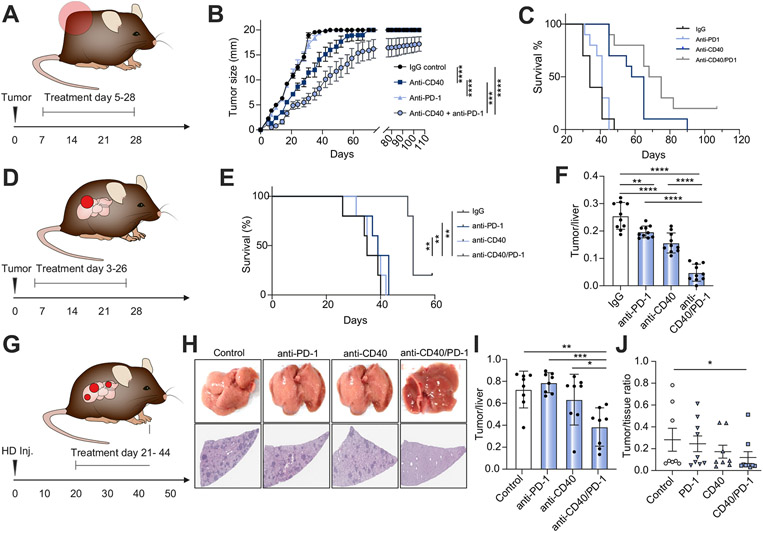
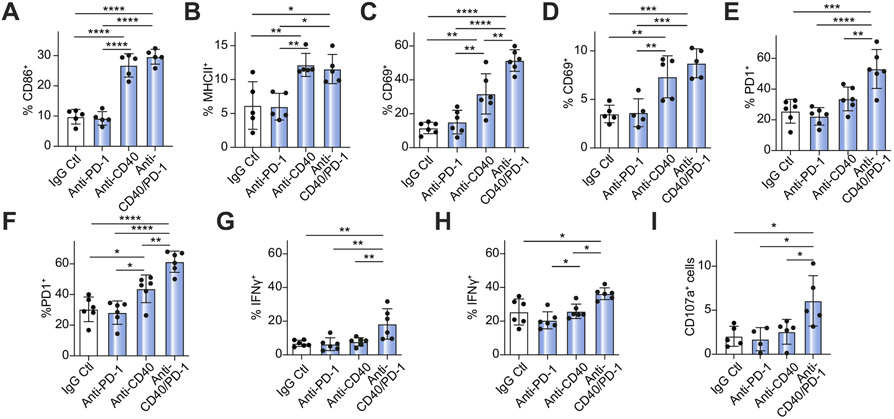
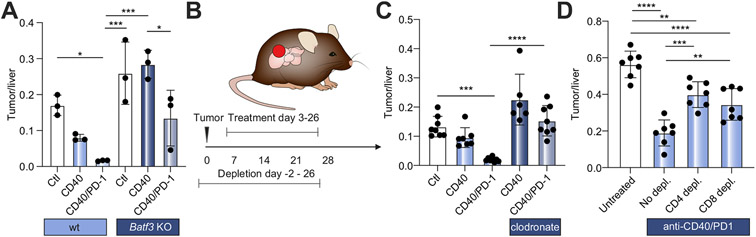
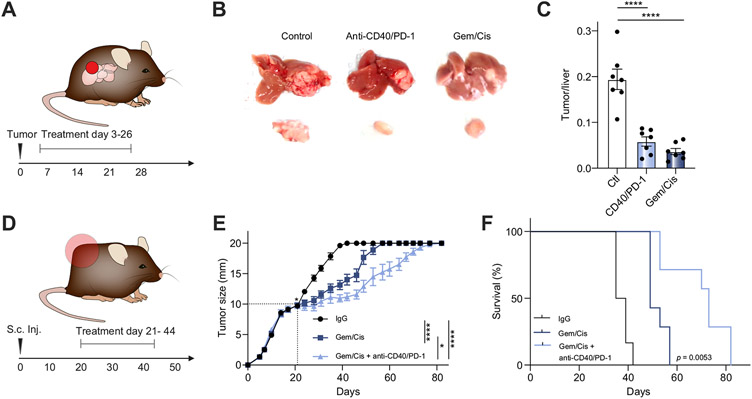
Methods: We compared treatment responses in subcutaneous, orthotopic, and 2 plasmid-based murine intrahepatic CCA (iCCA) models. Mice were treated for 4 weeks with weekly IgG control, a CD40 agonistic antibody, anti-PD-1, or the combination of both (anti-CD40/PD-1). Flow cytometric (FACS) analysis of lymphocytes and myeloid cell populations (including activation status) was performed. We used dendritic cell knockout mice, and macrophage, CD4+ and CD8+ T cell depletion models to identify effector cells. Anti-CD40/PD-1 was combined with chemotherapy (gemcitabine/cisplatin) to test for improved therapeutic efficacy.

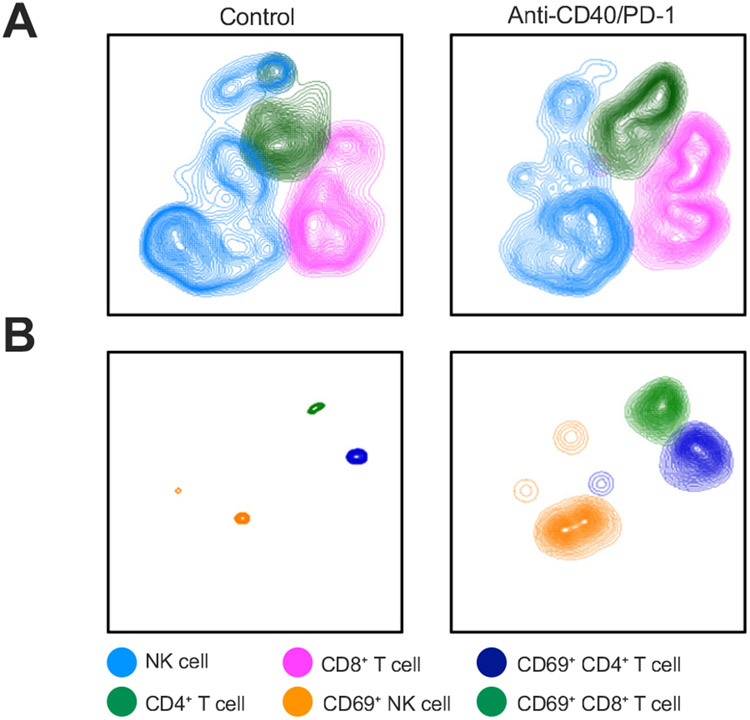
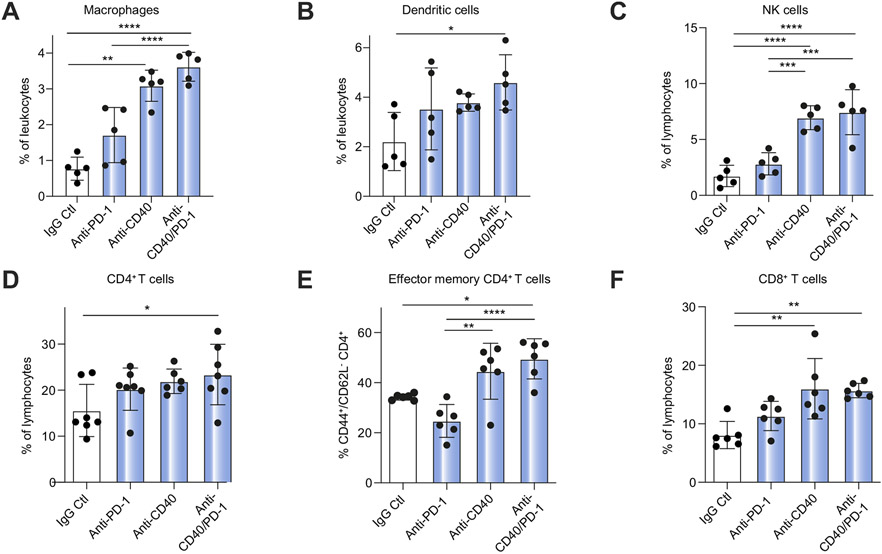
Results: In all 4 models, anti-PD-1 alone was minimally efficacious. Mice exhibited a moderate response to CD40 agonist monotherapy. Combination anti-CD40/PD-1 therapy led to a significantly greater reduction in tumor burden. FACS demonstrated increased number and activation of CD4+ and CD8+ T cells, natural killer cells, and myeloid cells in tumor and non-tumor liver tissue of tumor-bearing mice treated with anti-CD40/PD-1. Depletion of macrophages, dendritic cells, CD4+ T cells, or CD8+ T cells abrogated treatment efficacy. Combining anti-CD40/PD-1 with gemcitabine/cisplatin resulted in a significant survival benefit compared to gemcitabine/cisplatin alone.

Conclusion: CD40-mediated activation of macrophages and dendritic cells in iCCA significantly enhances response to anti-PD-1 therapy. This regimen may enhance the efficacy of first-line chemotherapy.

Lay summary: Checkpoint inhibition, a common form of immune therapy, is generally ineffective for the treatment of cholangiocarcinoma. These tumors suppress the infiltration and function of surrounding immune cells. Stimulating immune cells such as macrophages and dendritic cells via the CD40 receptor activates downstream immune cells and enhances the response to checkpoint inhibitors.

Keywords: Antigen-presenting cell; CD40 agonist; Cholangiocarcinoma; Dendritic cell; Immune checkpoint; Immunotherapy; Liver cancer; Macrophage; NK cell; T cell; Tumor-infiltrating lymphocyte.


Conflict of interest statement

Conflict of interest The authors declare no conflicts of interest that pertain to this work. Please refer to the accompanying ICMJE disclosure forms for further details.

Figures

Fig. 1.
Fig. 1.. PD-1 and CD40 in murine and human CCA.
IHC staining for (A) PD-1 and (B) PD-L1 (arrow) in tumor and adjacent liver of SB1 orthotopic CCA tumor-bearing mouse. (C) Tumor growth and (D) Kaplan-Meier curves for subcutaneous SB1 CCA tumor-bearing C57BL/6 mice treated with anti-PD-1 (n = 5 per group). IHC stain for CD40 (arrow) in (E) murine orthotopic CCA. (F) Halo quantification of IHC staining for CD4, CD8, Iba1 (macrophages), CD11c (DCs), PD-1, and CD40 in murine orthotopic CCA samples (n = 5). (G) IHC stain for CD40 (arrow) in human CCA. (H) Kaplan-Meier curves of patients with high (n = 29) vs. low (n = 28) expression of CD40 in their CCA tumor samples. Log-rank (Mantel-Cox) test. CCA, cholangiocarcinoma; IHC, immunohistochemistry; PD-1, programmed cell death 1; PD-L1, programmed cell death ligand 1.
Fig. 2.
Fig. 2.. Response to anti-PD-1, anti-CD40, and anti-CD40+anti-PD-1 (anti-CD40/PD-1) in 4 different intrahepatic CCA mouse models.
(A) Experimental set-up for subcutaneous tumor model (B) Flank tumor measurements over time (days) for subcutaneous SB1 CCA tumor-bearing C57BL/6 mice (n = 10 per group, mice with tumors >20 mm were euthanized, but continued to be reported as 20 mm) (C) corresponding survival analysis (n = 10 per group). (D) Experimental set-up for orthotopic tumor model using SB1 tumor cells. (E) Survival analysis (n = 5 per group, one animal in the combination group was censored at d59) and (F) analysis of tumor to liver ratios 28 days post tumor cell injection (n = 10 per group). (G) Experimental set-up for AKT-YAP and AKT-NOTCH induced tumor model (H) Representative livers (top) and H&E stains (bottom) of livers from YAP+AKT HD inj. CCA tumor-bearing C57BL/6 mice (n = 8 per group) (I) and analysis of tumor to liver ratios 49 days post plasmid injection (n = 8 per group). (J) Analysis of tumor to tissue ratios in AKT-NICD injected mice (n = 8-9 per group). (one-way ANOVA for F & I, student’s t test for J and Log-rank (Mantel-Cox) test for C&E. *p<0.05; **p<0.01; ***p<0.001; ****p<0.0001). CCA, cholangiocarcinoma; HD, hydrodynamic; PD-1, programmed cell death 1; PD-L1, programmed cell death ligand 1.
Fig. 3.
Fig. 3.. Flowcytometry analysis of immune cell populations in TILs from orthotopic SB1 CCA tumor-bearing mice treated with anti-PD-1, anti-CD40, or anti-CD40+anti-PD-1 (anti-CD40/PD-1).
(A) t-SNE plots comparing CD4+ T, CD8+ T, and NK (CD3/NK1.1+) cell frequency in control vs. anti-CD40/PD-1. (B) t-SNE plots comparing frequency of CD4+ T, CD8+ T, and NK (CD3/NK1.1+) cells positive for CD69 in control vs. anti-CD40/PD-1. (n = 4 for IgG control group and n = 5 per group for other groups). NK, natural killer; PD-1, programmed cell death 1; PD-L1, programmed cell death ligand 1; TILs, tumor-infiltrating lymphocytes; t-SNE, t-distributed stochastic neighbor embedding.
Fig. 4.
Fig. 4.. Flow cytometry analysis of immune cell populations among hepatic lymphocytes of tumor-bearing mice treated with anti-PD-1, anti-CD40, or anti-CD40/PD-1.
Frequency of (A) macrophages (CD11b+/F4/80+), (B) DCs (CD11C+), (C) NK cells, (D) CD4+ T cells, (E) effector memory (CD44+/CD62L/CD4+) T cells, and (F) CD8+ T cells (n = 6 per group for CD4, effector memory, and CD8 cell analysis. n = 5 per group for macrophage, DC and NK analysis). (one-way ANOVA, *p<0.05; **p<0.01; ***p<0.001; ****p<0.0001). DC, dendritic cell; NK, natural killer; PD-1, programmed cell death 1; PD-L1, programmed cell death ligand 1.
Fig. 5.
Fig. 5.. Flow cytometry analysis of immune cell activation among hepatic lymphocytes of tumor-bearing mice treated with anti-PD-1, anti-CD40, or anti-CD40/PD-1.
Frequency of (A) CD86+ macrophages (CD11b+/F4/80+), (B) MHCII+ DCs (CD11C+), (C) CD69+ CD8+ T cells (D) CD69+ NK (CD3/NK1.1+) cells (E) PD-1+ CD8+ T cells (F) PD-1+ CD4+ T cells (G) IFN-γ+CD8+ T cells and (H) IFN-γ+CD4+ T cells (n = 5-7 animals per group) (I) CD107+CD8+ T cells after in vitro stimulation with tumor cells in response to anti-PD-1, anti-CD40 and anti-CD40/PD-1 treatment (n = 5 per group). (one-way ANOVA, *p<0.05; **p<0.01; ***p<0.001; ****p<0.0001). DC, dendritic cell; IFN, interferon; NK, natural killer; PD-1, programmed cell death 1; PD-L1, programmed cell death ligand 1.
Fig. 6.
Fig. 6.. Effects of dendritic cell, macrophage, CD4 T cell, and CD8 T cell depletion on effectiveness of combination anti-CD40/PD-1 treatment.
(A) SB1 tumor-bearing Batf3 KO and wild-type controls were treated with anti-CD40 or anti-CD40/PD-1 and tumor to liver ratios were determined 28 days post tumor cell injection (n = 3 per group). (B) Experimental set-up for depletion experiments shown in (C) and (D): Orthotopic SB1 tumor-bearing C57BL/6 mice received anti-CD40/PD-1 between day 3 and 26 and were sacrificed on day 28. Cell depletion was started 2 days prior to orthotopic tumor implantation. (C) Tumor to liver ratios for mice after depletion of macrophages (n = 6-8 animals per group) (D) Tumor to liver ratios for mice after depletion of CD4+ and CD8+ T cells (n = 7 per group) vs. IgG control (one-way ANOVA, *p<0.05; **p<0.01; ***p<0.001; ****p<0.0001). KO, knockout; PD-1, programmed cell death 1.
Fig. 7.
Fig. 7.. Efficacy of anti-CD40/PD-1 compared to and combined with standard of care chemotherapy (Gem/Cis).
(A) Experimental set-up for B+C. (B) Representative livers (top) and tumors (tumors) for orthotopic SB1 tumor-bearing C57BL/6 mice treated with weekly anti-CD40/PD-1 vs. Gem/Cis (n = 6 per group) and sacrificed 28 days post tumor cell injection. (C)Tumor to liver ratios for mice described in (A). (D) Experimental set-up for E+F (E) Tumor measurement over time for subcutaneous SB1 tumor-bearing mice treated once tumors ≥10 mm with Gem/Cis vs. Gem/Cis + anti-CD40/PD-1 (n = 7 animals per group, mice with tumors >20 mm were euthanized, but continued to be reported as 20 mm). (F) Kaplan-Meier curves comparing survival of mice described in (D). (one-way ANOVA, *p<0.05; ****p<0.0001). Gem/Cis, gemcitabine and cisplatin; PD-1, programmed cell death 1.

Comment in

Similar articles

Cited by

References

    1. Rizvi S, Khan SA, Hallemeier CL, Kelley RK, Gores GJ. Cholangiocarcinoma - evolving concepts and therapeutic strategies. Nat Rev Clin Oncol 2018;15:95–111. - PMC - PubMed
    1. Razumilava N, Gores GJ. Cholangiocarcinoma. Lancet 2014;383:2168–2179. - PMC - PubMed
    1. Nakanuma Y, Sato Y, Harada K, Sasaki M, Xu J, Ikeda H. Pathological classification of intrahepatic cholangiocarcinoma based on a new concept. World J Hepatol 2010;2:419–427. - PMC - PubMed
    1. Mertens JC, Rizvi S, Gores GJ. Targeting cholangiocarcinoma. Biochim Biophys Acta Mol Basis Dis 2018;1864:1454–1460. - PMC - PubMed
    1. Valle J, Wasan H, Palmer DH, Cunningham D, Anthoney A, Maraveyas A, et al. Cisplatin plus gemcitabine versus gemcitabine for biliary tract cancer. The New Engl J Med 2010;362:1273–1281. - PubMed

Publication types

MeSH terms