. 2021 Feb;590(7847):630-634.
doi: 10.1038/s41586-020-03041-6. Epub 2020 Dec 4.

Correlates of protection against SARS-CoV-2 in rhesus macaques

Affiliations

Correlates of protection against SARS-CoV-2 in rhesus macaques

Katherine McMahan et al. Nature. 2021 Feb.

Abstract

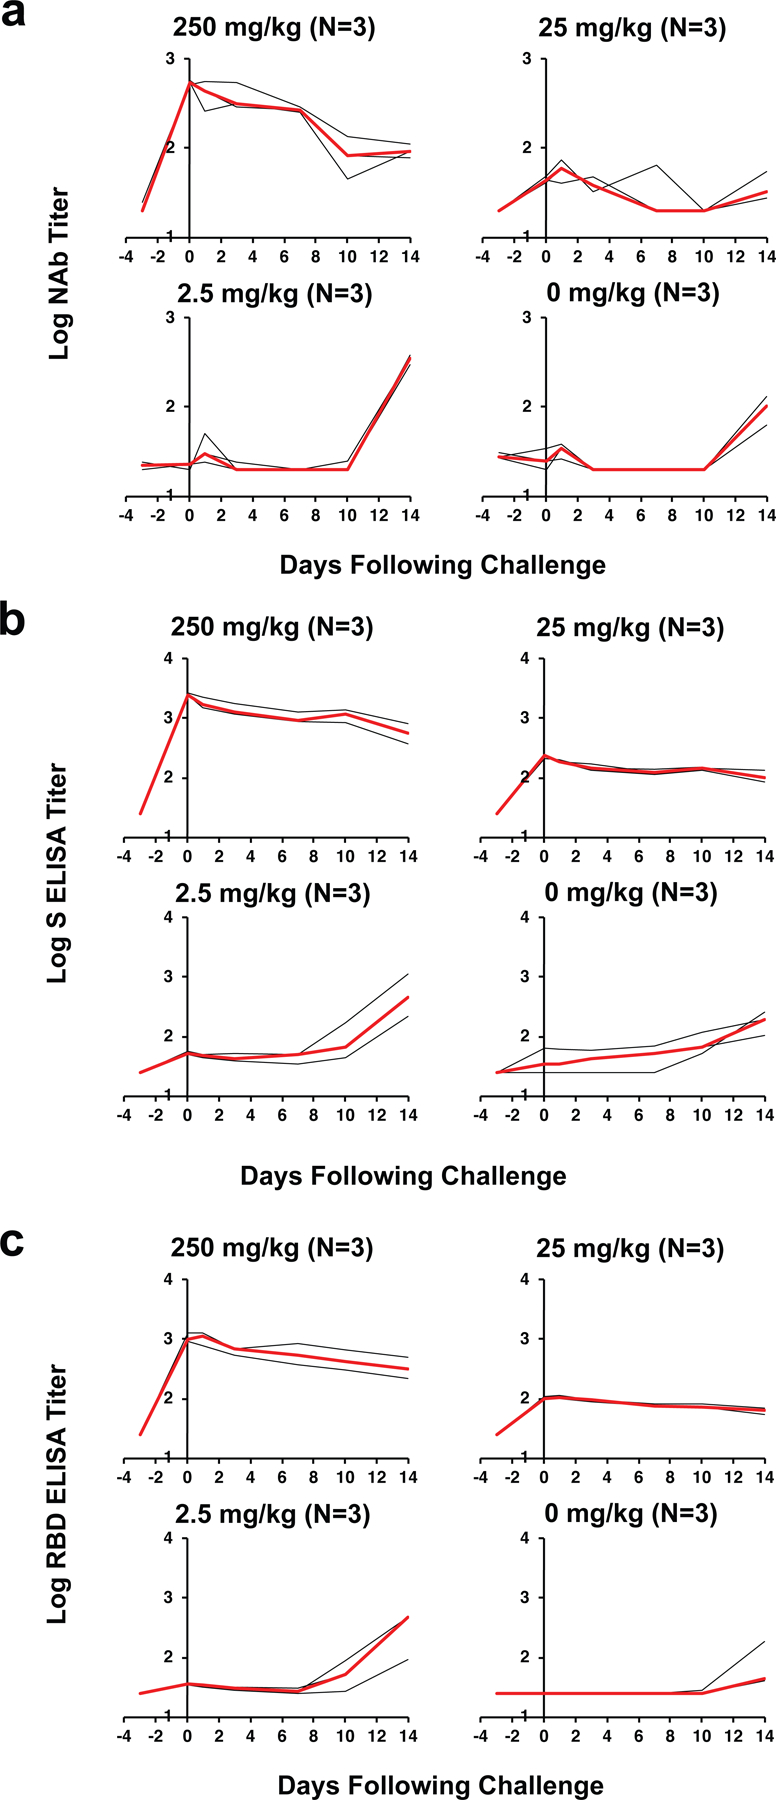
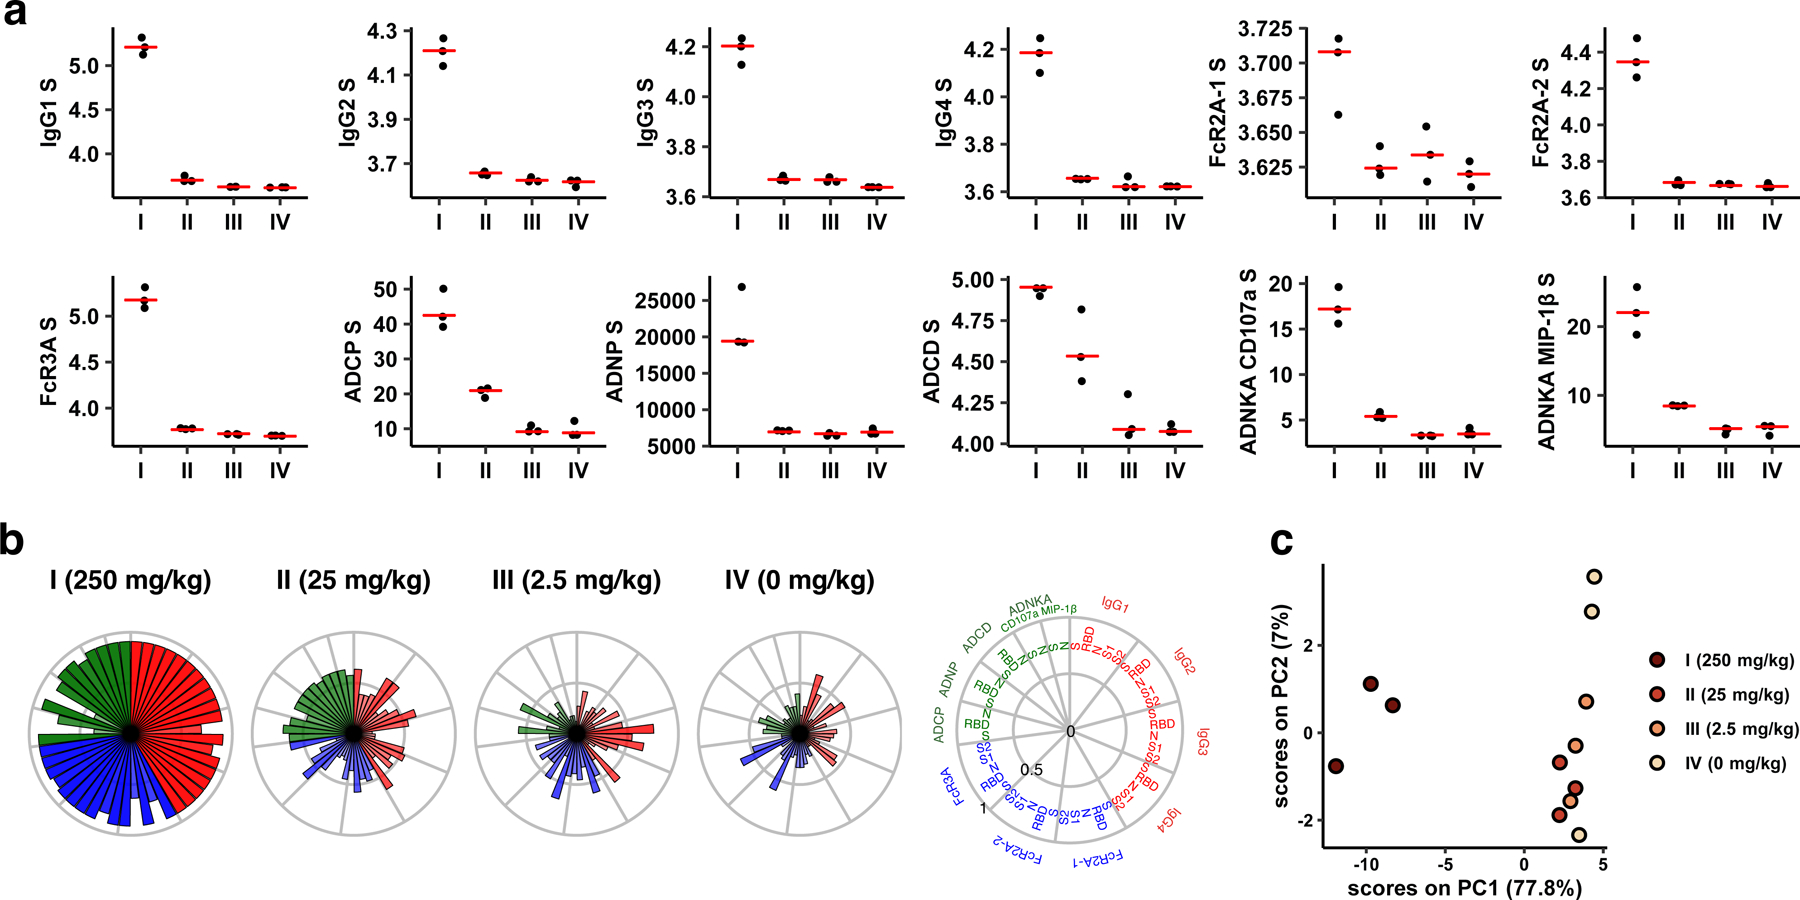
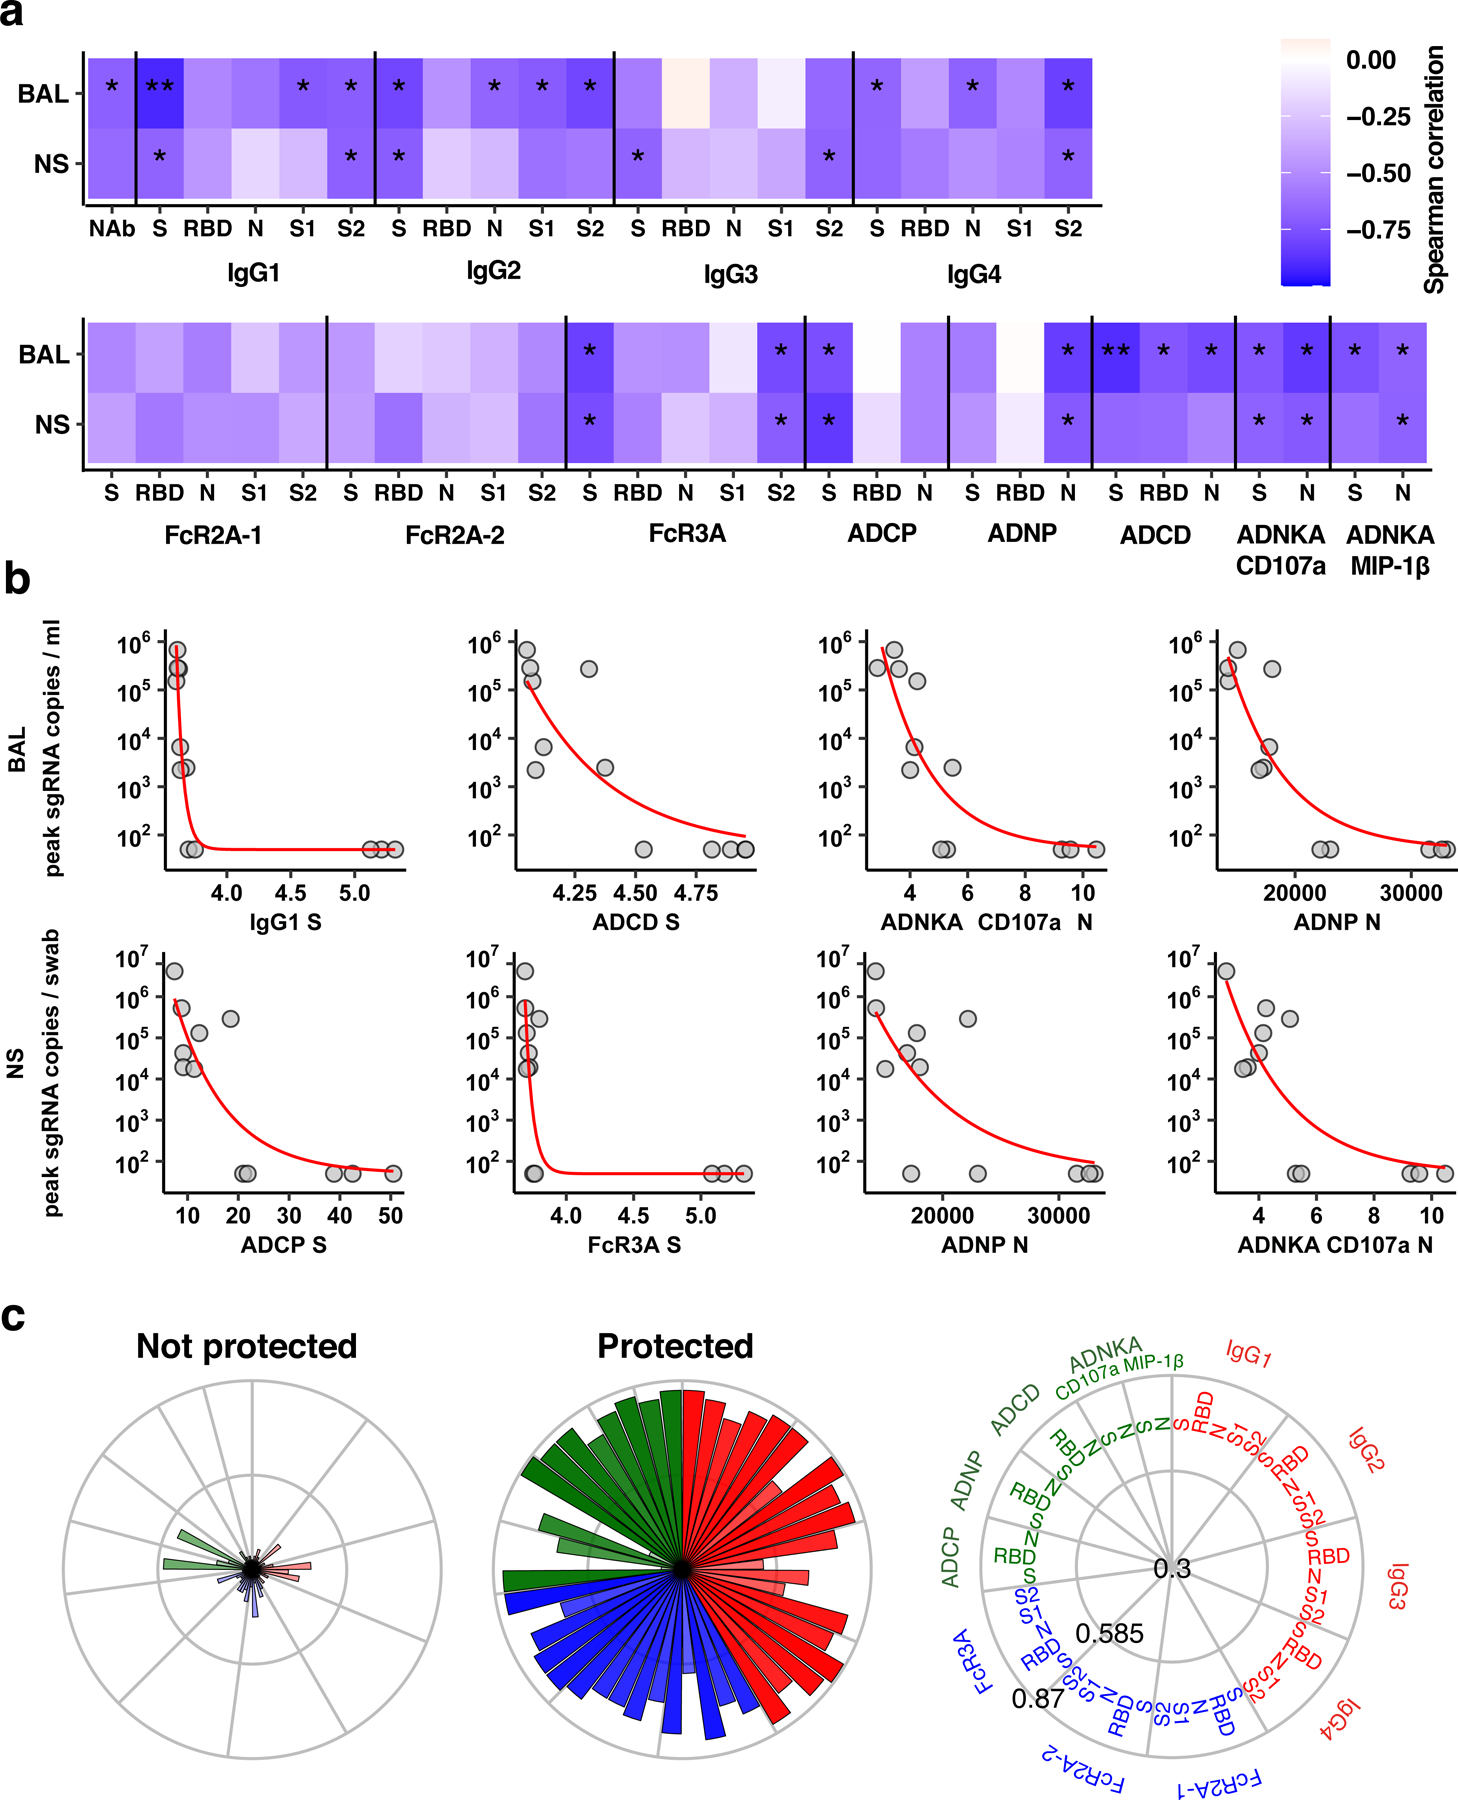
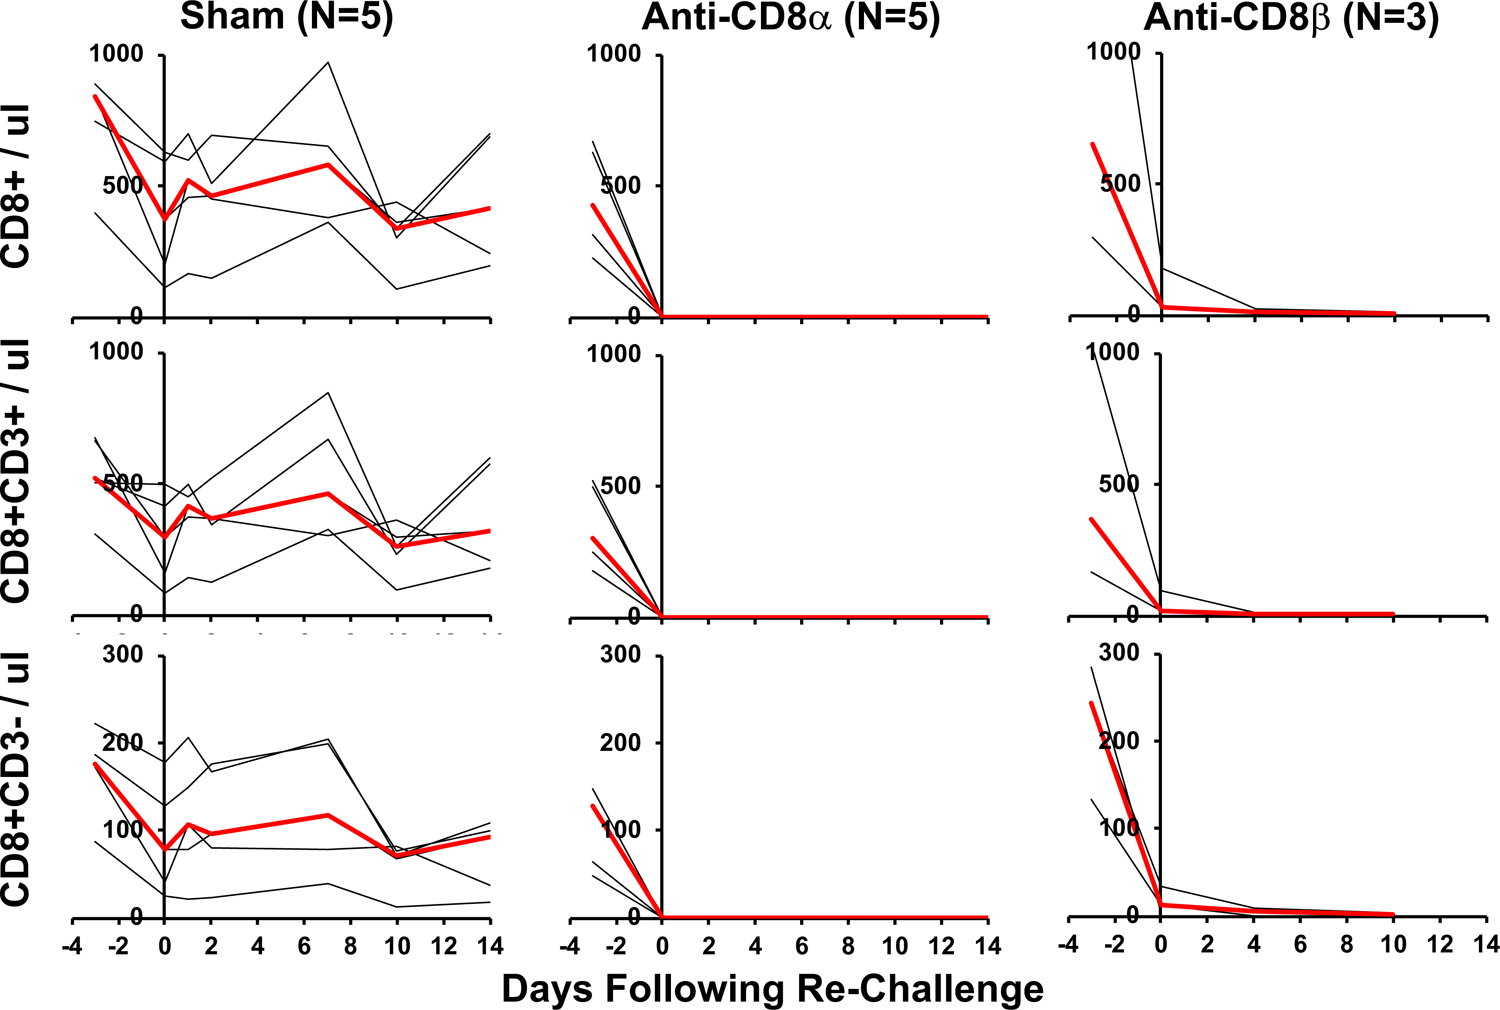
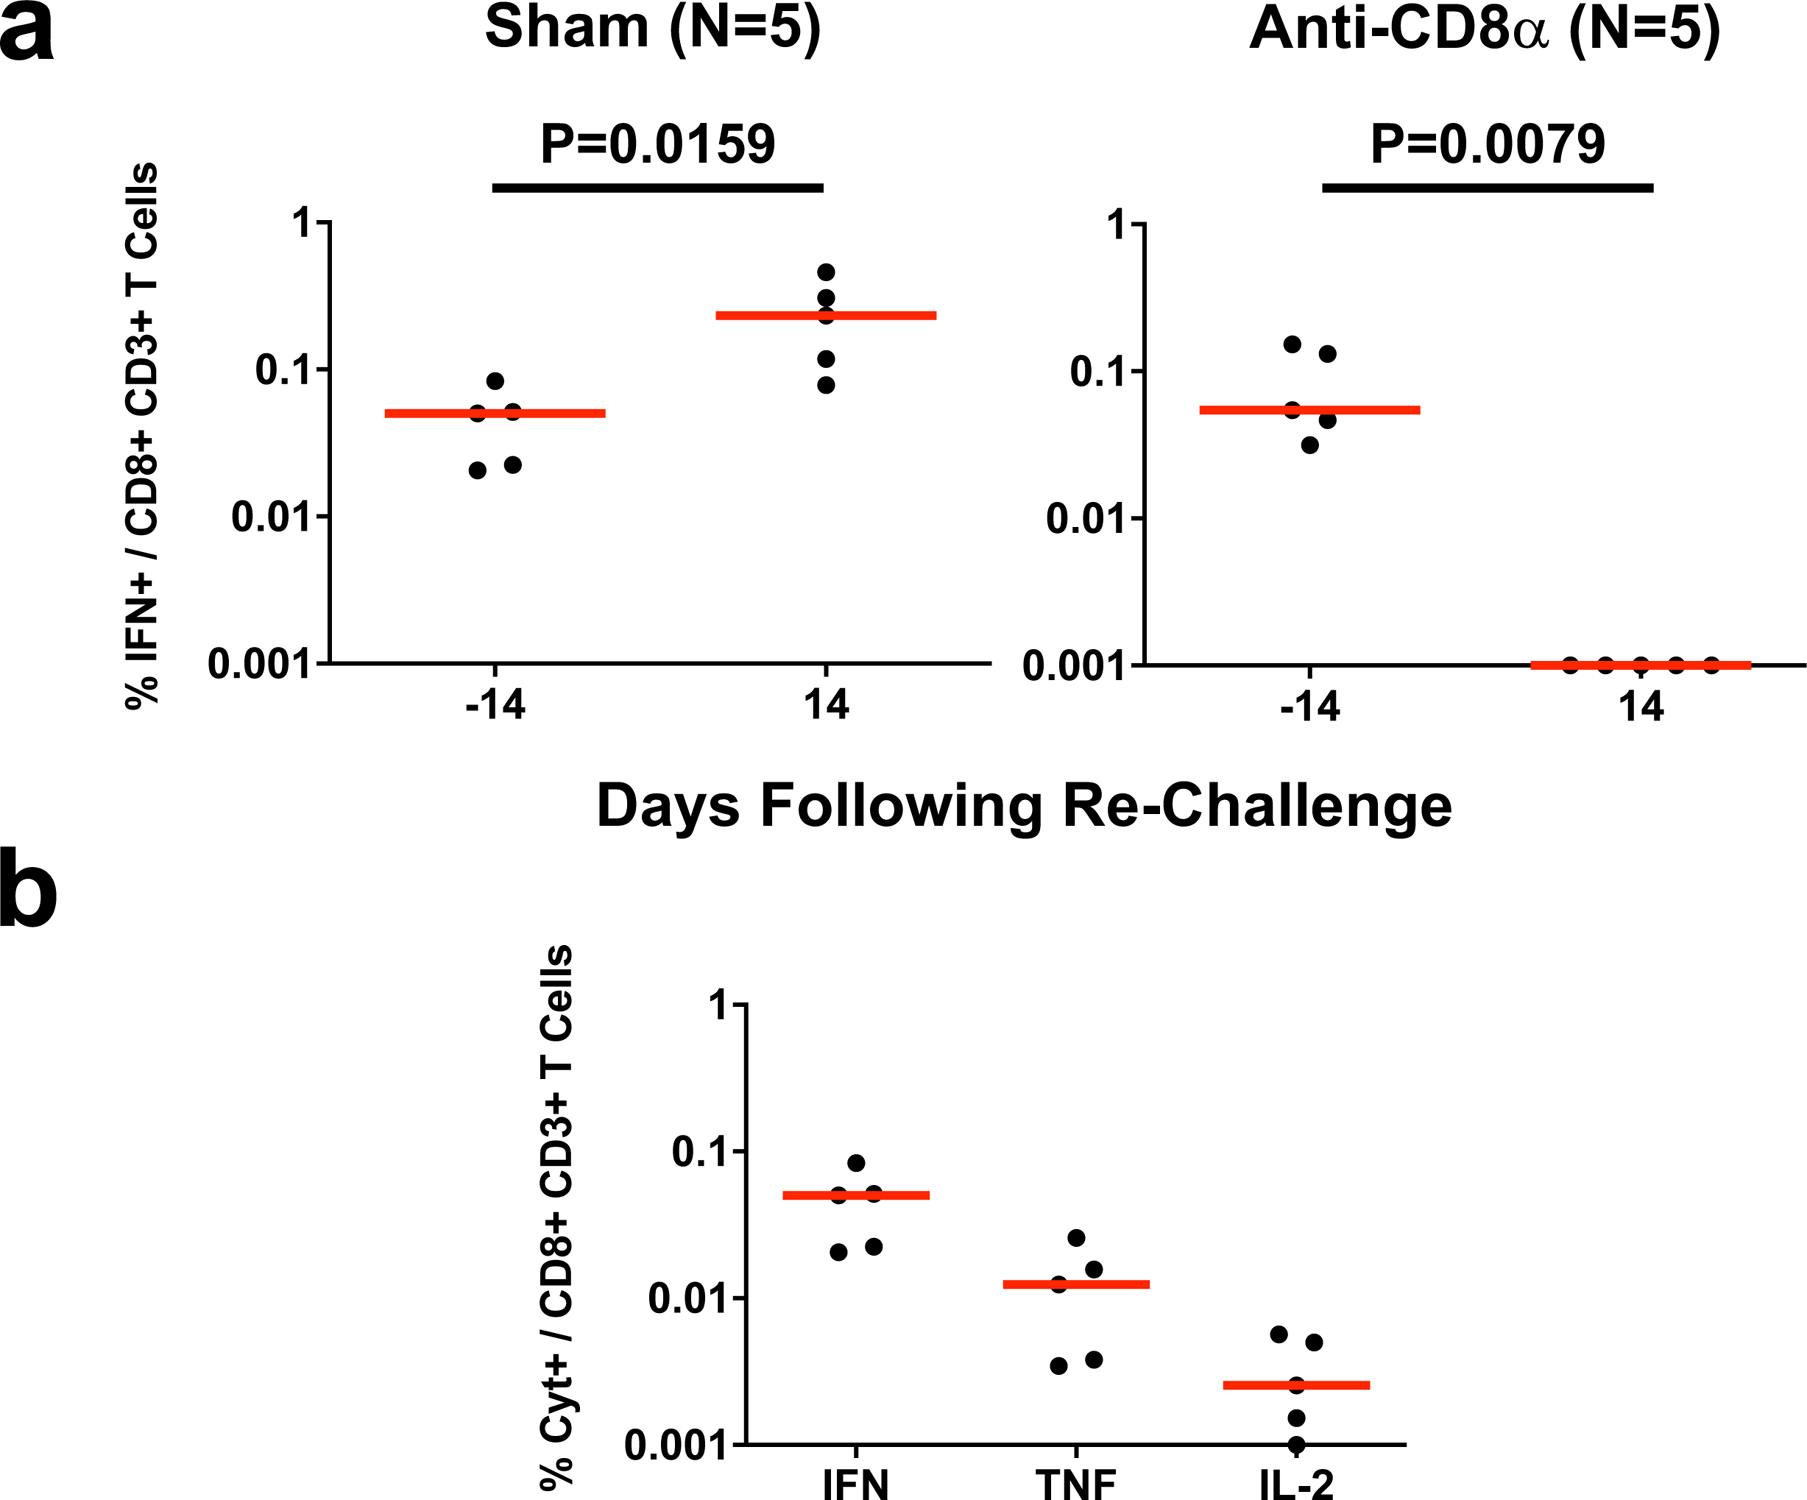
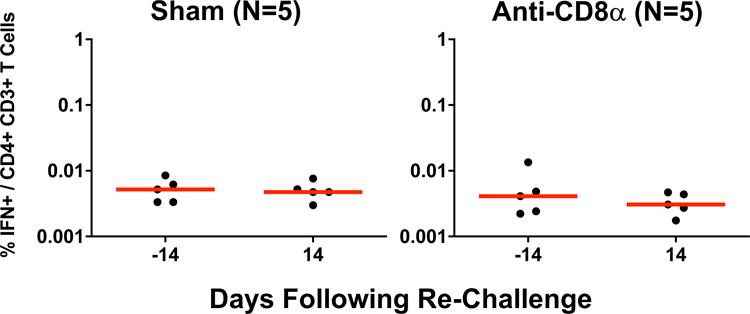
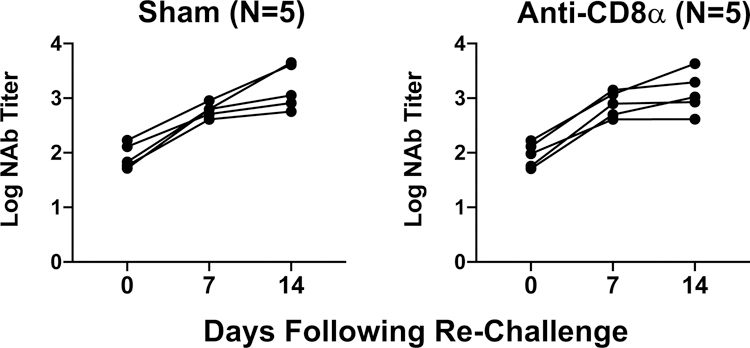
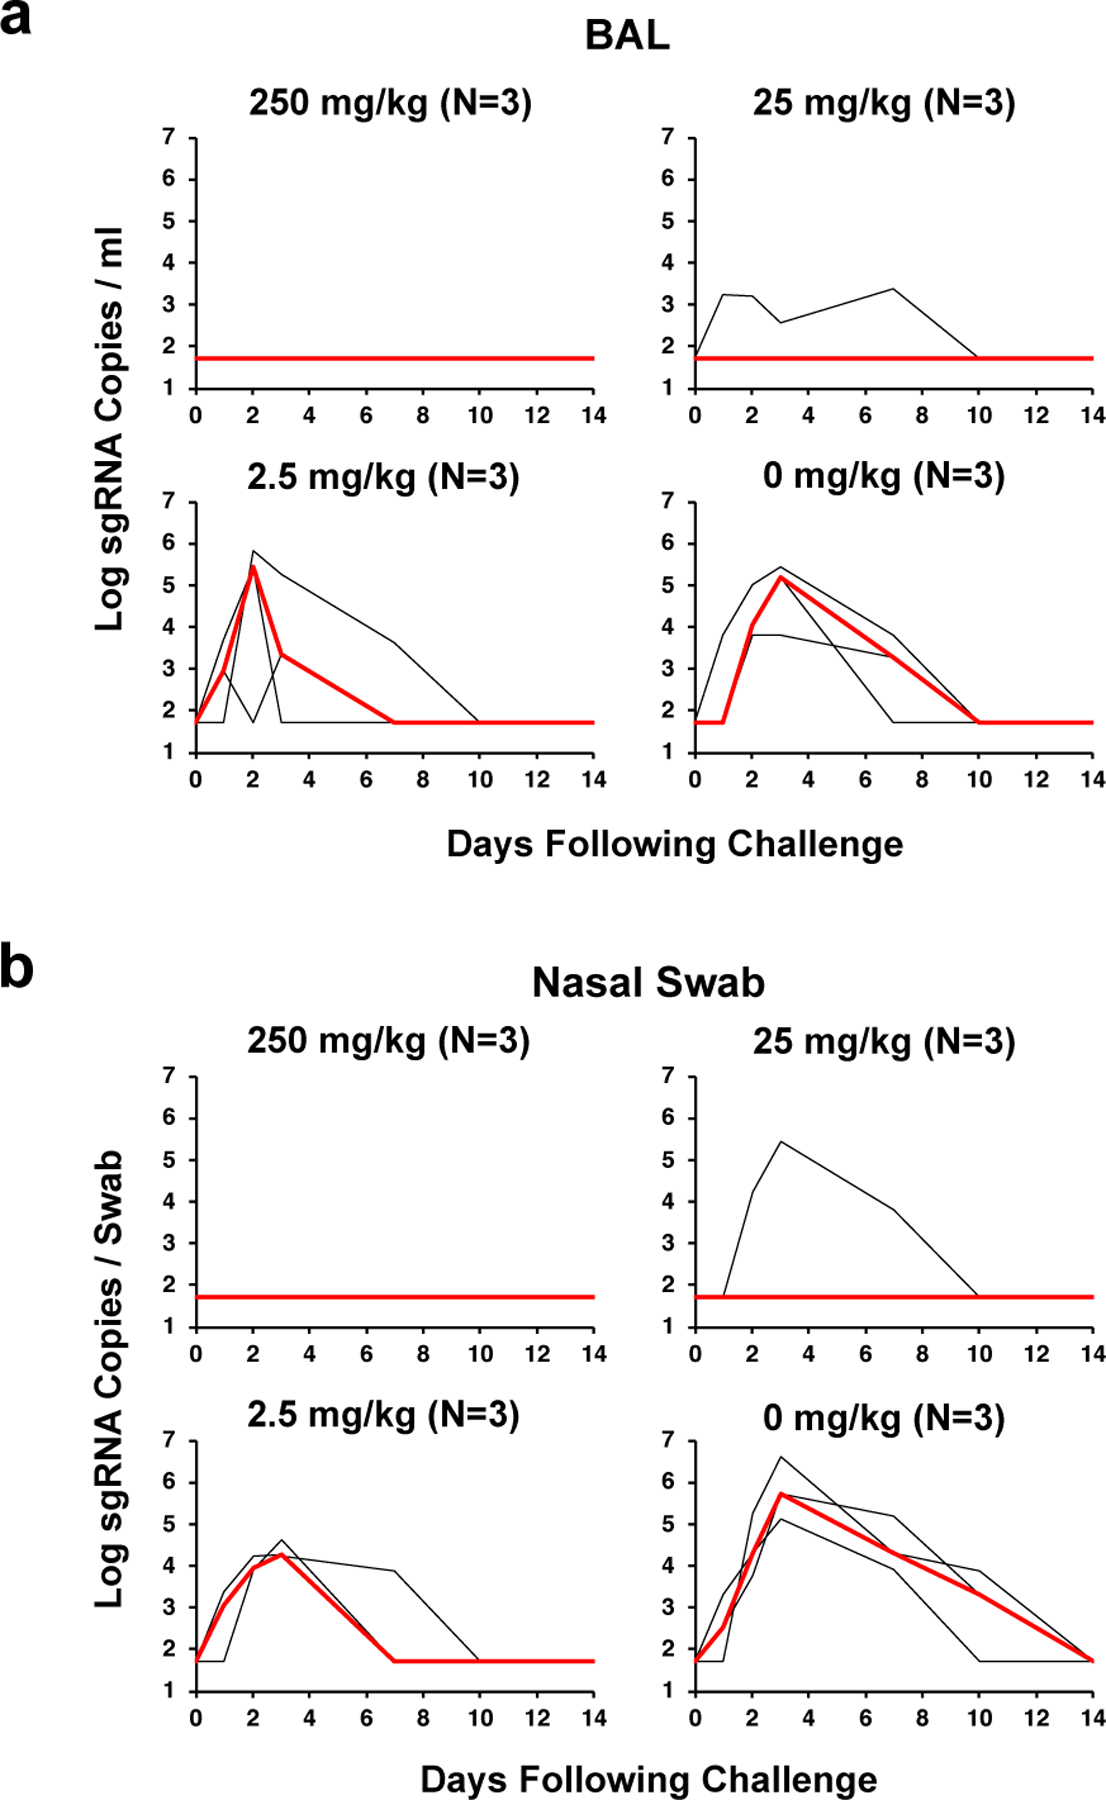
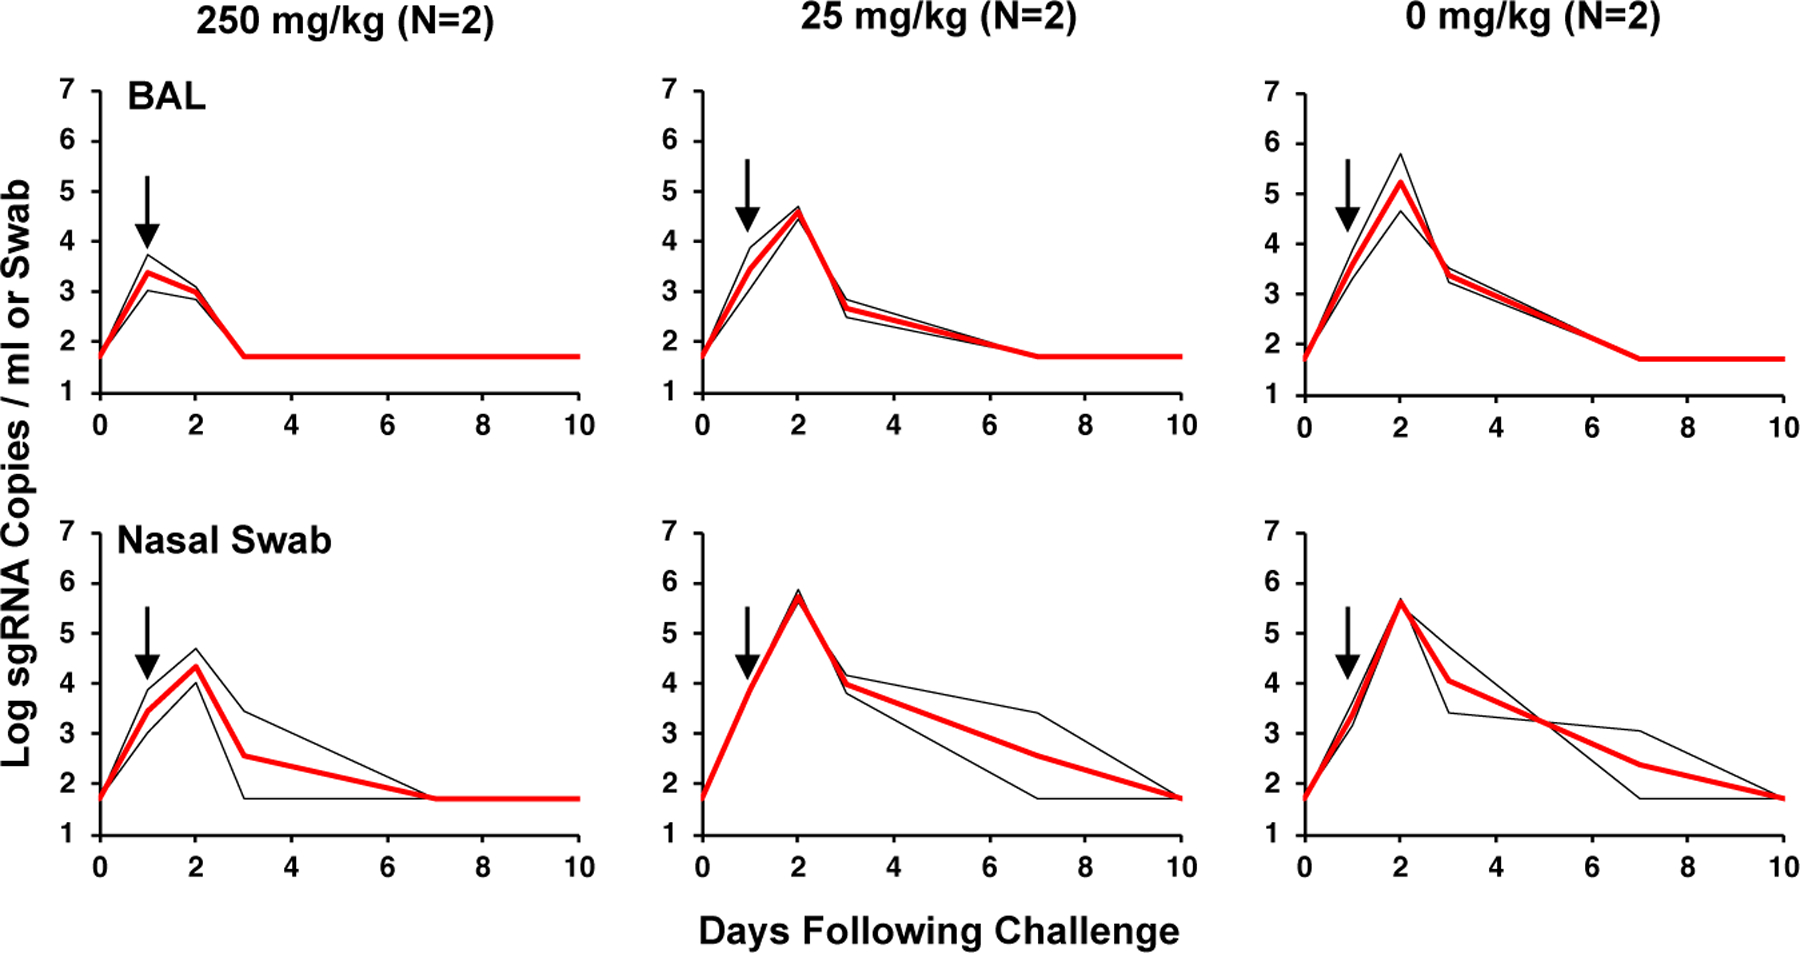
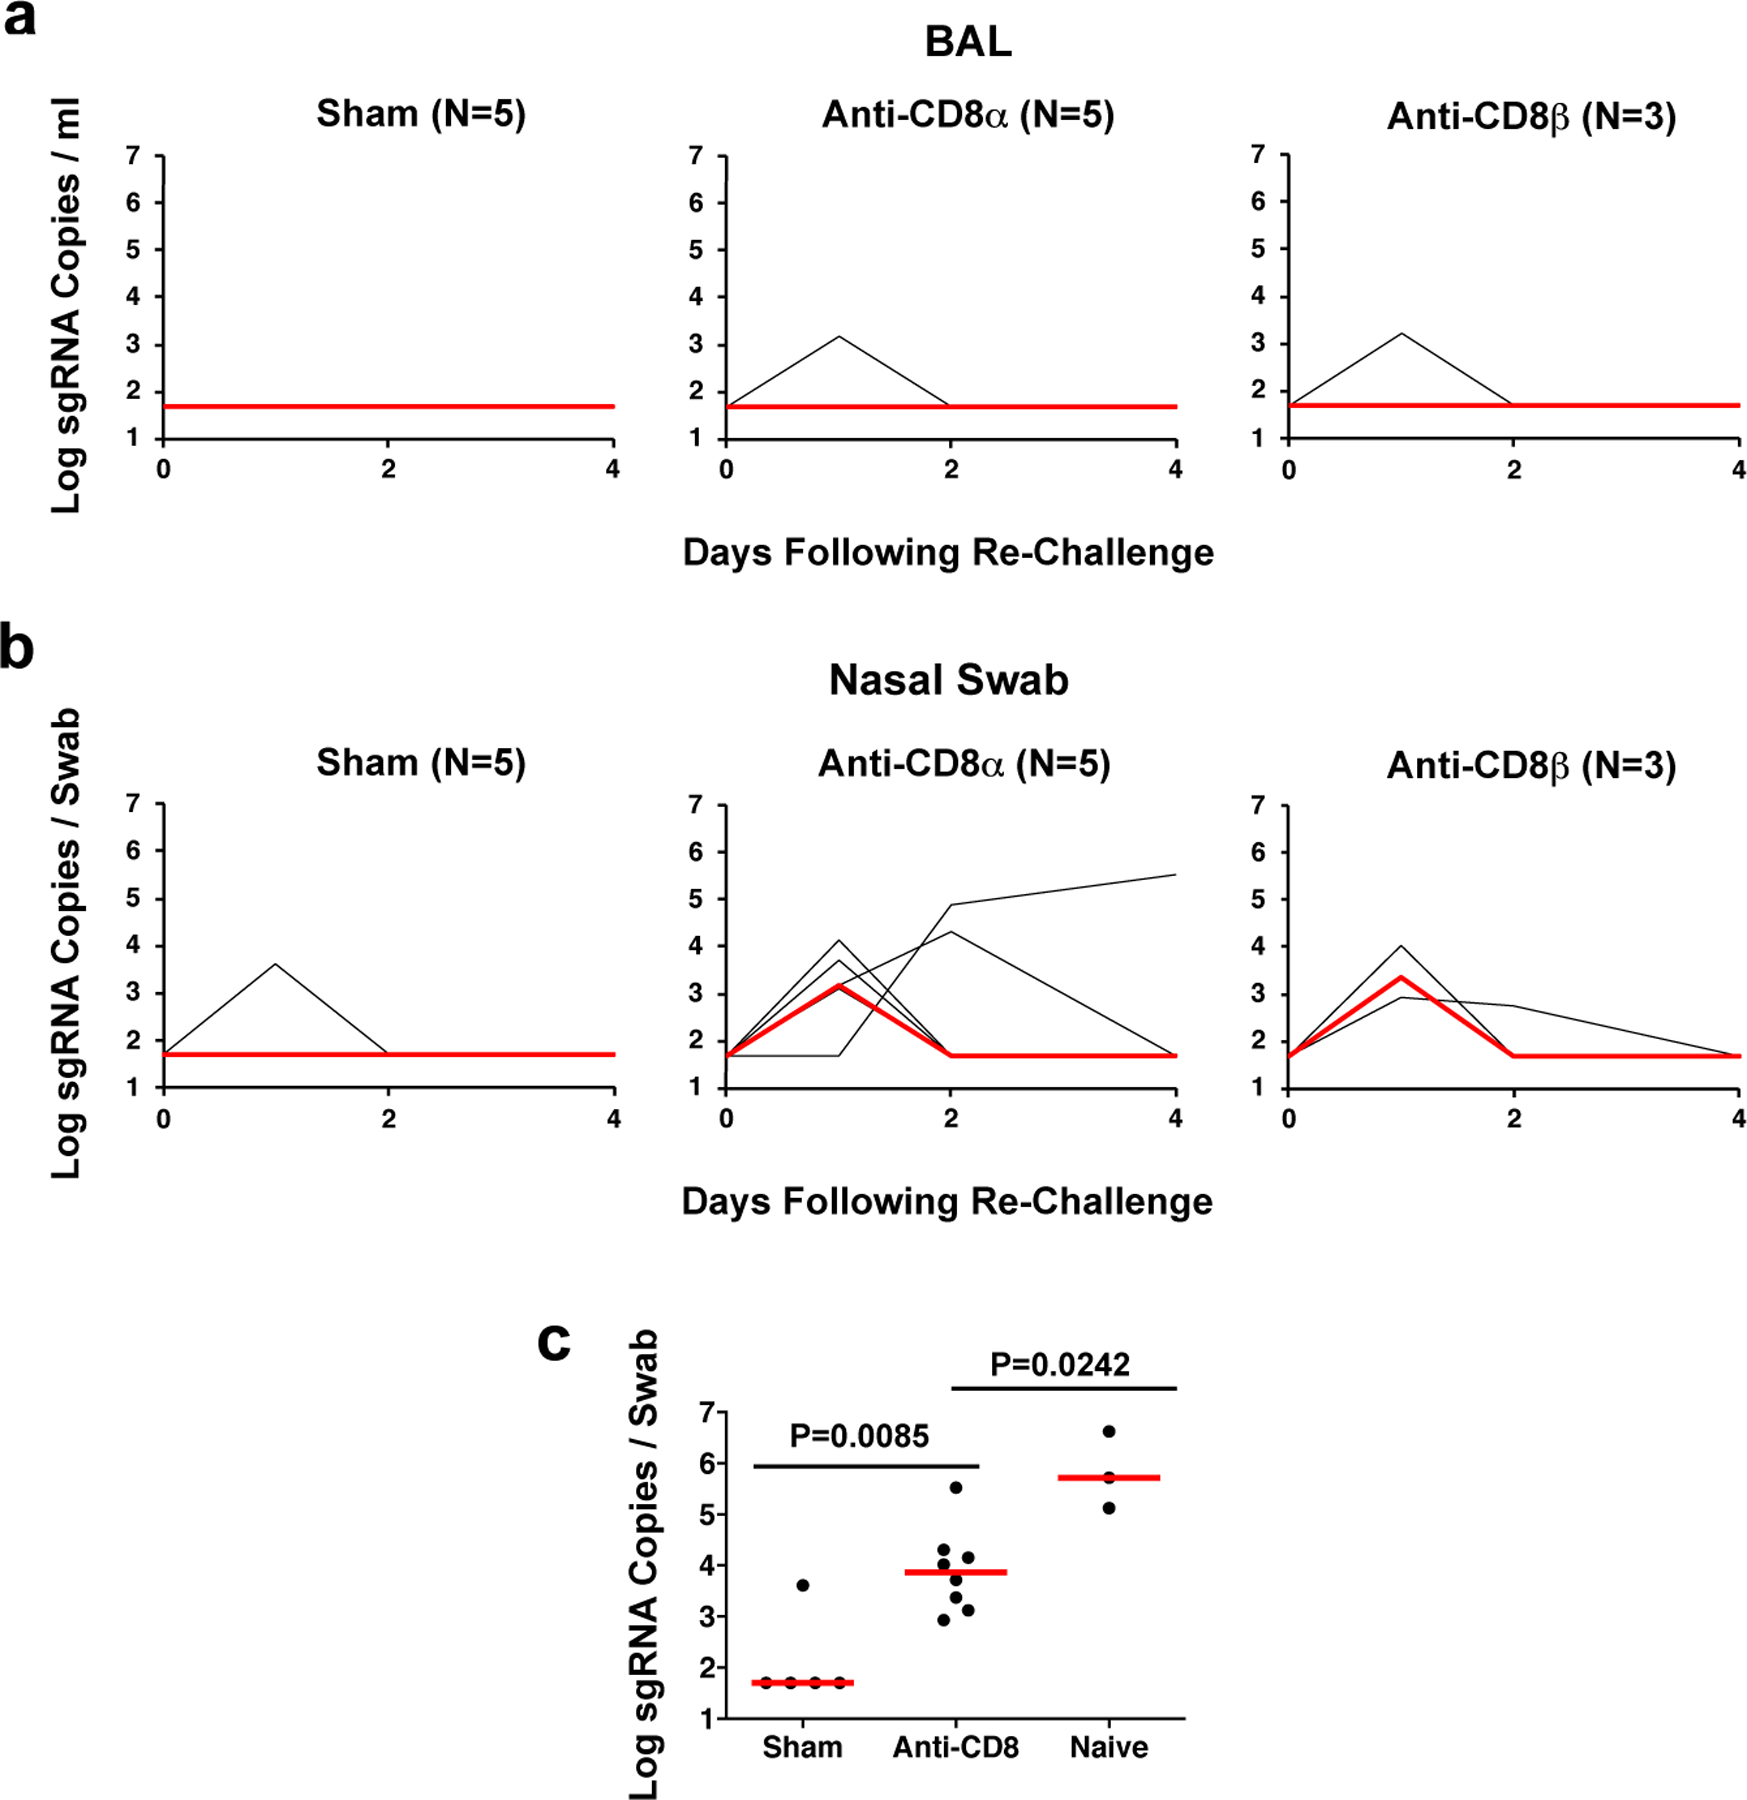
Recent studies have reported the protective efficacy of both natural1 and vaccine-induced2-7 immunity against challenge with severe acute respiratory syndrome coronavirus 2 (SARS-CoV-2) in rhesus macaques. However, the importance of humoral and cellular immunity for protection against infection with SARS-CoV-2 remains to be determined. Here we show that the adoptive transfer of purified IgG from convalescent rhesus macaques (Macaca mulatta) protects naive recipient macaques against challenge with SARS-CoV-2 in a dose-dependent fashion. Depletion of CD8+ T cells in convalescent macaques partially abrogated the protective efficacy of natural immunity against rechallenge with SARS-CoV-2, which suggests a role for cellular immunity in the context of waning or subprotective antibody titres. These data demonstrate that relatively low antibody titres are sufficient for protection against SARS-CoV-2 in rhesus macaques, and that cellular immune responses may contribute to protection if antibody responses are suboptimal. We also show that higher antibody titres are required for treatment of SARS-CoV-2 infection in macaques. These findings have implications for the development of SARS-CoV-2 vaccines and immune-based therapeutic agents.


Conflict of interest statement

Competing Interests

The authors declare no financial conflicts of interest. D.H.B. is a co-inventor on provisional SARS-CoV-2 vaccine patents (62/969,008; 62/994,630).

Figures

Extended Data Figure 1.
Extended Data Figure 1.. Pseudovirus NAb titers in plasma and purified IgG of donor macaques.
9 rhesus macaques were infected and re-challenged with SARS-CoV-2. IgG was purified from plasma and formulated at 10 mg/ml.
Extended Data Figure 2.
Extended Data Figure 2.. Antibody titers following prophylactic adoptive transfer of IgG prior to SARS-CoV-2 challenge.
(a) Log10 pseudovirus neutralizing antibody (NAb) titers, (b) Log10 S-specific ELISA titers, and (c) Log10 RBD-specific ELISA titers in rhesus macaques following intravenous infusion of 250 mg/kg, 25 mg/kg, 2.5 mg/kg of purified SARS-CoV-2 IgG or sham IgG on day −3. On day 0, all animals were challenged with 105 TCID50 SARS-CoV-2. Days following challenge is shown on the x-axis. Red lines reflect median responses. The number of animals is denoted in each panel and the median line overlaps with data lines.
Extended Data Figure 3.
Extended Data Figure 3.. Systems serology following adoptive transfer of IgG in rhesus macaques.
(a) S-specific IgG subclass, FcR, and antibody-dependent cellular phagocytosis (ADCP), antibody-dependent neutrophil phagocytosis (ADNP), antibody-dependent complement deposition (ADCD) and antibody-dependent NK cell activation (ADNKA) responses. (b) Radar plot showing the mean percentile of the antibody levels across passive transfer groups. The size and color intensity of the wedges indicate the mean percentile of the feature for the corresponding group (antibody subclass, red; FcR binding, blue; effector function, green). (c) Principal component analysis (PCA) plot showing the multivariate antibody profiles across groups. Each dot represents one animal (n=12 independent animals) and the color of the dot indicates the group. Red lines reflect median responses.
Extended Data Figure 4.
Extended Data Figure 4.. Systems serology immune correlates.
(a) The heat map shows the Spearman correlations between antibody features and peak sgRNA in BAL and NS (*q-value < 0.05, **q-value < 0.01 with q-value obtained by Benjamini-Hochberg correction for multiple testing). (b) Relations between the top four antibody features (n=12 independent animals) that are highest correlated to peak viral loads in BAL (upper row) and NS (bottom row). Red lines indicate fitted exponential curves. (c) The radar plots depict the mean percentile of each antibody feature for protected and non-protected animals. The size and color intensity of the wedges indicate the mean percentile of the feature for the corresponding group (antibody subclass, red; FcR binding, blue; effector function, green).
Extended Data Figure 5.
Extended Data Figure 5.. Decline of NAb titers in convalescent rhesus macaques following SARS-CoV-2 infection.
Log10 pseudovirus NAb titers in the 9 re-challenged macaques used as donors in the adoptive transfer study and in the 10 macaques used in the CD8 depletion study at week 4 and week 7 following SARS-CoV-2 infection. Red lines reflect median values. P values reflect two-sided Mann-Whitney tests.
Extended Data Figure 6.
Extended Data Figure 6.. CD8+ cells following CD8 depletion and SARS-CoV-2 re-challenge.
Rhesus macaques were infected with SARS-CoV-2 and received 50 mg/kg anti-CD8α mAb, anti-CD8β mAb, or sham mAb at week 7, reflecting day −3 relative to re-challenge. On day 0, all animals were re-challenged with 105 TCID50 SARS-CoV-2. Total CD8+ cells, CD8+CD3+ cells, and CD8+CD3- cells per ul peripheral blood are shown. Days following challenge is shown on the x-axis. Red lines reflect median values.
Extended Data Figure 7.
Extended Data Figure 7.. CD8+ T cell responses following CD8 depletion and SARS-CoV-2 re-challenge.
(a) IFN-γ S-specific CD8+ T cell responses assessed by intracellular cytokine staining in non-depleted (Sham) and CD8 depleted (anti-CD8α) rhesus macaques prior to and following SARS-CoV-2 re-challenge. Days following re-challenge is shown on the x-axis. Red lines reflect median values. P values reflect two-sided Mann-Whitney tests. (b) IFN-γ, TNF-α, and IL-2 S-specific CD8+ T cell responses in non-depleted (Sham) animals prior to re-challenge (n=5 independent animals). Red lines reflect median responses.
Extended Data Figure 8.
Extended Data Figure 8.. CD4+ T cell responses following CD8 depletion and SARS-CoV-2 re-challenge.
IFN-γ S-specific CD4+ T cell responses assessed by intracellular cytokine staining in non-depleted (Sham) and CD8 depleted (anti-CD8α) rhesus macaques prior to and following SARS-CoV-2 re-challenge. Days following re-challenge is shown on the x-axis. Red lines reflect median values.
Extended Data Figure 9.
Extended Data Figure 9.. NAb responses following CD8 depletion and SARS-CoV-2 re-challenge.
Log10 pseudovirus NAb titers in non-depleted (Sham) and CD8 depleted (anti-CD8α) rhesus macaques prior to and following SARS-CoV-2 re-challenge. Days following re-challenge is shown on the x-axis.
Figure 1.
Figure 1.. Viral loads following prophylactic adoptive transfer of IgG prior to SARS-CoV-2 challenge.
Rhesus macaques were challenged by the intranasal and intratracheal routes with 105 TCID50 SARS-CoV-2. (a) Log10 sgRNA copies/ml (limit of quantification 50 copies/ml) were assessed in bronchoalveolar lavage (BAL) following challenge. (b) Log10 sgRNA copies/swab (limit of quantification 50 copies/swab) were assessed in nasal swabs (NS) following challenge. Days following challenge is shown on the x-axis. Red lines reflect median values. The number of animals is denoted in each panel and the median line overlaps with data lines.
Figure 2.
Figure 2.. Regression analysis of antibody threshold for protection.
Differences in (a) pseudovirus NAb titers, (b) RBD ELISA titer, and (c) S (FLED) ELISA titer between protected and not protected animals. Animals were considered to be protected if they had no detectable virus in bronchoalveolar lavage (BAL, n = 5 protected animals, left), nasal swab (NS, n = 5 protected animals, middle) or in both (n = 4 protected animals, right). The threshold titers are indicated as horizontal lines and were obtained by logistic regression for scenarios where the groups were not completely separable using the corresponding titer (95% predicted probability of protection, solid lines), or represent the mean between the highest and lowest titers of not protected and protected animals, respectively (dotted lines). In the box plots, whiskers indicate range, and boxes indicates 25th to 75th percentile. Relationship between (d) pseudovirus NAb titers, (e) RBD ELISA titer, and (f) S (FLED) ELISA titer and peak viral loads in BAL (left) and NS (right). Red lines indicate fitted exponential curves.
Figure 3.
Figure 3.. Viral loads following therapeutic adoptive transfer of IgG after SARS-CoV-2 challenge.
Rhesus macaques were challenged by the intranasal and intratracheal routes with 105 TCID50 SARS-CoV-2 on day 0 and then received intravenous infusion of 250 mg/kg, 25 mg/kg, or 0 mg/kg purified SARS-CoV-2 IgG on day 1. Log10 sgRNA copies/ml (limit of quantification 50 copies/ml) were assessed in bronchoalveolar lavage (BAL) and log10 sgRNA copies/swab (limit of quantification 50 copies/swab) were assessed in nasal swabs (NS) following challenge. Days following challenge is shown on the x-axis. Red lines reflect median values. Arrows represent the day of IgG infusion. The number of animals is denoted in each panel and the median line overlaps with data lines.
Figure 4.
Figure 4.. Viral loads following CD8 depletion and SARS-CoV-2 re-challenge.
Rhesus macaques were infected with SARS-CoV-2 and received 50 mg/kg anti-CD8α mAb, anti-CD8β mAb, or sham mAb at week 7, reflecting day −3 relative to re-challenge. On day 0, all animals were re-challenged with 105 TCID50 SARS-CoV-2. (a) Log10 sgRNA copies/ml (limit of quantification 50 copies/ml) were assessed in bronchoalveolar lavage (BAL) following re-challenge. (b) Log10 sgRNA copies/swab (limit of quantification 50 copies/swab) were assessed in nasal swabs (NS) following re-challenge. Days following challenge is shown on the x-axis. (c) Comparison of peak log sgRNA in NS following re-challenge in sham and anti-CD8 groups. Peak log sgRNA in NS from naïve animals following primary challenge from the adoptive transfer study are shown for comparison. Red lines reflect median values. The number of animals is denoted in each panel (Sham n=5, Anti-CD8 n=8, Naïve n=3 independent animals). P values reflects two-sided Mann-Whitney tests.

Similar articles

  • Mucosal boosting enhances vaccine protection against SARS-CoV-2 in macaques.
    McMahan K, Wegmann F, Aid M, Sciacca M, Liu J, Hachmann NP, Miller J, Jacob-Dolan C, Powers O, Hope D, Wu C, Pereira J, Murdza T, Mazurek CR, Hoyt A, Boon ACM, Davis-Gardner M, Suthar MS, Martinot AJ, Boursiquot M, Cook A, Pessaint L, Lewis MG, Andersen H, Tolboom J, Serroyen J, Solforosi L, Costes LMM, Zahn RC, Barouch DH. McMahan K, et al. Nature. 2024 Feb;626(7998):385-391. doi: 10.1038/s41586-023-06951-3. Epub 2023 Dec 14. Nature. 2024. PMID: 38096903 Free PMC article.
  • Protective efficacy of Ad26.COV2.S against SARS-CoV-2 B.1.351 in macaques.
    Yu J, Tostanoski LH, Mercado NB, McMahan K, Liu J, Jacob-Dolan C, Chandrashekar A, Atyeo C, Martinez DR, Anioke T, Bondzie EA, Chang A, Gardner S, Giffin VM, Hope DL, Nampanya F, Nkolola J, Patel S, Sanborn O, Sellers D, Wan H, Hayes T, Bauer K, Pessaint L, Valentin D, Flinchbaugh Z, Brown R, Cook A, Bueno-Wilkerson D, Teow E, Andersen H, Lewis MG, Martinot AJ, Baric RS, Alter G, Wegmann F, Zahn R, Schuitemaker H, Barouch DH. Yu J, et al. Nature. 2021 Aug;596(7872):423-427. doi: 10.1038/s41586-021-03732-8. Epub 2021 Jun 23. Nature. 2021. PMID: 34161961 Free PMC article.
  • Recovery from Acute SARS-CoV-2 Infection and Development of Anamnestic Immune Responses in T Cell-Depleted Rhesus Macaques.
    Hasenkrug KJ, Feldmann F, Myers L, Santiago ML, Guo K, Barrett BS, Mickens KL, Carmody A, Okumura A, Rao D, Collins MM, Messer RJ, Lovaglio J, Shaia C, Rosenke R, van Doremalen N, Clancy C, Saturday G, Hanley P, Smith BJ, Meade-White K, Shupert WL, Hawman DW, Feldmann H. Hasenkrug KJ, et al. mBio. 2021 Aug 31;12(4):e0150321. doi: 10.1128/mBio.01503-21. Epub 2021 Jul 27. mBio. 2021. PMID: 34311582 Free PMC article.
  • Antibody Responses in COVID-19: A Review.
    Chvatal-Medina M, Mendez-Cortina Y, Patiño PJ, Velilla PA, Rugeles MT. Chvatal-Medina M, et al. Front Immunol. 2021 Apr 15;12:633184. doi: 10.3389/fimmu.2021.633184. eCollection 2021. Front Immunol. 2021. PMID: 33936045 Free PMC article. Review.
  • Antibody response and therapy in COVID-19 patients: what can be learned for vaccine development?
    Lu L, Zhang H, Zhan M, Jiang J, Yin H, Dauphars DJ, Li SY, Li Y, He YW. Lu L, et al. Sci China Life Sci. 2020 Dec;63(12):1833-1849. doi: 10.1007/s11427-020-1859-y. Epub 2020 Dec 1. Sci China Life Sci. 2020. PMID: 33355886 Free PMC article. Review.

Cited by

References

    1. Chandrashekar A et al. SARS-CoV-2 infection protects against rechallenge in rhesus macaques. Science 369, 812–817, doi:10.1126/science.abc4776 (2020). - DOI - PMC - PubMed
    1. Wang H et al. Development of an Inactivated Vaccine Candidate, BBIBP-CorV, with Potent Protection against SARS-CoV-2. Cell 182, 713–721 e719, doi:10.1016/j.cell.2020.06.008 (2020). - DOI - PMC - PubMed
    1. Gao Q et al. Development of an inactivated vaccine candidate for SARS-CoV-2. Science 369, 77–81, doi:10.1126/science.abc1932 (2020). - DOI - PMC - PubMed
    1. Yu J et al. DNA vaccine protection against SARS-CoV-2 in rhesus macaques. Science 369, 806–811, doi:10.1126/science.abc6284 (2020). - DOI - PMC - PubMed
    1. Mercado NB et al. Single-shot Ad26 vaccine protects against SARS-CoV-2 in rhesus macaques. Nature, doi:10.1038/s41586-020-2607-z (2020). - DOI - PMC - PubMed

Publication types

MeSH terms

Substances