. 2020 Dec 2;9(12):2579.
doi: 10.3390/cells9122579.

Altered Expression of Mitoferrin and Frataxin, Larger Labile Iron Pool and Greater Mitochondrial DNA Damage in the Skeletal Muscle of Older Adults

Affiliations

Altered Expression of Mitoferrin and Frataxin, Larger Labile Iron Pool and Greater Mitochondrial DNA Damage in the Skeletal Muscle of Older Adults

Anna Picca et al. Cells. .

Abstract

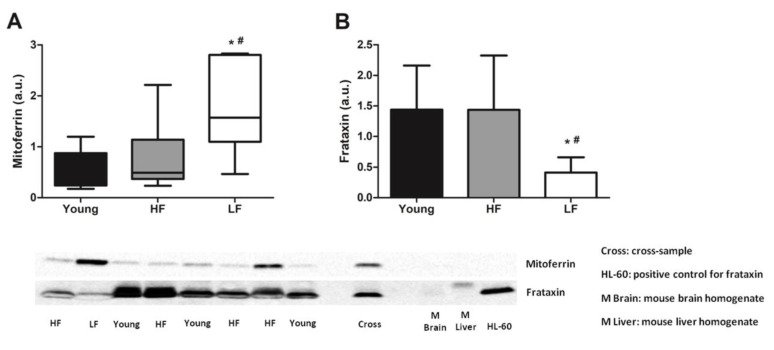
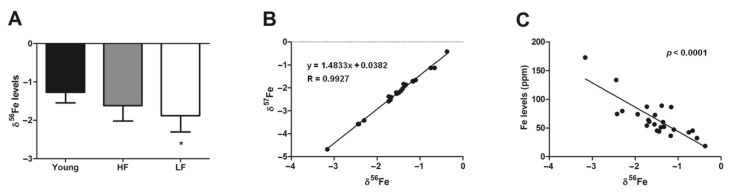
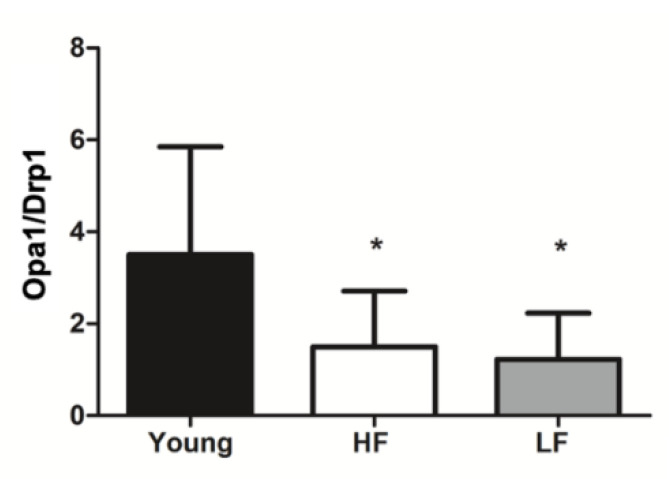
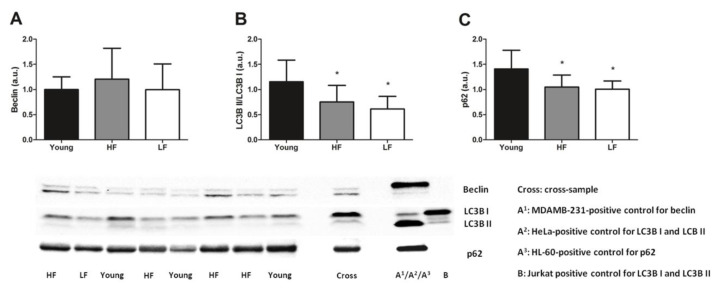
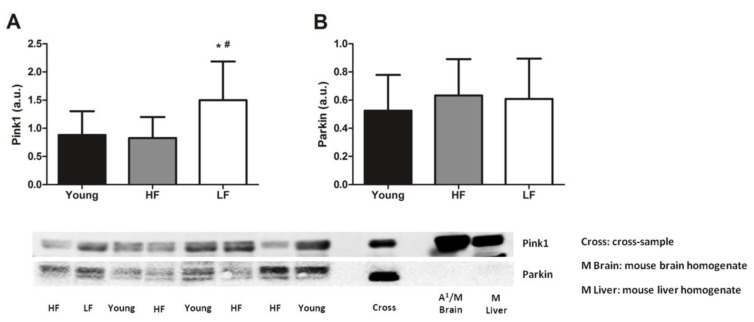
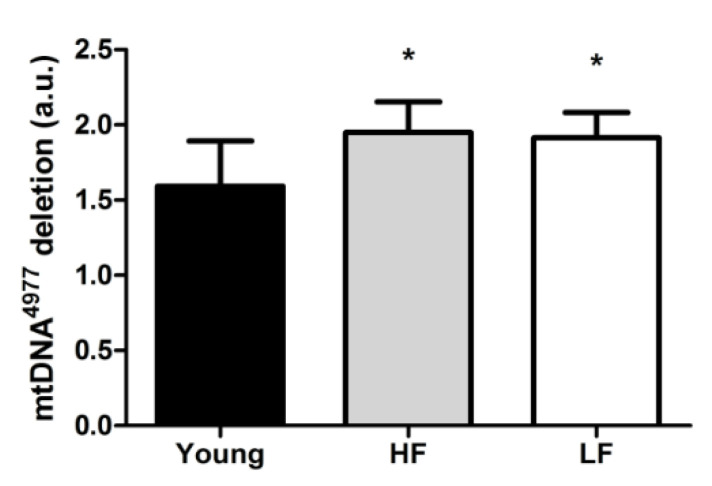
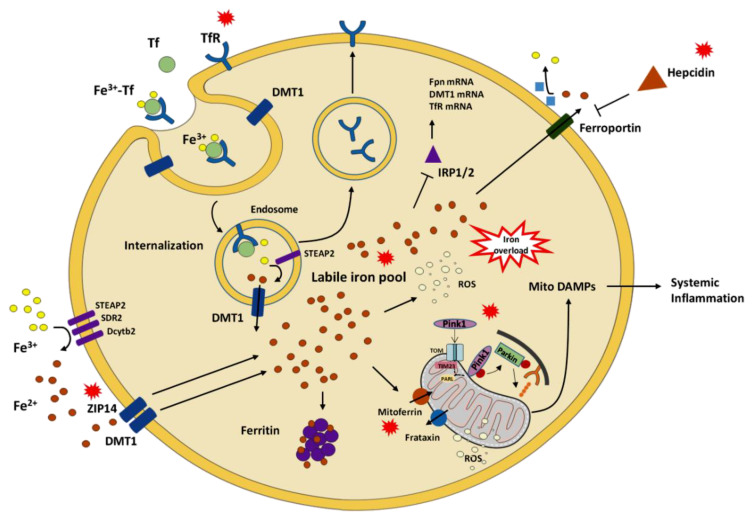
Mitochondrial dysfunction and iron (Fe) dyshomeostasis are invoked among the mechanisms contributing to muscle aging, possibly via a detrimental mitochondrial-iron feed-forward loop. We quantified the labile Fe pool, Fe isotopes, and the expression of mitochondrial Fe handling proteins in muscle biopsies obtained from young and older adults. The expression of key proteins of mitochondrial quality control (MQC) and the abundance of the mitochondrial DNA common deletion (mtDNA4977) were also assessed. An inverse association was found between total Fe and the heavier Fe isotope (56Fe), indicating an increase in labile Fe abundance in cells with greater Fe content. The highest levels of labile Fe were detected in old participants with a Short Physical Performance Battery (SPPB) score ≤ 7 (low-functioning, LF). Protein levels of mitoferrin and frataxin were, respectively, higher and lower in the LF group relative to young participants and older adults with SPPB scores ≥ 11 (high-functioning, HF). The mtDNA4977 relative abundance was greater in old than in young participants, regardless of SPPB category. Higher protein levels of Pink1 were detected in LF participants compared with young and HF groups. Finally, the ratio between lipidated and non-lipidated microtubule-associated protein 1A/1B-light chain 3 (i.e., LC3B II/I), as well as p62 protein expression was lower in old participants regardless of SPPB scores. Our findings indicate that cellular and mitochondrial Fe homeostasis is perturbed in the aged muscle (especially in LF older adults), as reflected by altered levels of mitoferrin and frataxin, which, together with MQC derangements, might contribute to loss of mtDNA stability.

Keywords: autophagy; iron dyshomeostasis; iron isotopes; iron metabolism; mitochondria; mitochondrial quality control; mitophagy; muscle aging; oxidative stress; physical performance.


Conflict of interest statement

The authors declare no conflict of interest. The funders had no role in study design, data collection and analysis, preparation of the manuscript, or decision to publish.

Figures

Figure 1
Figure 1
Protein levels of mitoferrin and frataxin in the vastus lateralis muscle of young and old participants. (A) Comparisons of mitoferrin levels by Kruskal–Wallis H statistics and of (B) frataxin by one-way ANOVA among young participants (n = 11) and high- (HF, n = 16) and low-functioning (LF, n = 7) older adults. In (A) box plots represent median values (interquartile ranges), while in (B) bars represent mean values (±standard deviation) for the three experimental groups. Values are expressed in arbitrary units (a.u.) and representative blots are shown for each protein. * p < 0.05 vs. young group; # p < 0.05 vs. HF group.
Figure 2
Figure 2
Iron isotope data for the vastus lateralis muscle of young and old participants. (A) Comparison by one-way ANOVA of δ56Fe among young participants (n = 11) and high- (HF, n = 16) and low-functioning (LF, n = 7) older adults. (B) Linear regression analysis between δ57Fe and δ56Fe in young and old participants. (C) Relationship between total Fe levels and δ56Fe in young and old participants as assessed by Pearson’s test. In (A) bars represent mean values (±standard deviation) for the three experimental groups. Values are expressed as ppm Fe. * p < 0.05 vs. young group.
Figure 3
Figure 3
Mitochondrial fusion index in the vastus lateralis muscle of young and old participants. The fusion index was calculated as the ratio between protein levels of the fusion marker optic atrophy 1 (Opa1) and those of the fission factor dynamin-related protein 1 (Drp1). Differences among groups were assessed by one-way ANOVA. Bars represent mean values (±standard deviation) for the three experimental groups. * p < 0.05 vs. young group (n = 11); HF: high-functioning (n = 16); LF: low-functioning (n = 7).
Figure 4
Figure 4
Selected markers of general autophagy in the vastus lateralis muscle of young and old participants. Comparison by one-way ANOVA of (A) protein levels of beclin, (B) ratio between lipidated (II) and non-lipidated (I) microtubule-associated protein 1A/1B-light chain 3 (LC3B), and (C) protein levels of p62 among young participants (n = 11) and high- (HF, n = 16) and low-functioning (LF, n = 7) older adults. Bars represent mean values (±standard deviation) for the three experimental groups. Values are expressed in arbitrary units (a.u.) and representative blots are shown for each protein. * p < 0.05 vs. young group.
Figure 5
Figure 5
Protein levels of selected markers of mitophagy in the vastus lateralis muscle of young and old participants. Comparison by one-way ANOVA of (A) phosphatase and tensin homolog-induced kinase 1 (Pink1) and (B) Parkin among young participants (n = 11) and high- (HF, n = 16) and low-functioning (LF, n = 7) older adults. Bars represent mean values (± standard deviation) for the three experimental groups. Values are expressed in arbitrary units (a.u.) and representative blots are shown for each protein. * p < 0.05 vs. young group. # p < 0.05 vs. HF group.
Figure 6
Figure 6
Relative abundance of the mtDNA4977 deletion in the vastus lateralis muscle of young and old participants. Differences among groups were assessed by one-way ANOVA. Bars represent mean values (±standard deviation) for the three experimental groups. Values are expressed in arbitrary units (a.u.). * p < 0.05 vs. young group (n = 11); HF: high-functioning (n = 16); LF: low-functioning (n = 7).
Figure 7
Figure 7
Schematic representation of putative pathways linking age-related systemic and muscular iron dyshomeostasis, derangements in mitochondrial quality control, and systemic inflammation. Red callouts indicate mediators/processes that are mainly dysregulated. Abbreviations: DAMPs, damage-associated molecular patterns; Dcytb2, duodenal cytochrome b2; DMT1, divalent metal transporter 1; Fpn, ferroportin; IRP1/2, iron-responsive element-binding protein 1/2; PARL, presenilin-associated rhomboid-like protein; Pink1, phosphatase and tensin homolog-induced kinase 1; ROS, reactive oxygen species; SDR2, stromal cell-derived receptor 2; STEAP2, six-transmembrane epithelial antigen of the prostate 2; Tf, transferrin; TfR, transferrin receptor; TIM23, translocase of inner mitochondrial membrane 23; TOM, translocase of the outer mitochondrial membrane; ZIP14, Zrt-Irt-like protein 14.

References

    1. Aging Research: Protect Health and Prevent Disease|NIA. [(accessed on 14 October 2020)]; Available online: https://www.nia.nih.gov/about/aging-strategic-directions-research/goal-h....
    1. Chang M., Cohen-Mansfield J., Ferrucci L., Leveille S., Volpato S., De Rekeneire N., Guralnik J.M. Incidence of loss of ability to walk 400 meters in a functionally limited older population. J. Am. Geriatr. Soc. 2004;52:2094–2098. doi: 10.1111/j.1532-5415.2004.52570.x. - DOI - PubMed
    1. Guralnik J.M., Ferrucci L., Simonsick E.M., Salive M.E., Wallace R.B. Lower-extremity function in persons over the age of 70 years as a predictor of subsequent disability. N. Engl. J. Med. 1995;332:556–562. doi: 10.1056/NEJM199503023320902. - DOI - PMC - PubMed
    1. Pavasini R., Guralnik J., Brown J.C., di Bari M., Cesari M., Landi F., Vaes B., Legrand D., Verghese J., Wang C., et al. Short Physical Performance Battery and all-cause mortality: Systematic review and meta-analysis. BMC Med. 2016;14:215. doi: 10.1186/s12916-016-0763-7. - DOI - PMC - PubMed
    1. Fanning J., Rejeski W.J., Chen S.H., Guralnik J., Pahor M., Miller M.E. Relationships Between Profiles of Physical Activity and Major Mobility Disability in the LIFE Study. J. Am. Geriatr. Soc. 2020;68:1476–1483. doi: 10.1111/jgs.16386. - DOI - PMC - PubMed

Publication types