. 2020 Dec 2;9(12):1790.
doi: 10.3390/foods9121790.

Analysis of Gluten in Dried Yeast and Yeast-Containing Products

Affiliations

Analysis of Gluten in Dried Yeast and Yeast-Containing Products

Laura K Allred et al. Foods. .

Abstract

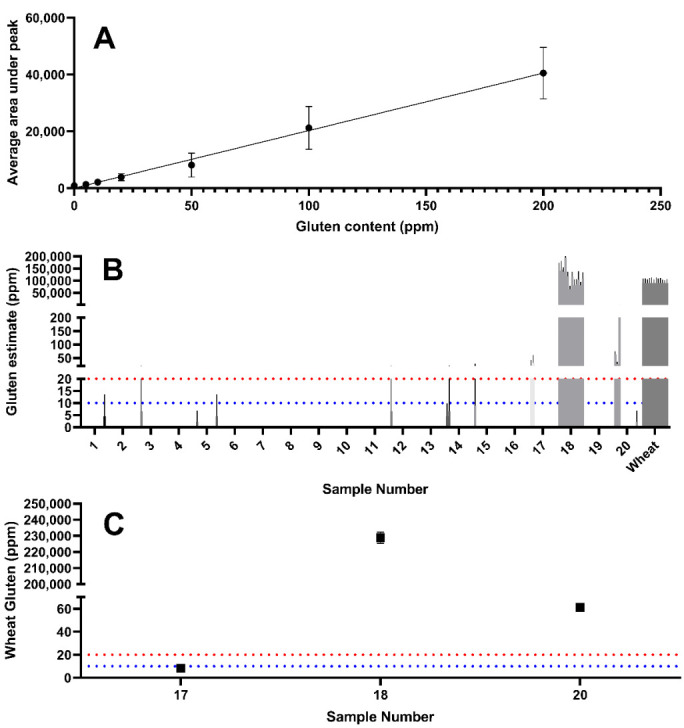
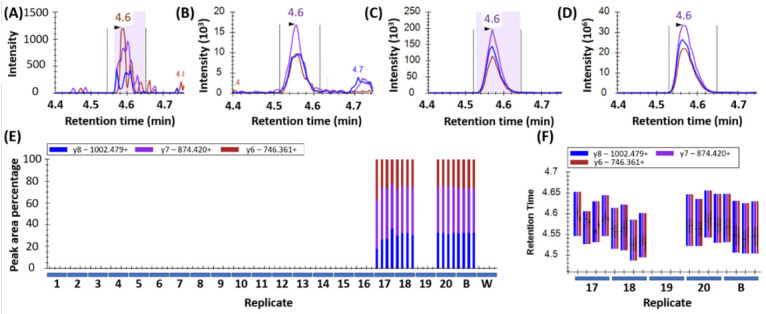
Yeast are commonly used in the preparation of foods and beverages such as beer and bread and may also be used on their own as a source of nutrients and flavoring. Because of the historical connection of yeast to products made from wheat and barley, consumers maintaining a gluten-free diet can have concerns about the safety of yeast ingredients. Analyzing the safety of yeast and yeast-containing products presents some difficulties, as the yeast organisms actively degrade any gluten in the product, raising questions on the appropriateness of detection by traditional antibody-based methods. This study examines a variety of yeast and yeast-containing products by competitive ELISA and liquid chromatography-mass spectrometry for the estimated level of gluten proteins. While samples such as yeast extracts and nutritional yeast contained gluten levels below the 20 mg/kg (or parts per million, ppm) threshold defined by Codex Alimentarius, one baking yeast and a nutritional yeast supplement sample contained higher levels of gluten. This study demonstrates that both competitive ELISA and liquid chromatography-mass spectrometry provide similar results in the detection of wheat and barley gluten in yeast-containing products.

Keywords: ELISA; LC–MS; gluten; yeast.


Conflict of interest statement

The authors declare no conflict of interest.

Figures

Figure 1
Figure 1
Wheat peptide (DVSPGCRPITVSPGTR from HMW-GS, Uniprot: Q45R38) peak detection in yeast samples: (A) Sample 17 (intensity 6.0 × 10³); (B) sample 18 (intensity 2.0 × 10⁷); (C) sample 20 (intensity 1.0 × 10⁴); and (D) wheat (control, intensity 1.2 × 10⁷). The peaks were detected using three MRM transitions per peptide and the ratio of these as shown in (E) by blue/purple/brown bars act as a quality control (QC) factor for peak detection. A second QC factor was the co-elution of the transitions at the retention time of the control wheat (F).
Figure 2
Figure 2
Wheat peptide (DVSPGCRPITVSPGTR from HMW-GS, Uniprot: Q45R38) peak area measurement using increasing injection volumes (1, 2, and 5 µL) of samples 17, 18, and 20. The four technical replicates are indicated by the letters A–D, the colored columns indicate the peak area for the three MRM transitions. (A) shows the full range of peak area, whilst (B) shows a zoomed in y-axis allowing the view of the trace level gluten detection in samples 17 and 20.
Figure 3
Figure 3
Detection of wheat marker peptides by LC–MS. Significant levels of wheat were detected in samples 17, 18, and 20, with trace levels in samples 1, 3, 5, 12, 14, 15, and 19. (A) LC–MS/MS peak area of the 12 wheat peptides used as peptide markers for wheat (raw data). (B) Peak area normalized to wheat control, expressed as a percentage.
Figure 4
Figure 4
Estimates of the concentration of gluten in the samples were made by comparing to wheat samples diluted in a solution of gluten-free yeast extract. Samples were weighed independently in quadruplicate and peptide peak area measured and plotted as a calibration curve (A). This data was then used to generate estimates of gluten concentration across all tested samples (B) with clear detection in samples 17, 18, and 20 for 12 peptides (n = 4 replicates). Wheat gluten estimate based on the sample mean of all wheat gluten peptides and interpolated from the calibration curve (C). The dashed red line represents the 20 mg/kg threshold, whilst the dashed blue line represents the 10 mg/kg GFCO certification threshold.
Figure 5
Figure 5
Barley peptide (VFLQQQCSPVR from B-hordein, UniProt: I6SJ22) peak detection in yeast samples: (A) sample 17 (intensity 1.2 × 10³); (B) sample 18 (intensity 1.7 × 10⁴); (C) sample 20 (intensity 2.0 × 10⁴); and (D) barley (control, intensity 3.4 × 10⁷). The peaks were detected using three MRM transitions per peptide and the ratio of these as shown in (E) by blue/purple/brown bars act as a quality control (QC) factor for peak detection. A second QC factor was the co-elution of the transitions at the retention time of the control barley (F).
Figure 6
Figure 6
Barley peptide (VFLQQQCSPVR from B-hordein, UniProt: I6SJ22) peak area measurement using increasing injection volumes (1, 2, and 5 µL). The four technical replicates are indicated by the letters A-D, the colored columns indicate the peak area for the three MRM transitions. (A) shows the full range of peak area, whilst (B) shows a zoomed in y-axis allowing the view of the trace level gluten detection in samples 17 and 20.
Figure 7
Figure 7
Detection of barley marker peptides by LC–MS. Significant levels of barley were detected in samples 17, 18 and 20, with trace levels detected in samples 8 and 14. (A) LC–MS peak area of 9 barley peptide markers (raw data). (B) Peak area normalized to barley expressed as a percentage.
Figure 8
Figure 8
(A) Standard curve of barley gluten in yeast extract. Barley-derived gluten was spiked into gluten-free yeast extract at known concentration. (B) Estimates of barley-derived gluten concentration in samples 8, 17, 18, and 20 (n = 4 replicates). (C) Barley gluten estimate based on the sample mean of all barley gluten peptides and interpolated from the calibration curve. The dashed red line represents the 20 mg/kg threshold, whilst the dashed blue line represents the 10 mg/kg GFCO certification threshold.

References

    1. Bekatorou A., Psarianos C., Koutinas A.A. Production of Food Grade Yeasts. Food Technol. Biotechnol. 2006;44:407–415.
    1. Pasteur L. The Diseases of Beer, Their Causes, and the Means of Preventing Them. MacMillan & Co.; London, UK: 1879.
    1. Reed G., Nagodawithana T. Yeast Technology. 2nd ed. Van Nostrand Reinhold; New York, NY, USA: 1991. p. 381.
    1. Halasz A., Lasztity R. Use of Yeast Biomass in Food Production. CRC Press; Boca Raton, FL, USA: 1991.
    1. Chniti S., Djelal H., Hassouna M., Amrane A. Residue of dates from the food industry as a cheap new feedstock for ethanol production. Biomass Bioenergy. 2014;69:66–70. doi: 10.1016/j.biombioe.2014.07.011. - DOI

LinkOut - more resources