. 2020 Dec 2;25(23):5684.
doi: 10.3390/molecules25235684.

Synthetic Peptide ΔM4-Induced Cell Death Associated with Cytoplasmic Membrane Disruption, Mitochondrial Dysfunction and Cell Cycle Arrest in Human Melanoma Cells

Affiliations

Synthetic Peptide ΔM4-Induced Cell Death Associated with Cytoplasmic Membrane Disruption, Mitochondrial Dysfunction and Cell Cycle Arrest in Human Melanoma Cells

Gloria A Santa-González et al. Molecules. .

Abstract

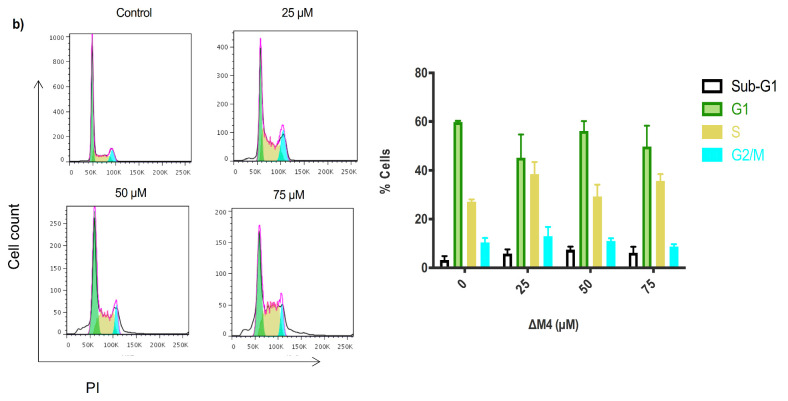
Melanoma is the most dangerous and lethal form of skin cancer, due to its ability to spread to different organs if it is not treated at an early stage. Conventional chemotherapeutics are failing as a result of drug resistance and weak tumor selectivity. Therefore, efforts to evaluate novel molecules for the treatment of skin cancer are necessary. Antimicrobial peptides have become attractive anticancer agents because they execute their biological activity with features such as a high potency of action, a wide range of targets, and high target specificity and selectivity. In the present study, the antiproliferative activity of the synthetic peptide ΔM4 on A375 human melanoma cells and spontaneously immortalized HaCaT human keratinocytes was investigated. The cytotoxic effect of ΔM4 treatment was evaluated through propidium iodide uptake by flow cytometry. The results indicated selective toxicity in A375 cells and, in order to further investigate the mode of action, assays were carried out to evaluate morphological changes, mitochondrial function, and cell cycle progression. The findings indicated that ΔM4 exerts its antitumoral effects by multitarget action, causing cell membrane disruption, a change in the mitochondrial transmembrane potential, an increase of reactive oxygen species, and cell cycle accumulation in S-phase. Further exploration of the peptide may be helpful in the design of novel anticancer peptides.

Keywords: antimicrobial peptides; antiproliferative peptides; cell cycle arrest; melanoma skin cancer; membrane integrity.


Conflict of interest statement

The authors declare no conflict of interest.

Figures

Figure 1
Figure 1
Predicted structure of the ∆M4 peptide. (a) Predicted α-helical structure of the ∆M4 peptide; positively charged residues are highlighted in red. (b) Helical-wheel projection of ∆M4; basic residues are presented as pentagons, non-polar residues as green squares, and polar uncharged residues as circles.
Figure 2
Figure 2
Selective cytotoxic effect of ΔM4 in A375 cells. (a) Tumoral (▲) and non-tumoral cells (▼) were treated with different concentrations of peptide for 24 h, before being dyed with propidium iodide (PI) and analyzed by flow cytometry. The percentage of viable cells in tumoral A375 and non-tumoral HaCaT cell lines was determined by PI staining, where live cells exclude the dye and dead cells are positive for it. Values are expressed as the mean ± standard error of the mean (SEM) of three independent experiments. Two-way ANOVA presented the difference with respect to non-treated cells, where * p ≤ 0.05, *** p ≤ 0.001, and **** p ≤ 0.0001. (b) Membrane-permeabilization activity of the ΔM4 peptide in tumoral A375 cells assayed for PI uptake by flow cytometry. The histograms show a representative example of the mean fluorescence intensity (MFI) of the dye in each treatment.
Figure 3
Figure 3
Morphological characterization of A375 cells after ΔM4 treatment. Cells were treated with different concentrations of ΔM4 for 24 h. (a) Direct observation by differential interference contrast (DIC) microscopy; (b) Measurement of the cell size represented as the mean of the intensity of the signal detected by the forward scatter (FSC) parameter by flow cytometry; (c) Measurement of cell granularity represented as the mean of the intensity of the signal detected by the side scatter (SSC) parameter by flow cytometry. Data are expressed as the mean ± SEM of three independent experiments. One-way ANOVA revealed the difference with respect to non-treated cells, where * p ≤ 0.05, ** p ≤ 0.01, and *** p ≤ 0.001.
Figure 4
Figure 4
Effects of ∆M4 on the mitochondrial integrity of A375 cells. Cells were treated with different concentrations of ΔM4 for 24 h and subsequently analyzed by flow cytometry. (a) Mitochondrial membrane polarization was evaluated with DiOC6 uptake; the left panel shows a representative histogram for the increase in dye caption, and the bar graph expresses the mean ± SEM of MFI obtained in three independent experiments. (b) Mitochondrial ROS production quantification; the left panel shows a representative histogram for the increase in the fluorescent intensity of Mitotracker in A375 mitochondrion, and the bar graph expresses the mean ± SEM of MFI obtained in three independent experiments. One-way ANOVA revealed the difference with respect to non-treated cells, where * p ≤ 0.05.
Figure 5
Figure 5
Cell cycle distribution after ∆M4 exposure in melanoma skin cancer and non-tumoral cells. Cells were treated with different concentrations of ∆M4 for 24 h. (a) A375, melanoma cancer cells; (b) HaCaT, normal human keratinocyte cell line. The following are shown for each cell line: A representative histogram of flow cytometry analysis of the cell cycle distribution; bar graphs for quantification of the cell cycle distribution of the total cell population in the different phases of the cell cycle; and two-way ANOVA for sub-G1, G1, S, and G2/M populations, displaying the difference with respect to untreated cells, where ** p ≤ 0.01.
Figure 5
Figure 5
Cell cycle distribution after ∆M4 exposure in melanoma skin cancer and non-tumoral cells. Cells were treated with different concentrations of ∆M4 for 24 h. (a) A375, melanoma cancer cells; (b) HaCaT, normal human keratinocyte cell line. The following are shown for each cell line: A representative histogram of flow cytometry analysis of the cell cycle distribution; bar graphs for quantification of the cell cycle distribution of the total cell population in the different phases of the cell cycle; and two-way ANOVA for sub-G1, G1, S, and G2/M populations, displaying the difference with respect to untreated cells, where ** p ≤ 0.01.

References

    1. Cooper G.M., Hausman R.E. The Cell: A Molecular Approach. 4th ed. Sinauer Associates; Sunderland, MA, USA: 2007. The Development and Causes of Cancer; pp. 719–723.
    1. Fouad Y.A., Aanei C. Revisiting the hallmarks of cancer. Am. J. Cancer Res. 2017;7:1016. - PMC - PubMed
    1. Steward B., Wild C.P. World Cancer Report 2014. WHO Press; Geneva, Switzerland: 2014. pp. 16–69.
    1. Narayanan D.L., Saladi R.N., Fox J.L. Ultraviolet radiation and skin cancer. Int. J. Dermatol. 2010;49:978–986. doi: 10.1111/j.1365-4632.2010.04474.x. - DOI - PubMed
    1. Garnier-Suillerot A., Marbeuf-Gueye C., Salerno M., Loetchutinat C., Fokt I., Krawczyk M., Kowalczyk T., Priebe W. Analysis of drug transport kinetics in multidrug-resistant cells: Implications for drug action. Curr. Med. Chem. 2001;8:51–64. doi: 10.2174/0929867013373967. - DOI - PubMed

MeSH terms