. 2021 Mar;161(3):961-976.e22.
doi: 10.1016/j.jtcvs.2020.08.119. Epub 2020 Oct 8.

Hemodynamic and transcriptomic studies suggest early left ventricular dysfunction in a preclinical model of severe mitral regurgitation

Affiliations

Hemodynamic and transcriptomic studies suggest early left ventricular dysfunction in a preclinical model of severe mitral regurgitation

Daniella Corporan et al. J Thorac Cardiovasc Surg. 2021 Mar.

Abstract

Objective: Primary mitral regurgitation is a valvular lesion in which the left ventricular ejection fraction remains preserved for long periods, delaying a clinical trigger for mitral valve intervention. In this study, we sought to investigate whether adverse left ventricular remodeling occurs before a significant fall in ejection fraction and characterize these changes.

Methods: Sixty-five rats were induced with severe mitral regurgitation by puncturing the mitral valve leaflet with a 23-G needle using ultrasound guidance. Rats underwent longitudinal cardiac echocardiography at biweekly intervals and hearts explanted at 2 weeks (n = 15), 10 weeks (n = 15), 20 weeks (n = 15), and 40 weeks (n = 15). Sixty age- and weight-matched healthy rats were used as controls. Unbiased RNA-sequencing was performed at each terminal point.

Results: Regurgitant fraction was 40.99 ± 9.40%, with pulmonary flow reversal in the experimental group, and none in the control group. Significant fall in ejection fraction occurred at 14 weeks after mitral regurgitation induction. However, before 14 weeks, end-diastolic volume increased by 93.69 ± 52.38% (P < .0001 compared with baseline), end-systolic volume increased by 118.33 ± 47.54% (P < .0001 compared with baseline), and several load-independent pump function indices were reduced. Transcriptomic data at 2 and 10 weeks before fall in ejection fraction indicated up-regulation of myocyte remodeling and oxidative stress pathways, whereas those at 20 and 40 weeks indicated extracellular matrix remodeling.

Conclusions: In this rodent model of mitral regurgitation, left ventricular ejection fraction was preserved for a long duration, yet rapid and severe left ventricular dilatation, and biological remodeling occurred before a clinically significant fall in ejection fraction.

Keywords: ejection fraction; heart murmur; mitral regurgitation; mitral valve prolapse; neochordoplasty; primary mitral regurgitation; ventricular remodeling.


Conflict of interest statement

Conflict of Interest Statement

M.P. received consulting fees from Heart Repair Technologies, Inc, which did not have any role in this study. All other authors reported no conflicts of interest.

The Journal policy requires editors and reviewers to disclose conflicts of interest and to decline handling or reviewing manuscripts for which they may have a conflict of interest. The editors and reviewers of this article have no conflicts of interest.

Figures

FIGURE E1.
FIGURE E1.
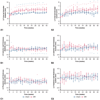
A1, Quantification of regurgitant jet area measured every 2 weeks in the MR (red) and sham (blue) group. A2, Regurgitant jet area normalized to left atrial area. A3, Regurgitant volume. B1, Longitudinal pulmonary venous flow systolic wave S-wave velocity. B2, Pulmonary venous flow systolic wave D-wave velocity. B3, Pulmonary venous flow systolic wave S/D wave ratio. Data are represented as mean ± standard deviation. Red stars represent a statistical significance in the MR group compared with MR baseline values (P < .05). MR, Mitral regurgitation.
FIGURE E2.
FIGURE E2.
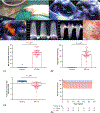
A1, and B1, Gross morphology of hearts that had a sham surgery (A1) or MR surgery (B1) after 40 weeks. A2 and B2, Long-axis B-mode images of the left ventricle at 40 weeks. A3 and B3, Long-axis M-mode images of the left ventricle at 40 weeks. MR, Mitral regurgitation.
FIGURE E3.
FIGURE E3.
A, Left ventricular internal diameter at diastole (A1) and systole (A2) measured every 2 weeks in the MR and sham groups. B, Anterior wall thickness at diastole (B1) and systole (B2). C, Posterior wall thickness at diastole (C1) and systole (C2). Data are represented as median and interquartile range. Blue stars represent statistical significance between the MR and sham group at the same time point (P <.05). Red stars represent statistical significance between the MR group and the MR baseline value (P < .05). LV, Left ventricle; MR, mitral regurgitation.
FIGURE 1.
FIGURE 1.
Top row, Schematic depicting the study design and sample sizes used in each group. Bottom row, Salient findings from the study describing the effect of mitral regurgitation on the function, structure and transcriptome of the left ventricular myocardium.
FIGURE 2.
FIGURE 2.
Rodent model of severe MR using an image-guided needle technique to puncture the mitral valve leaflet. A1, The animal is placed in right decubitus position, with an intracardiac ultrasound probe inserted into the esophagus to enable transesophageal imaging. A2, Ultrasound image depicting a needle inserted into the beating heart via the ventricular apex. A3,With ultrasound guidance, the needle tip is advanced into the mitral valve leaflet to perforate it. B1-B3, Induction of MR is validated in real time using color Doppler imaging of the regurgitant jet, pulsed-wave Doppler of flow reversal, and pulmonary vein flow reversal. B4, In a representative rat heart explanted at the end of the experiment, the perforation in the anterior leaflet is depicted. The hole is defined and matches the size of the needle. C1, Severe MR was confirmed in all the ratsat 2 weeks after thesurgery. The severity of regurgitation is quantified hereby measuring the areaofthe MRjet and normalizing it to the left atrial area. C2, Regurgitant volume was also calculated using the Doppler data obtained from the rodents and using the area of the regurgitant orifice, confirming with another technique that the mitral regurgitation is severe. C3, An indirect approach to confirming the severity of regurgitation is depicted, wherein reversal of the pulmonary vein flow due to acute elevation of the left atrial pressure from regurgitation is noted. The S/D ratio is positive in the sham animals, whereas it is reversed in the rats with mitral regurgitation. C4, Survivalcurves are presented for the rats that completed 40weeks of follow-up in both the MR and sham groups. The color-shaded area represents the 95% confidence limits. MR, Mitral regurgitation; S/D, systolic-diastolic.
FIGURE 3.
FIGURE 3.
Longitudinal changes in cardiac function in the sham-operated rats and those induced with severe MR. A1, EDV was significantly elevated in the MR group as early as 4 weeks after inducing the valve lesion and remained significantly elevated throughout the follow-on duration. A2, The rate of change of EDV was greatest in the earliest time period after inducing MR, and plateauing around 8 weeks after inducing the valve lesion. From weeks 8 to 40, the rate of change of EDV was minimal. B1, Similar trends were observed in the changes in ESV, with a rise in ESV occurring at 8 weeks after induction of mitral regurgitation. C1-2, Absolute changes and rate of change of stroke volume. D1-2, Longitudinal changes in ejection fraction, with a significant fall in ejection fraction occurring at 12 weeks after inducing MR. The largest rate of change was also observed within the first 10 weeks and plateaued thereafter. In the graphs, the marker indicates the mean and the shaded region represents the standard deviation. Blue stars below the horizontal axes represent statistical significance when the group means were compared at the same time point (P < .05). Red stars below the horizontal axes indicates statistical significance when comparing the mean value at that time point, to the mean value at baseline in the same group (P < .05). EDV, End-diastolic volume; ESV, end-systolic volume; MR, mitral regurgitation.
FIGURE 3.
FIGURE 3.
Longitudinal changes in cardiac function in the sham-operated rats and those induced with severe MR. A1, EDV was significantly elevated in the MR group as early as 4 weeks after inducing the valve lesion and remained significantly elevated throughout the follow-on duration. A2, The rate of change of EDV was greatest in the earliest time period after inducing MR, and plateauing around 8 weeks after inducing the valve lesion. From weeks 8 to 40, the rate of change of EDV was minimal. B1, Similar trends were observed in the changes in ESV, with a rise in ESV occurring at 8 weeks after induction of mitral regurgitation. C1-2, Absolute changes and rate of change of stroke volume. D1-2, Longitudinal changes in ejection fraction, with a significant fall in ejection fraction occurring at 12 weeks after inducing MR. The largest rate of change was also observed within the first 10 weeks and plateaued thereafter. In the graphs, the marker indicates the mean and the shaded region represents the standard deviation. Blue stars below the horizontal axes represent statistical significance when the group means were compared at the same time point (P < .05). Red stars below the horizontal axes indicates statistical significance when comparing the mean value at that time point, to the mean value at baseline in the same group (P < .05). EDV, End-diastolic volume; ESV, end-systolic volume; MR, mitral regurgitation.
FIGURE 4.
FIGURE 4.
A, Representative pressure–volume loops obtained at the time of termination in each group of animals. The blue line represents the loop from the sham group of animals, the red line indicates the loop at 2 weeks after inducing mitral regurgitation, the green line indicates the loop at 10 weeks after inducing mitral regurgitation, the yellow line indicates the loop at 20 weeks after inducing mitral regurgitation, and the cyan line indicates 40 weeks after inducing mitral regurgitation. A right ward shift was observed in all of the loops from rats with MR compared with the sham group; however, a distinctly large shift was observed in the loops at 20 and 40 weeks. B, The PVA that represents the total mechanical work performed to eject blood in each heartbeat is increased in the MR groups at 20 and 40 weeks compared with the sham group of animals. C, SW, which is the area enclosed within each loop, is representative of the external work done by the ventricle to eject blood into the aorta. SW was increased at 20 and 40 weeks after induction of MR, compared with the sham. D, Depiction of the elastic PE stored in the myocardium at the end of systolic contraction. PE was initially reduced with the onset of MR but rose linearly beyond the initial dip. E, Left ventricular pumping efficiency was significantly reduced at later stages of MR when compared with the sham group. Data are represented as box and whisker plots, the middle line representing the median, the upper and lower borders representing the upper and lower quartiles, and the upper and lower whiskers represent maximum and minimum values. MR, Mitral regurgitation; PVA, pressure volume loop area; SW, stroke work; PE, potential energy.
FIGURE 5.
FIGURE 5.
Systolic indices derived from PV loops in the mitral regurgitation (red) and sham (blue). A, ESP, which represents the maximum pressure generated by the left ventricle, was significantly reduced in the mitral regurgitation group at multiple time points compared with the sham animals. B, Maximum rate of change of pressure was relatively equivalent between the groups, except at the 10 week time point. C, Ees, which is an indicator of contractility of the myocardium, was significantly reduced at the 10, 20, and 40 weeks in the mitral regurgitation group compared with the sham group at the same time point. D, Preload adjusted dP/dt max, which is a measure of contractility after correction for preload, was significantly reduced in the mitral regurgitation group at multiple time points. E, PRSW, and F, preload recruitable pressure volume area were not different between the groups. Data are represented as box and whisker plots, where the middle line represents the median, the upper and lower borders represent the upper and lower quartiles, and the upper and lower whiskers represent maximum and minimum values. *P < .05. ESP, End-systolic pressure; Ees, End-systolic elastance; EDV, end-diastolic volume; PRSW, preload recruitable stroke work; PVA, pressure volume loop area.
FIGURE 6.
FIGURE 6.
Diastolic and ventriculo-arterial coupling in dicesderived from pressure volume loops in the mitral regurgitation (red) and sham (blue) groups. A, EDP that is indicative of the filling pressures or the extent of congestion in the left ventricular chamber demonstrated a biphasic trend. A rise in the EDP was observed initially at 2 weeks due to the severe mitral regurgitation but was reduced thereafter owed to the dilatation of the chamber. The end diastolic pressure was elevated again at 20 weeks, potentially indicating changes in myocardial properties that reduce ventricular distensibility. B, EDPVR and C, minimum dP/dt, which are indicative of diastolic function, were not different between thegroups. D, Tau Glantz(Tau G), E, Ea and F, Ees/Ea were also not different between the groups except at very late stages of 40 weeks. Data are represented as box and whisker plots, where the middle line represents the median, the upper and lower borders represent the upper and lower quartiles, and the upper and lower whiskers represent maximum and minimum values. *P < .05. EDP, Enddiastolic pressure; EDPVR, end-diastolic pressure volume relationship; Ea, arterial elastance; Ees/Ea, ventriculo-arterial elastance ratio.
FIGURE 7.
FIGURE 7.
Volcano plots showing the distribution of significantly altered genes (left), summary of gene expression after MR surgery compared with sham displayed in heat maps (left middle), principle component analysis (right middle), and top 25 Gene Ontology terms (right) in the (A) MR 2-week, (B) MR 10-week, (C) MR 20-week, and (D) MR 40-week groups. MR, Mitral regurgitation.

Comment in

References

    1. Nkomo VT, Gardin JM, Skelton TN, Gottdiener JS, Scott CG, Enriquez-Sarano M. Burden of valvular heart diseases: a population-based study. Lancet. 2006;368:1005–11. - PubMed
    1. Apostolidou E, Maslow AD, Poppas A. Primary mitral valve regurgitation: update and review. Glob Cardiol Sci Pract. 2017;3:1–17. - PMC - PubMed
    1. Levine RA, Hagege AA, Judge DP, Padala M, Dal-Bianco JP, Aikawa E, et al.Mitral valve disease—morphology and mechanisms. Nat Rev Cardiol. 2015; 12:689–710. - PMC - PubMed
    1. Braunwald E, Welch GH, Sarnoff SJ. Hemodynamic effects of quantitativelyvaried experimental mitral regurgitation. Circ Res. 1957;5:539–45. - PubMed
    1. Carabello BA, Crawford FA. Valvular heart disease. N Engl J Med. 1997;337: 32–41. - PubMed

Publication types

MeSH terms