. 2021 Feb;9(2):184-199.
doi: 10.1158/2326-6066.CIR-20-0384. Epub 2020 Dec 4.

Pharmacologic Screening Identifies Metabolic Vulnerabilities of CD8+ T Cells

Affiliations

Pharmacologic Screening Identifies Metabolic Vulnerabilities of CD8+ T Cells

Jefte M Drijvers et al. Cancer Immunol Res. 2021 Feb.

Abstract

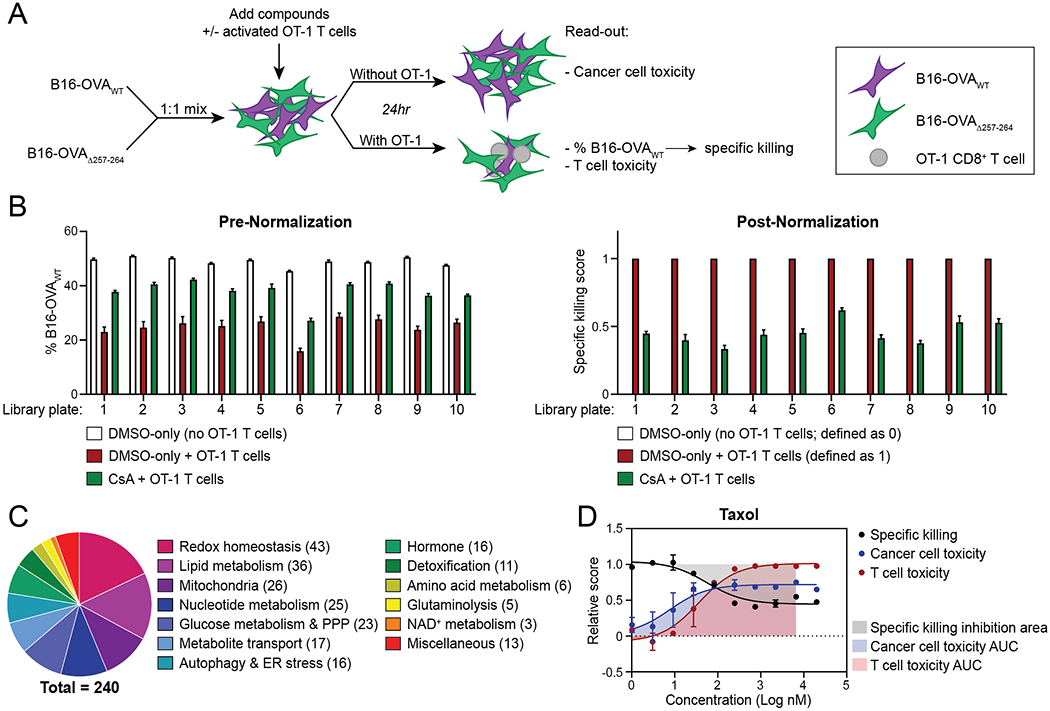
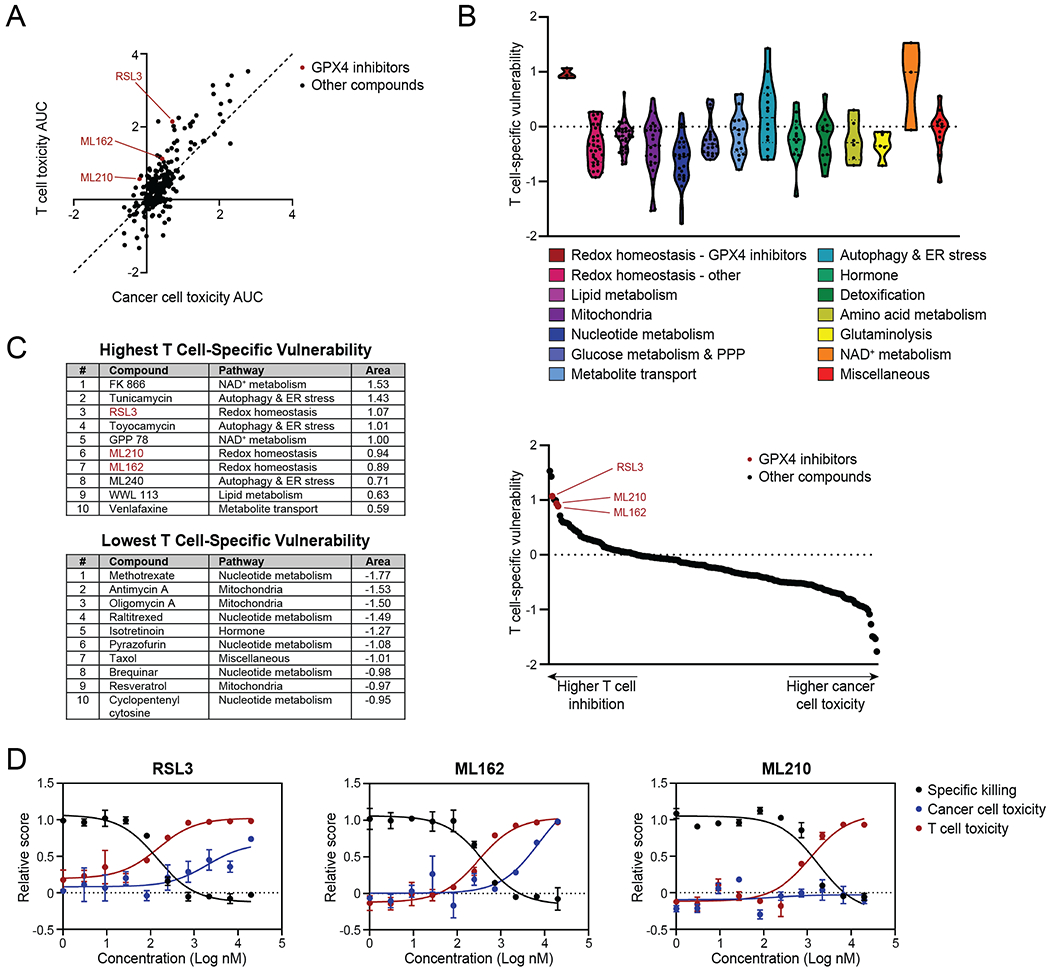
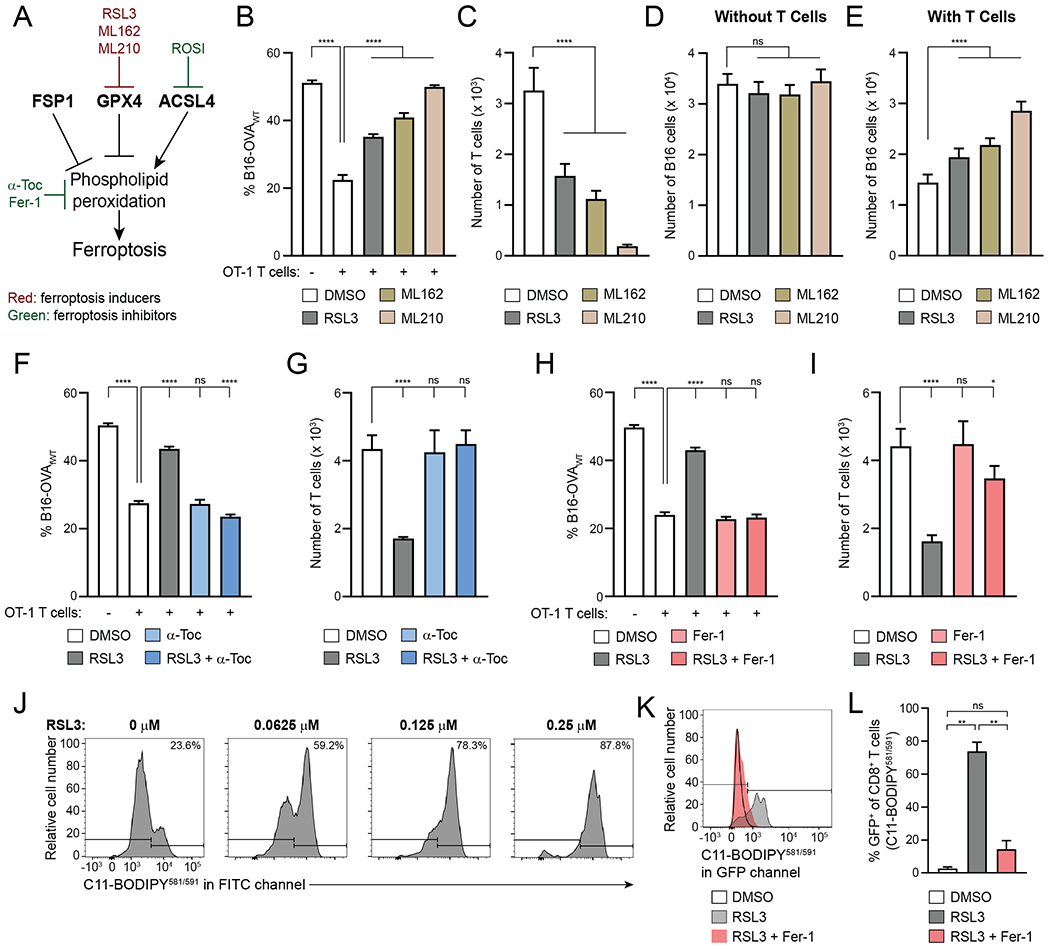
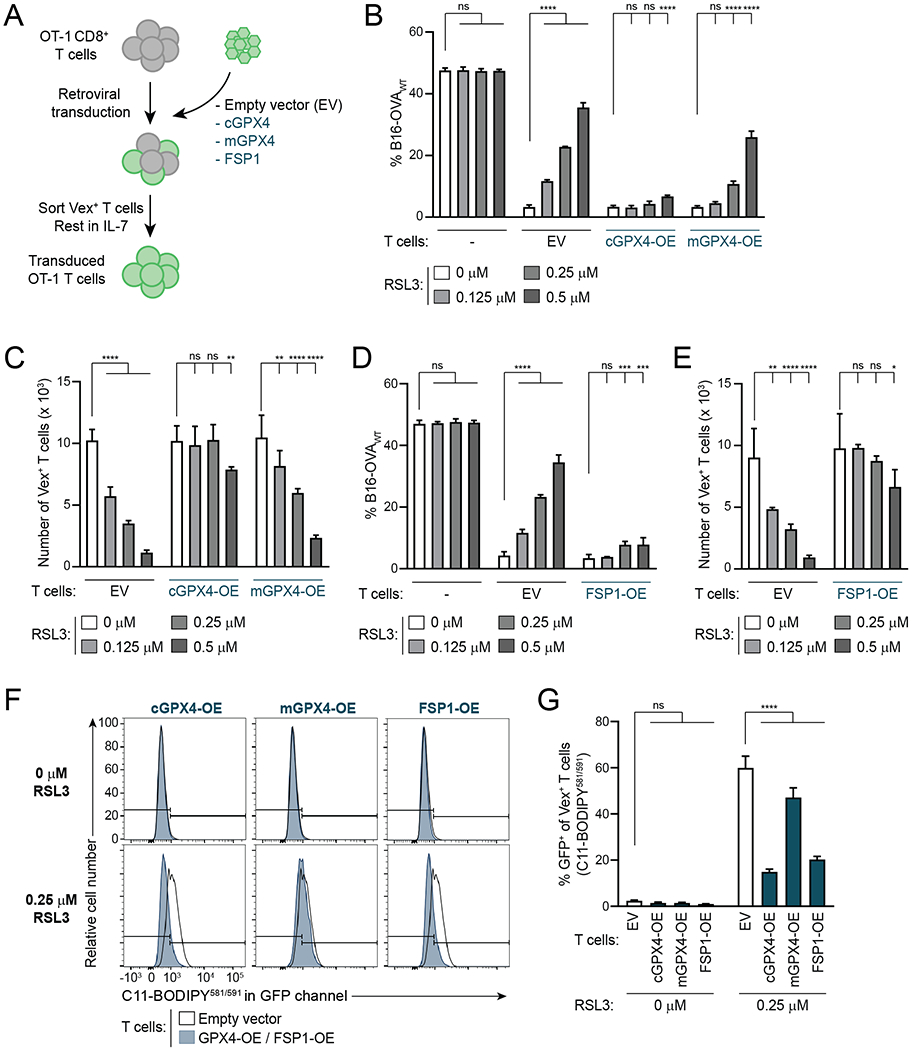
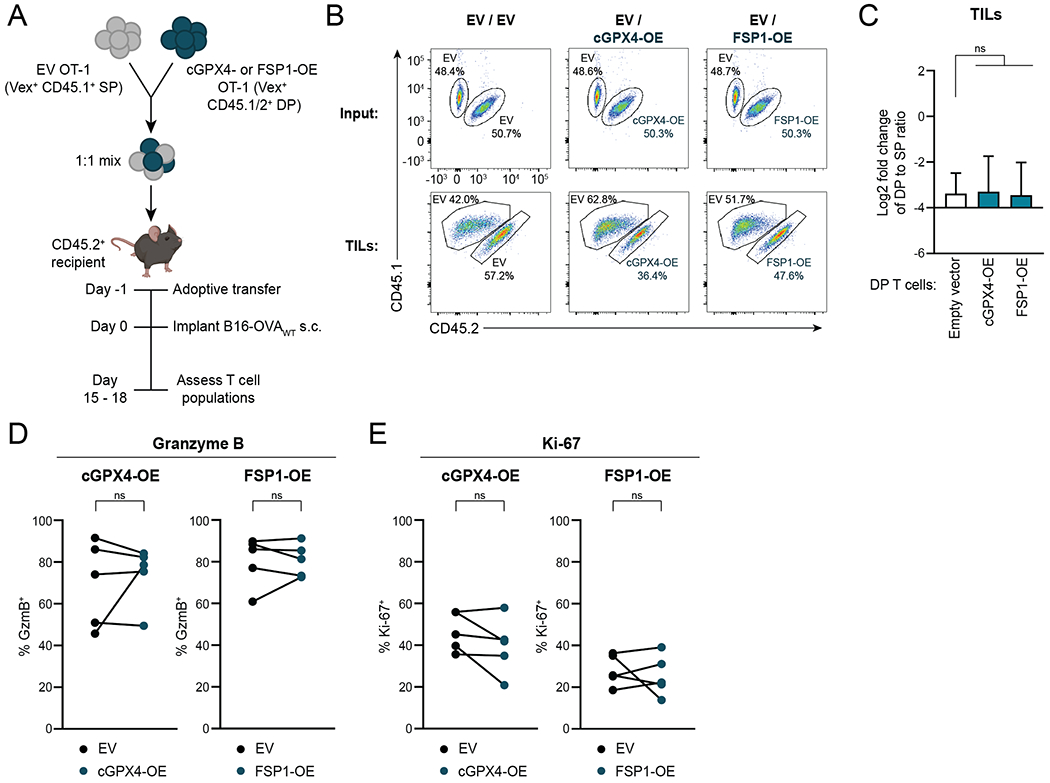
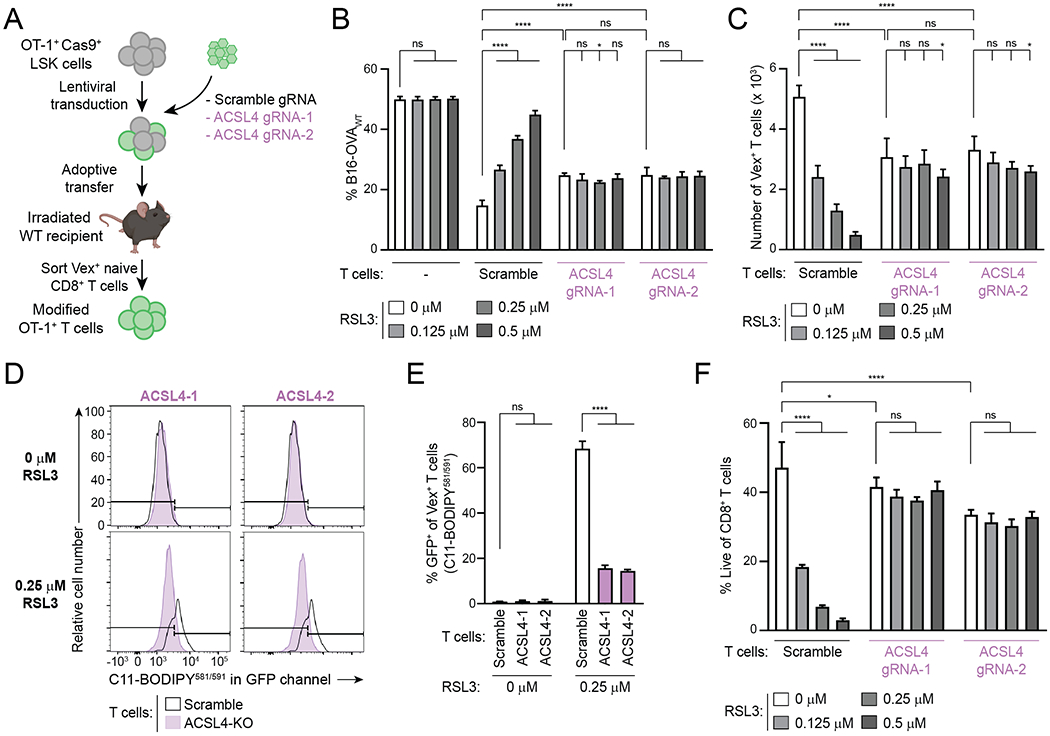
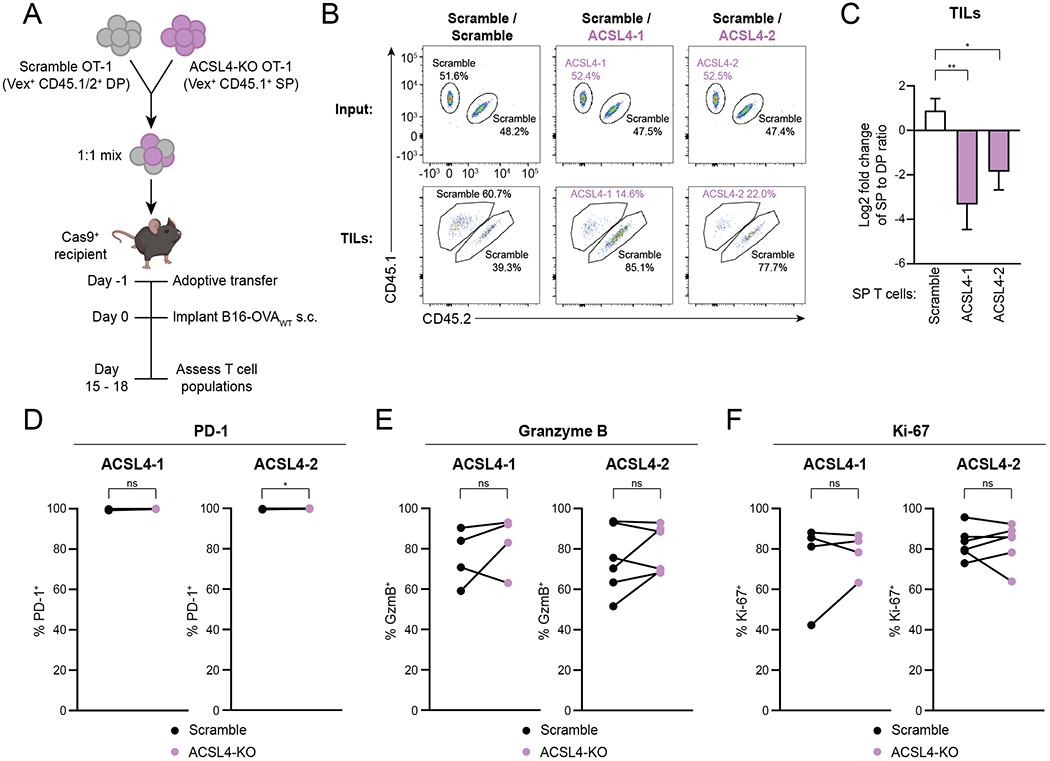
Metabolic constraints in the tumor microenvironment constitute a barrier to effective antitumor immunity and similarities in the metabolic properties of T cells and cancer cells impede the specific therapeutic targeting of metabolism in either population. To identify distinct metabolic vulnerabilities of CD8+ T cells and cancer cells, we developed a high-throughput in vitro pharmacologic screening platform and used it to measure the cell type-specific sensitivities of activated CD8+ T cells and B16 melanoma cells to a wide array of metabolic perturbations during antigen-specific killing of cancer cells by CD8+ T cells. We illustrated the applicability of this screening platform by showing that CD8+ T cells were more sensitive to ferroptosis induction by inhibitors of glutathione peroxidase 4 (GPX4) than B16 and MC38 cancer cells. Overexpression of ferroptosis suppressor protein 1 (FSP1) or cytosolic GPX4 yielded ferroptosis-resistant CD8+ T cells without compromising their function, while genetic deletion of the ferroptosis sensitivity-promoting enzyme acyl-CoA synthetase long-chain family member 4 (ACSL4) protected CD8+ T cells from ferroptosis but impaired antitumor CD8+ T-cell responses. Our screen also revealed high T cell-specific vulnerabilities for compounds targeting NAD+ metabolism or autophagy and endoplasmic reticulum (ER) stress pathways. We focused the current screening effort on metabolic agents. However, this in vitro screening platform may also be valuable for rapid testing of other types of compounds to identify regulators of antitumor CD8+ T-cell function and potential therapeutic targets.


Figures

Figure 1.
Figure 1.. Development of a Platform for Pharmacologic Screening of Anti-Tumor CD8+ T-Cell Function
A, Schematic depicting experimental setup used for pharmacologic screening. B, Average read-outs for T cell–mediated specific killing before and after normalization, as indicated by average % B16-OVAWT and average specific killing score among control wells of each assay plate respectively. C, Numbers of compounds in the Ludwig Metabolic Library targeting indicated metabolic pathways. D, Dose-response curve displaying T cell–mediated specific killing, cancer-cell toxicity and T-cell toxicity of taxol at the indicated concentrations. Graphs display mean +/− SD. n=8 (B,C) or n=2 (D) technical replicates per condition. CsA, Cyclosporin A. PPP, pentose-phosphate pathway. ER, endoplasmic reticulum.
Figure 2.
Figure 2.. Pharmacologic Screening Identifies Vulnerability of CD8+ T Cells to GPX4 Inhibitors
A, Plot showing T-cell toxicity AUC and cancer-cell toxicity AUC, highlighting GPX4 inhibitors. Dashed line represents y=x function. Each dot represents one compound. B, Violin plots of T cell–specific vulnerability for each compound, organized by pathway. Each dot represents one compound, dashed lines indicate medians, dotted lines indicate quartiles. C, Tables showing the top 10 highest and lowest library compounds by T cell–specific vulnerability (left) and plot showing library compounds ranked by this parameter (right). D, Dose-response curves displaying specific killing, cancer-cell toxicity and T-cell toxicity of RSL3, ML162 and ML210 at the indicated concentrations. Graphs display mean +/− SD. n=2 technical replicates per condition. PPP, pentose phosphate pathway. ER, endoplasmic reticulum.
Figure 3.
Figure 3.. GPX4 Inhibitors Selectively Induce Ferroptosis in CD8+ T Cells
A, Schematic displaying (inhibitors of) enzymes that regulate lipid peroxidation and ferroptosis. B–E, Killing assay with B16-OVAWT and B16-OVAΔ257-264 cells in the presence of 0.25 μM RSL3, 0.74 μM ML162, 2.2 μM ML210 or DMSO control, showing % B16-OVAWT (B), number of T cells (C), and total number of B16 cells in wells without (D) or with (E) T cells at end of assay. n=5-10 technical replicates per condition. Statistical significance determined by one-way ANOVA. F–I, Killing assay with B16-OVAWT and B16-OVAΔ257-264 cells with or without 0.25 μM RSL3, 100 μM α-Toc (F,G) and/or 1 μM Fer-1 (H,I), showing % B16-OVAWT (F,H) and number of T cells at end of assay (G,I). n=4 technical replicates per condition. Statistical significance determined by one-way ANOVA. J, C11-BODIPY581/591 staining of CD8+ T cells that were activated for 4 days and then treated with indicated concentrations of RSL3 for 24hr. K,L, Representative examples (K) and quantification (L) of C11-BODIPY581/591 staining of CD8+ T cells that were activated for three days and then treated for 24hr with 0.25 μM RSL3 with or without 1 μM Fer-1. n=2 technical replicates per condition. Statistical significance determined by one-way ANOVA. *p<0.05 **p<0.01 ***p<0.001 ****p<0.0001. ns, not significant. Graphs display mean +/− SD. α-Toc, α-tocopherol vitamin E. Fer-1, ferrostatin-1. ROSI, rosiglitazone. Data representative of ≥2 independent experiments.
Figure 4.
Figure 4.. Overexpression of FSP1 or Cytosolic GPX4 Reduces Ferroptosis Sensitivity in CD8+ T Cells
A, Schematic depicting generation of GPX4- and FSP1-OE OT-1 CD8+ T cells. B–E, Specific killing (B,D) and T cell numbers (C,E) at the end of killing assays with GPX4-OE (B,C) or FSP1-OE (D,E) OT-1 T cells and EV control OT-1 T cells. n=2-6 technical replicates per condition. Statistical significance determined by two-way ANOVA. F,G, Representative examples (F) and quantification (G) of C11-BODIPY581/591 staining of OT-1 EV, GPX4-OE and FSP1-OE T cells treated with indicated concentrations of RSL3 for 24hr after 72hr activation. Flow plots in F compare each condition to the same EV control sample. n=3-4 technical replicates per condition. Statistical significance determined by two-way ANOVA. *p<0.05 **p<0.01 ***p<0.001 ****p<0.0001. ns, not significant. Graphs display mean +/− SD. Data representative of ≥2 independent experiments.
Figure 5.
Figure 5.. Overexpression of cGPX4 or FSP1 Does Not Affect CD8+ T cell Anti-Tumor Function In Vivo
A, Schematic depicting adoptive transfer experiment. The mouse image was created using BioRender.com. B,C, Representative plots (B) and quantification (C) of flow cytometric measurement of the change in ratio of CD45.1/2 DP to CD45.1 SP among Vex+ CD8+ T cells in B16-OVAWT tumors compared to input. Tumors were harvested for analysis on day 15 to 18 after implantation. Ratio fold-change calculated as (DP:SP)TIL / (DP:SP)input. n=5-8 animals per group. Statistical significance determined by one-way ANOVA. D,E, Percentages of Vex+ CD8+ T cells expressing GzmB (D) and Ki-67 (E) as measured by flow cytometry after tumor harvest. n=5 mice per group. Statistical significance determined by paired t tests. SP, CD45.1 single-positive. DP, CD45.1/2 double-positive. *p<0.05 **p<0.01 ***p<0.001 ****p<0.0001. ns, not significant. Graphs display mean +/− SD. Data representative of ≥2 independent experiments. TIL, tumor-infiltrating lymphocyte.
Figure 6.
Figure 6.. ACSL4 Promotes Ferroptosis Sensitivity in CD8+ T Cells
A, Schematic depicting generation of ACSL4-deficient OT-1 CD8+ T cells using CHIME. The mouse image was created using BioRender.com. B,C, Specific killing (B) and T cell numbers (C) at the end of a killing assay with ACSL4-targeting gRNA-transduced OT-1 T cells and scramble gRNA control OT-1 T cells. n=4 technical replicates per condition. Statistical significance determined by two-way ANOVA. D,E, Representative examples (D) and quantification (E) of C11-BODIPY581/591 staining of OT-1 T cells transduced with ACSL4 gRNA-1 (ACSL4-1), ACSL4 gRNA-2 (ACSL4-2) or scramble gRNAs and treated with indicated concentrations of RSL3 for 24hr after 72hr activation. Flow plots in (D) compare each condition to the same scramble control sample. n=2–3 technical replicates per condition. Statistical significance determined by two-way ANOVA. F, Viability of OT-1 CD8+ T cells after 24hr culture with the indicated concentrations of RSL3, following a 72hr activation, as determined by flow cytometry. n=3 technical replicates per condition. Statistical significance determined by two-way ANOVA. *p<0.05 **p<0.01 ***p<0.001 ****p<0.0001. ns, not significant. Graphs display mean +/− SD. Data representative of ≥2 independent experiments. LSK, Lineage Sca-1+ Kit+. WT, wildtype. gRNA, guide RNA. KO, knockout.
Figure 7.
Figure 7.. ACSL4 Deficiency Impairs Anti-Tumor CD8+ T Cells In Vivo
A, Schematic depicting adoptive transfer experiment. The mouse image was created using BioRender.com. B,C, Representative plots (B) and quantification (C) of flow cytometric measurement of the change in ratio of CD45.1 SP to CD45.1/2 DP among Vex+ CD8+ T cells in B16-OVAWT tumors compared to input. Tumors were harvested for analysis on day 15 to 18 after implantation. Ratio fold-change calculated as (SP:DP)TIL / (SP:DP)input. n=2 animals for scramble control and n=5 animals for each ACSL4-KO group. Statistical significance determined by one-way ANOVA. Data representative of 2 independent experiments. D–F, Percentages of Vex+ CD8+ T cells expressing PD-1 (D), GzmB (E) and Ki-67 (F) as measured by flow cytometry after tumor harvest. n=4–6 mice per group. Statistical significance determined by paired t tests. Data pooled from 2 independent experiments. SP, CD45.1 single-positive. DP, CD45.1/2 double-positive. *p<0.05 **p<0.01 ***p<0.001 ****p<0.0001. ns, not significant. Graphs display mean +/− SD. TIL, tumor-infiltrating lymphocyte.

References

    1. Farhood B, Najafi M, Mortezaee K. CD8+ cytotoxic T lymphocytes in cancer immunotherapy: A review. J Cell Physiol. 2019;234:8509–21. - PubMed
    1. Waldman AD, Fritz JM, Lenardo MJ. A guide to cancer immunotherapy: from T cell basic science to clinical practice. Nat Rev Immunol. 2020; - PMC - PubMed
    1. LaFleur MW, Muroyama Y, Drake CG, Sharpe AH. Inhibitors of the PD-1 Pathway in Tumor Therapy. J Immunol. 2018;200:375–83. - PMC - PubMed
    1. June CH, O’Connor RS, Kawalekar OU, Ghassemi S, Milone MC. CAR T cell immunotherapy for human cancer. Science. 2018;359:1361–5. - PubMed
    1. Dougan M, Dranoff G, Dougan SK. Cancer Immunotherapy: Beyond Checkpoint Blockade. Annu Rev Cancer Biol. 2019;3:55–75. - PMC - PubMed

Publication types

Substances