. 2020 Dec 4;6(49):eabb8680.
doi: 10.1126/sciadv.abb8680. Print 2020 Dec.

Oligodendroglial glycolytic stress triggers inflammasome activation and neuropathology in Alzheimer's disease

Affiliations

Oligodendroglial glycolytic stress triggers inflammasome activation and neuropathology in Alzheimer's disease

Xinwen Zhang et al. Sci Adv. .

Abstract

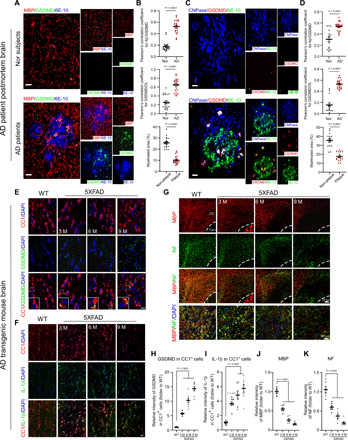
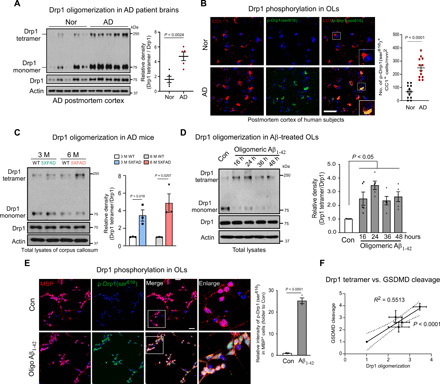
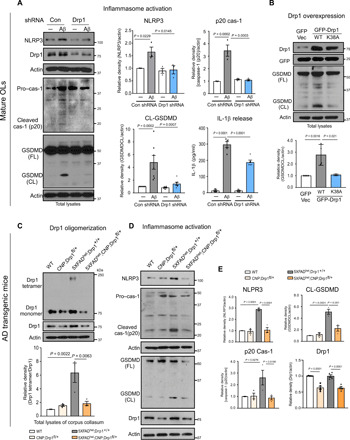
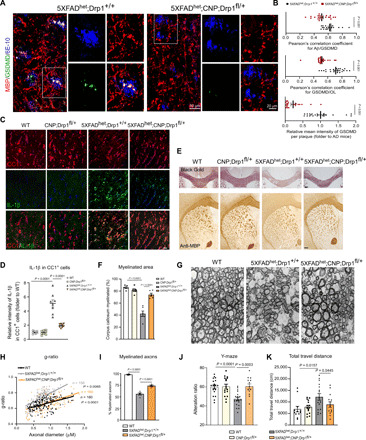
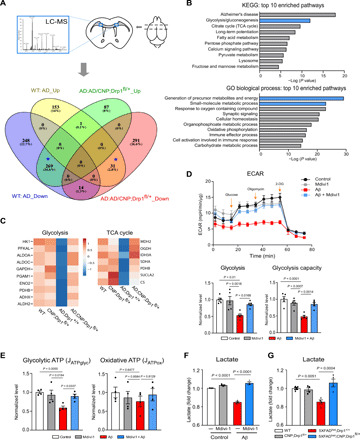
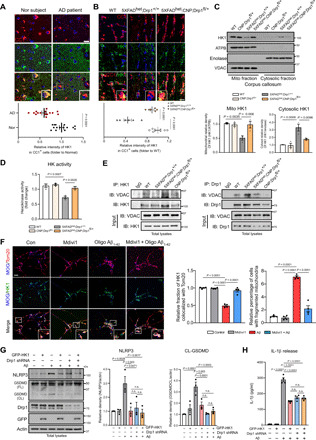
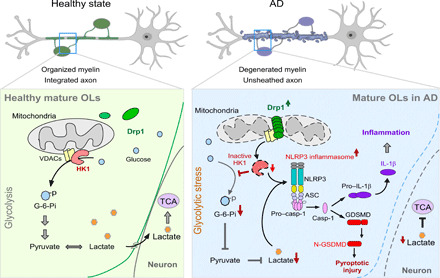
Myelin degeneration and white matter loss resulting from oligodendrocyte (OL) death are early events in Alzheimer's disease (AD) that lead to cognitive deficits; however, the underlying mechanism remains unknown. Here, we find that mature OLs in both AD patients and an AD mouse model undergo NLR family pyrin domain containing 3 (NLRP3)-dependent Gasdermin D-associated inflammatory injury, concomitant with demyelination and axonal degeneration. The mature OL-specific knockdown of dynamin-related protein 1 (Drp1; a mitochondrial fission guanosine triphosphatase) abolishes NLRP3 inflammasome activation, corrects myelin loss, and improves cognitive ability in AD mice. Drp1 hyperactivation in mature OLs induces a glycolytic defect in AD models by inhibiting hexokinase 1 (HK1; a mitochondrial enzyme that initiates glycolysis), which triggers NLRP3-associated inflammation. These findings suggest that OL glycolytic deficiency plays a causal role in AD development. The Drp1-HK1-NLRP3 signaling axis may be a key mechanism and therapeutic target for white matter degeneration in AD.


Figures

Fig. 1
Fig. 1. Mature OLs undergo GSDMD-marked pyroptotic injury and inflammation.
(A) Postmortem cortex brain sections from normal (Nor) subjects and AD patients (Table 1) were stained with anti-MBP, anti-GSDMD, and anti–6E-10 antibodies. (B) Quantification: (top) colocalization of GSDMD and Aβ plaques; (middle) localization of GSDMD in MBP+ OLs; (bottom) the area covered by MBP+ OLs in Aβ plaques and non-Aβ plaque area. Student’s t test. (C) Postmortem cortex brain sections from normal subjects and AD patients were stained with anti-CNPase, anti-GSDMD, and anti–6E-10 antibodies. (D) Quantification: (top) the colocalization of GSDMD in Aβ plaques; (middle) the localization of GSDMD in CNPase+ OLs; (bottom) the area covered by CNPase+ OLs in Aβ plaques and non-Aβ plaque area. Student’s t test. Note: To quantify the colocalization of proteins, Pearson’s correlation coefficient of two proteins per 45,000 μm2 was determined using ImageJ plug-in JaCoP. Fifteen to 21 images per group were analyzed. The brains of WT and 5XFAD mice were harvested at the ages of 3, 6, and 9 months (M). Brain sections were stained with (E) anti-GSDMD (green) and anti-CC1 (a marker of mature OL, red) antibodies, (F) anti–IL-1β (green) and anti-CC1 (red), and (G) anti-neurofilament (NF, green) and anti-MBP (red). n = 3 to 5 mice per group. The histogram shows the intensities of GSDMD (H) and IL-1β (I) in the CC1+ OLs, and the intensities of MBP (J) and NF (K) in the corpus callosum of mice. Scale bar, 20 μm. The data were compared by one-way analysis of variance (ANOVA) with Tukey’s post hoc test. All data are expressed as the means ± SEM.
Fig. 2
Fig. 2. Drp1 hyperactivation in mature OLs of AD models.
(A) Total protein lysates were harvested from the frozen postmortem cortex of AD patients and control subjects (Table 2). Western blot analysis was performed in the absence of 2-mercaptoethanol (β-ME) to examine Drp1 oligomers. Histogram: the relative density of Drp1 tetramer versus Drp1 monomer is shown. Student’s t test. (B) Postmortem cortex sections from normal subjects and AD patients (Table 1) were stained with anti–p-Drp1 Ser616 and anti-CC1 antibodies. Scale bar, 50 μm. The number of p-Drp1 Ser616+ CC1+ cells per square millimeter was quantified and is presented in the histogram. Student’s t test. (C) Total protein lysates from the corpus callosum of WT and 5XFAD mouse brains were harvested at the ages of 3 and 6 months. Drp1 tetramer was analyzed by Western blot analysis in the absence of β-ME. The relative density of Drp1 tetramer versus the Drp1 monomer is shown in the histogram. n = 3 mice per group. Student’s t test. (D) Mature OLs were differentiated from OPCs and exposed to oligomeric Aβ1-42 for the indicated periods. Drp1 tetramer was analyzed by Western blot analysis of total protein lysates in the absence of β-ME. The relative density of Drp1 tetramer versus the Drp1 monomer is shown in the histogram. The data from five independent experiments were analyzed using one-way ANOVA with Tukey’s post hoc test. (E) Mature OLs were treated with oligomeric Aβ1-42 for 24 hours and stained with anti–p-Drp1 Ser616 (green) and anti-MBP (red) antibodies. The intensity of p-Drp1Ser616 in the MBP+OLs was quantitated and is presented in the histogram. The data from three independent experiments were compared using the Student’s t test. Scale bar, 20 μm. (F) A linear correlation between the relative Drp1 tetramer density and the cleavage of GSDMD is shown. All data are expressed as the mean ± SEM.
Fig. 3
Fig. 3. Suppression of Drp1 hyperactivation attenuates NLRP3-dependent inflammasome activation and GSDMD-mediated pyroptotic injury in cell culture and AD mice.
(A) Mature OLs were infected with lentivirus encoding Drp1 or control shRNA for 48 hours and maintained in the cell culture medium with puromycin (1 μg/ml), followed by treatment with oligomeric Aβ1-42 (5 μM) for 24 hours. Western blot analysis of total protein lysates was carried out with the indicated antibodies. The densities of NLRP3, cleaved caspase-1, and GSDMD relative to actin are shown in the histograms. The released IL-1β into the medium was measured by ELISA. The data from at least three independent experiments were analyzed. (B) Total lysates of mature OLs expressing GFP control vector (GFP Vec), GFP-Drp1 WT (WT), or GFP-Drp1 K38A (K38A) were subjected to Western blot analysis with anti-GSDMD antibody. The density of GSDMD cleavage relative to actin is shown in the histogram. The data are from four independent experiments. Total brain lysates were harvested from 6-month-old WT, CNP;Drp1fl/+, 5XFADhet;Drp1+/+, and 5XFADhet;CNP;Drp1fl/+ mice. n = 3 to 5 mice per group. (C) Drp1 tetramer was analyzed by Western blot analysis in the absence of β-ME. The relative density of Drp1 tetramer versus the Drp1 monomer is shown in the histogram. (D) Western blot analysis of mouse corpus callosum lysates was carried out with the indicated antibodies. (E) The densities of Drp1, NLRP3, cleaved caspase-1, and GSDMD (CL) relative to actin are shown in the histograms. All the data are expressed as the mean ± SEM and compared by one-way ANOVA with Tukey’s post hoc test.
Fig. 4
Fig. 4. Mature OL-specific Drp1 heterozygous knockout is protective in 5XFAD mice.
(A) Brain sections containing the corpus callosum from 6-month-old 5XFADhet;Drp1+/+ and 5XFADhet;CNP;Drp1fl/+ mice were stained with anti-GSDMD, anti-MBP, and anti-6E10 antibodies. (B) The colocalization of GSDMD and Aβ plaques (top) and the localization of GSDMD in MBP+OLs (middle) were quantified. The intensity of GSDMD in the Aβ plaque area was analyzed (lower). n = 3 to 4 mice per group. (C) Brain sections from 6-month-old WT, CNP;Drp1fl/+, 5XFADhet;Drp1+/+, and 5XFADhet;CNP;Drp1fl/+ mice were stained with anti–IL-1β (green) and anti-CC1 (red) antibody for immunofluorescence analysis. n = 4 mice per group. Scale bar, 20 μm. (D) The intensity of IL-1β in CC1+OLs was quantified. (E) Mouse brain sections were stained with the Black Gold II myelin staining kit (top) and anti-MBP for immunohistochemistry analysis (bottom). Scale bar, 200 μm. (F) The area of positive anti-MBP staining was quantified and is presented in the histogram. (G) The corpus callosum of each mouse of the indicated genotypes was harvested for TEM analysis. (H) The g-ratio of the myelin of the mice was measured. (I) The percentage of myelinated axons was quantified. (J) Cognitive activity was assessed in 6-month-old mice using the Y-maze. Nine female and 10 male WT, 8 female and 8 male CNP;Drp1fl/+, 9 female and 10 male 5XFADhet;Drp1+/+, and 7 female and 6 male 5XFADhet;CNP;Drp1fl/+ mice were used. (K) Movement activity was assessed in 6-month-old mice using the open-field chamber. The total travel distance of mice is shown. Six female and 6 male WT, 8 female and 7 male CNP;Drp1fl/+, 8 female and 8 male 5XFADhet;Drp1+/+, and 7 female and 7 male 5XFADhet;CNP;Drp1fl/+ mice were used. All the data are expressed as the mean ± SEM and compared by one-way ANOVA with Tukey’s post hoc test.
Fig. 5
Fig. 5. Mature OL-specific Drp1 hyperactivation induces glycolytic stress in AD mice.
(A) The corpus callosum was harvested from 6-month-old WT, CNP;Drp1fl/+, 5XFADhet;Drp1+/+, and 5XFADhet;CNP;Drp1fl/+ mice (shown in scheme). Label-free tandem mass spectrometry analysis was conducted to identify the proteins changed by mature OL-specific Drp1 heterozygous knockout in 5XFAD mice. The number of proteins changed in mice of the four genotypes is shown. In particular, 269 proteins accounting for 24.6% of total identified proteins were decreased in 5XFAD mice but elevated in 5XFADhet;CNP;Drp1fl/+ mice. Thirty-one proteins were increased in 5XFAD mice and decreased in 5XFADhet;CNP;Drp1fl/+ mice. These 300 proteins were used for bioinformatics analysis. (B) The molecular and cellular functions of the 300 proteins from the pool marked as * in (A) were analyzed. The proteins were enriched for proteins involved in glycolysis and the TCA cycles and significantly regulated by mature OL-specific Drp1 heterozygous knockout. (C) Heatmap analysis for these enriched proteins is shown. (D) Mature OLs were treated with oligomeric Aβ1-42 for 24 hours in the presence or absence of Mdivi-1 (5 μM). The ECAR was analyzed with the seahorse analyzer (n = 2 replicates per group). The data are from four to five independent experiments. (E) Glycolytic and oxidative ATP production rates were calculated as described in Materials and Methods. (F) The lactate content of mature OLs was measured. The data are from at least three independent experiments. (G) Total protein lysates were prepared from the corpus callosum of mice with the indicated genotypes, and the lactate content was measured. n = 4 mice per group. The data are from at least three independent experiments. All the data are expressed as the mean ± SEM and compared by one-way ANOVA with Tukey’s post hoc test.
Fig. 6
Fig. 6. Drp1-HK1 axis induces NLRP3 inflammasome activation in OLs of AD.
(A) Postmortem cortex sections from normal subjects and AD patients (Table 1) were stained with anti-HK1 and anti-CC1 antibodies. Scale bar, 20 μm. The HK1 intensity in CC1+ OLs was quantified. (B) Brain sections from mice of the indicated genotypes were stained with anti-HK1 and anti-CC1 antibodies. Scale bar, 20 μm. The HK1 intensity in CC1+ OLs of mice was quantified. n = 3 mice per group. (C) The corpus callosum was harvested from 6-month-old mice. Western blot analysis of mitochondrial and cytosolic fractions was performed. The HK1 density on mitochondrial and cytosolic fractions was quantified. n = 3 mice per group. ATPB, a mitochondrial inner membrane protein. Enolase, a cytosolic protein. VDAC, a mitochondrial outer membrane protein. (D) HK1 activity was measured using protein lysates harvested from mouse corpus callosum. n = 3 mice per group. (E) The corpus callosum was harvested from 6-month-old mice. Immunoprecipitation with anti-HK1 or anti-Drp1 was carried out. n = 3 mice per group. (F) Mature OLs were treated with Mdivi-1 (5 μM) 4 hours followed by the addition of oligomeric Aβ1-42 (5 μM). After 24 hours, cells were stained with anti-Tom20, anti-HK1, and anti-MOG antibodies. Left: Representative images from three independent experiments. Right: Percentage of mitochondrial HK1 density out of total HK1 density in MOG+ cells and percentage of MOG+ cells with fragmented mitochondria. Scale bar, 20 μm. (G) Mature OLs were infected with Drp1 shRNA followed by overexpression of GFP-HK1 for 48 hours, and cells were treated with oligomeric Aβ1-42 (5 μM) for 24 hours. Western blot analysis was performed. n.s., not significant. The densities of NLRP3 and cleaved GSDMD relative to actin are shown in histograms. (H) The release of IL-1β was analyzed by ELISA. All the data are expressed as the mean ± SEM and compared by one-way ANOVA with Tukey’s post hoc test.
Fig. 7
Fig. 7. The scheme of the study.
Under healthy conditions, HK1 localizes on the mitochondria outer membrane where it binds to VDAC. Mitochondrial HK1 converts glucose to glucose-6-phosphate (G-6-Pi) via phosphorylation, which initiates glycolysis, generating pyruvate and lactate as energy resources. Lactate can also enter neurons to support the TCA cycle and neuronal survival. In AD, Drp1 in mature OLs is hyperactivated by stress (e.g., soluble Aβ). Hyperactivated Drp1 translocates to the mitochondria, where it preferentially binds to VDAC, dissociating HK1 from VDAC. This dissociation inactivates HK1 and suppresses glycolysis. HK1 inactivation and glycolytic inhibition results in glycolytic stress, which induces NLRP3 inflammasome activation, cleavage of GSDMD and pro–IL-1β, and inflammatory injury of the mature OLs. The results are demyelination and axonal degeneration. Down-regulation of Drp1 in the mature OLs blocks these abnormal events from their start and, therefore, reduces the OL inflammation, myelin loss, and white matter degeneration observed in AD.

References

    1. Jagust W., Imaging the evolution and pathophysiology of Alzheimer disease. Nat. Rev. Neurosci. 19, 687–700 (2018). - PMC - PubMed
    1. Nasrabady S. E., Rizvi B., Goldman J. E., Brickman A. M., White matter changes in Alzheimer’s disease: A focus on myelin and oligodendrocytes. Acta Neuropathol. Commun. 6, 22 (2018). - PMC - PubMed
    1. Salat D. H., Greve D. N., Pacheco J. L., Quinn B. T., Helmer K. G., Buckner R. L., Fischl B., Regional white matter volume differences in nondemented aging and Alzheimer’s disease. Neuroimage 44, 1247–1258 (2009). - PMC - PubMed
    1. Desai M. K., Sudol K. L., Janelsins M. C., Mastrangelo M. A., Frazer M. E., Bowers W. J., Triple-transgenic Alzheimer’s disease mice exhibit region-specific abnormalities in brain myelination patterns prior to appearance of amyloid and tau pathology. Glia 57, 54–65 (2009). - PMC - PubMed
    1. Zhan X., Jickling G. C., Ander B. P., Liu D., Stamova B., Cox C., Jin L.-W., DeCarli C., Sharp F. R., Myelin injury and degraded myelin vesicles in Alzheimer’s disease. Curr. Alzheimer Res. 11, 232–238 (2014). - PMC - PubMed

Publication types

MeSH terms

Substances