. 2020 Dec 4;6(49):eabd6324.
doi: 10.1126/sciadv.abd6324. Print 2020 Dec.

Enabling near-atomic-scale analysis of frozen water

Affiliations

Enabling near-atomic-scale analysis of frozen water

A A El-Zoka et al. Sci Adv. .

Abstract

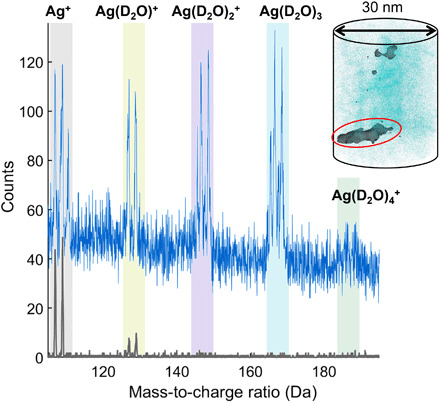
Transmission electron microscopy went through a revolution enabling routine cryo-imaging of biological and (bio)chemical systems, in liquid form. Yet, these approaches typically lack advanced analytical capabilities. Here, we used atom probe tomography to analyze frozen liquids in three dimensions with subnanometer resolution. We introduce a specimen preparation strategy using nanoporous gold. We report data on 2- to 3-μm-thick layers of ice formed from both high-purity deuterated water and a solution of 50 mM NaCl in high-purity deuterated water. The analysis of the gold-ice interface reveals a substantial increase in the solute concentrations across the interface. We explore a range of experimental parameters to show that atom probe analyses of bulk aqueous specimens come with their own challenges and discuss physical processes that produce the observed phenomena. Our study demonstrates the viability of using frozen water as a carrier for near-atomic-scale analysis of objects in solution by atom probe tomography.


Figures

Fig. 1
Fig. 1. SEM images of in situ APT specimen preparation of an ice sample on NPG.
(A) The 200- and 75-μm ion beam annular patterns for outer and inner diameters, respectively, were made on the ice/NPG sample. (B) The ice/NPG pillar was milled until the height of the Au post reached <50 μm (83). (C) Ice layer was gradually sharpened along with NPG until the layer reached <5 μm in height. (D) Final APT specimen of ice on NPG.
Fig. 2
Fig. 2. Summary of the atom probe data from a thick layer of ice.
(A) Mass spectrum of acquired APT dataset of D2O ice at 100 pJ, 200 kHz, and a detection rate of 0.5%. (B) Sectioned mass spectrum from (A) to illustrate DxH3−xO complex peaks. (C) 3D reconstruction map of D2O. Inset capture shows SEM image of the specimen.
Fig. 3
Fig. 3. Mass spectra from a floating silver flake and the surrounding ice.
Mass spectrum for a 30-nm-diameter and 35-nm-long cylinder, shown in the inset, from within frozen NaCl-containing solution is shown in blue. Inset shows the group of Ag+ ions surrounded by ice with an isosurface value of 10 at % for Ag. Mass spectrum from within the flake, marked in red in the inset, is shown in gray.
Fig. 4
Fig. 4. Near-atomic-scale mapping of chemical compositions across frozen gold-water interface.
(A) 3D reconstruction and analysis of the interface between the NPG substrate and the NaCl-containing ice. O is used to mark the position of all water clusters. (B) A 5-nm-thick slice through the tomogram in (A) along the plane marked by the dashed purple line, evidencing Ag-rich ligaments and the distribution of Cl and Na ions in between. (C) Compositional profile along a 5-nm-diameter cylinder crossing into the interface between a nanoligament and the ice, along the green arrow marked in (D), i.e., along the ligament’s main axis. The line in gray is the sum of Au and Ag compositions. (E) Composition profile in between two ligaments, along the yellow arrow in (D), showing the local increase in Na and Cl in between ligaments. The line in gray is the sum of Au and Ag composition. The shaded regions correspond to the 2σ of the counting statistic in each bin.
Fig. 5
Fig. 5. Relative molecular ion abundances as a function of the laser pulse energy and in high-voltage pulsing mode.
Relative amount of different cluster ions observed in the analysis of D2O ice at pulsing energies ranging from 20 to 100 pJ. Pulsing fraction for the HV measurement was 15%.
Fig. 6
Fig. 6. Examples of mass spectra from frozen salt water at different pulse repetition rates.
Mass spectra from the NaCl-D2O water specimen at 200 and 25 kHz—note the difference in scale on the y axis.
Fig. 7
Fig. 7. Effect of laser pulse energy and repetition rate on atom probe data.
Level of background (A) as a function of laser pulse energy at a pulsing rate of 200 kHz for D2O ice and (B) effect of the pulsing rate for D2O-NaCl ice at 60 pJ. (C and D) 2D detector hit maps for a range of parameters specified in each map.
Fig. 8
Fig. 8. Schematic showing the main parts of the specimen and possible steps involved in the proposed mechanism for pulsed field evaporation of ice.

References

    1. Nobel Prize® and the Nobel Prize® medal design mark are registered trademarks of the Nobel Foundation Scientific Background on the Nobel Prize in Chemistry 2017 THE DEVELOPMENT OF CRYO-ELECTRON MICROSCOPY (2017).
    1. Park J., Elmlund H., Ercius P., Yuk J. M., Limmer D. T., Chen Q., Kim K., Han S. H., Weitz D. A., Zettl A., Alivisatos A. P., 3D structure of individual nanocrystals in solution by electron microscopy. Science 349, 290–295 (2015). - PubMed
    1. Chen C.-C., Zhu C., White E. R., Chiu C.-Y., Scott M. C., Regan B. C., Marks L. D., Huang Y., Miao J., Three-dimensional imaging of dislocations in a nanoparticle at atomic resolution. Nature 496, 74–77 (2013). - PubMed
    1. Yang Y., Chen C.-C., Scott M. C., Ophus C., Xu R., Pryor A., Wu L., Sun F., Theis W., Zhou J., Eisenbach M., Kent P. R. C., Sabirianov R. F., Zeng H., Ercius P., Miao J., Deciphering chemical order/disorder and material properties at the single-atom level. Nature 542, 75–79 (2017). - PubMed
    1. Zhou J., Yang Y., Yang Y., Kim D. S., Yuan A., Tian X., Ophus C., Sun F., Schmid A. K., Nathanson M., Heinz H., An Q., Zeng H., Ercius P., Miao J., Observing crystal nucleation in four dimensions using atomic electron tomography. Nature 570, 500–503 (2019). - PubMed

LinkOut - more resources