. 2020 Dec 4;6(49):eabd7146.
doi: 10.1126/sciadv.abd7146. Print 2020 Dec.

Reliable, low-cost, fully integrated hydration sensors for monitoring and diagnosis of inflammatory skin diseases in any environment

Affiliations

Reliable, low-cost, fully integrated hydration sensors for monitoring and diagnosis of inflammatory skin diseases in any environment

Surabhi R Madhvapathy et al. Sci Adv. .

Abstract

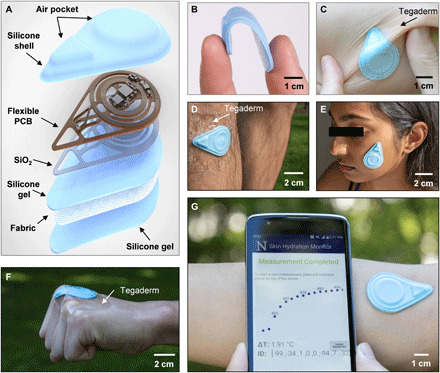
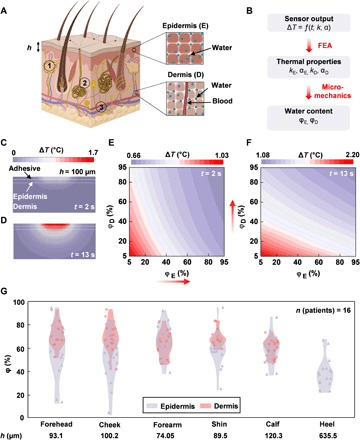
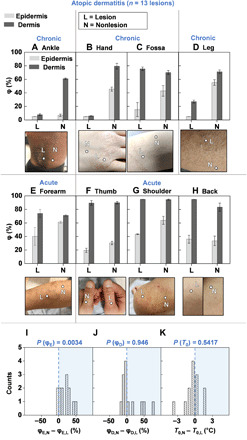
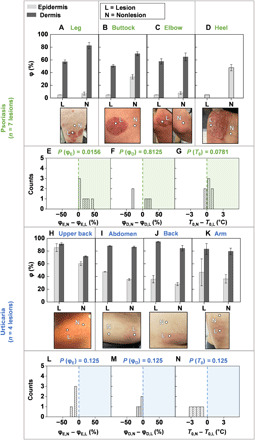
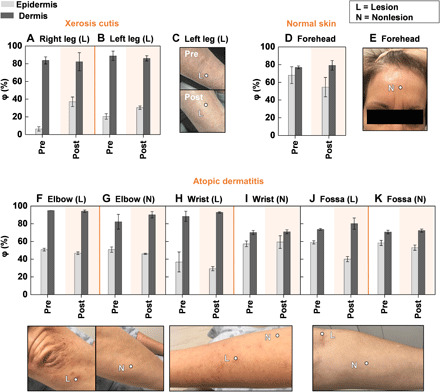
Present-day dermatological diagnostic tools are expensive, time-consuming, require substantial operational expertise, and typically probe only the superficial layers of skin (~15 μm). We introduce a soft, battery-free, noninvasive, reusable skin hydration sensor (SHS) adherable to most of the body surface. The platform measures volumetric water content (up to ~1 mm in depth) and wirelessly transmits data to any near-field communication-compatible smartphone. The SHS is readily manufacturable, comprises unique powering and encapsulation strategies, and achieves high measurement precision (±5% volumetric water content) and resolution (±0.015°C skin surface temperature). Validation on n = 16 healthy/normal human participants reveals an average skin water content of ~63% across multiple body locations. Pilot studies on patients with atopic dermatitis (AD), psoriasis, urticaria, xerosis cutis, and rosacea highlight the diagnostic capability of the SHS (P AD = 0.0034) and its ability to study impact of topical treatments on skin diseases.


Figures

Fig. 1
Fig. 1. Soft, wireless, battery-free SHSs.
(A) Diagram illustrating the layers and components of the device. (B) Photograph of a sensor bent between the thumb and index finger. (C) Photograph of the sensor mounted on a human forearm while the skin is under torsion. The sensor is secured to the skin with Tegaderm film overlaying the device. (D) Photograph of the sensor mounted on the shin with Tegaderm film placed over the device. (E) Photograph of the sensor mounted on the face without the assistance of external adhesives. (F) Photograph of the sensor mounted on the knuckle. The sensor is secured to the skin using Tegaderm film. (G) Photograph of the sensor mounted on the antecubital fossa without external adhesives and corresponding NFC readout of the sensor response displayed on a smartphone, providing a visual of the actual measurement procedure. Photo credit: Surabhi R. Madhvapathy, Northwestern University.
Fig. 2
Fig. 2. Device design, operation, and performance.
(A) Circuit diagram of the device and wireless pairing with a smart phone. A screenshot of a completed NFC readout from the device on the smart phone. ADC, analog-to-digital converter; GPIO, general purpose input/output; EN, enable; GND, ground. (B) Photograph of a fully assembled f-PCB for the device. Component 1 corresponds to a 13.56-MHz antenna used for powering of the radio frequency (RF) microcontroller (μC), sensing circuit, and communication; component 2 is the 19.04-MHz antenna used to deliver a constant q = 10 mW/mm2 of thermal power to the heater; component 3 is the voltage regulator; component 4 is the RF μC; and component 5 is the instrumentation amplifier from the circuit diagram in (A). A microscope image of the heater and the NTC thermistor are shown in a subset of the image. Scale bar, 1 mm. (C) Frequency sweep of the phase angle recorded from an impedance analyzer displaying the peak resonant frequency of the two antennas. The Q factor of each antenna is noted above its corresponding resonant peak. (D) Root-mean-square (RMS) rectified voltage from Ant. 2 recorded across several different smartphone readers. The dotted line indicates the minimum RMS voltage (Vthreshold) for reliable operation. (E) Infrared camera image of the heater and sensor when the heater is off and after the heater is on. (F) Representative transient temperature (ΔT) response generated by a single sensor (n = 1) on four different substrate materials: water (k = 0.6 W/m-K), S170 (k = 0.4 W/m-K), S184 (k = 0.2 W/m-K), and air (k = 0.02 W/m-K). (G) Box plots of ΔT at t = 13 s normalized to ΔT for water at t = 13 s as measured by n = 6 sensors (measured five times each) on the same four materials as in (F). Photo credit: Surabhi R. Madhvapathy, Northwestern University.
Fig. 3
Fig. 3. Evaluating the skin water content, φ.
(A) Pictorial diagram of the structure of skin. The parameter h represents thickness of the epidermis. Certain important features are noted in the diagram: (1) sebaceous glands, (2) eccrine sweat glands, and (3) blood vessels. (B) Workflow diagram illustrating the procedure for FEA fitting of epidermal hydration level φE (%) and dermal hydration level φD (%) from the measured ΔT versus time curve. (C) Cross-sectional view of the temperature distribution induced by the heater on the skin at short time (t = 2 s) and (D) long time (t = 13 s). (E) Relationship of the ΔT at short times (t = 2 s) to φE and φD. (F) Relationship of the ΔT at long times (t = 13 s) to φE and φD. (G) Violin plots of φE and φD for six different body locations (npatients = 16). Values for φD are not shown for the heel because of the large value of h (~600 μm).
Fig. 4
Fig. 4. Measurements on patients with AD.
φ for the epidermis (light gray bars) and dermis (dark gray bars), and photographic image of the lesion and nonlesional areas for patients with (A to D) chronic AD lesions and (E to H) acute AD lesions. Measurements involved n = 7 patients and n = 13 lesions. Data for the lesions not displayed here are in fig. S11. Dots embedded in the images represent exact measurement locations. Gray lines between plots for φ and corresponding images demarcate different patients. Error bars represent the SDs of three measurements repeated consecutively on the body location. In the absence of perilesional areas of skin with normal appearance, the contralateral location served as a comparison. (I) Histogram highlighting the difference between the nonlesional epidermal hydration (φE,N) and the lesional epidermal hydration (φE,L) for all n = 13 lesions. (J) Histogram highlighting the difference between the nonlesional dermal hydration (φD,N) and the lesional dermal hydration (φD,L) for all n = 13 lesions. (K) Histogram highlighting the difference in nonlesional skin surface temperature (T0,N) and lesional skin surface temperature (T0,L) for all n = 13 lesions. Computed two-sided P values using the Wilcoxon signed-rank test is displayed above each histogram. Photo credit: Michael Zhang, Vanderbilt University, and Surabhi R. Madhvapathy, Northwestern University.
Fig. 5
Fig. 5. Measurements on patients with psoriasis and urticaria.
φ for the epidermis (light gray bars) and dermis (dark gray bars), and photographic image of the lesion and nonlesional areas for patients with (A to D) psoriasis. Measurements involved n = 3 patients and n = 7 lesions. Histogram highlighting the difference between (E) the nonlesional epidermal hydration (φE,N) and the lesional epidermal hydration (φE,L), (F) the nonlesional dermal hydration (φD,N) and the lesional dermal hydration (φD,L), and (G) the nonlesional skin surface temperature (T0,N) and lesional skin surface temperature (T0,L) for all n = 7 lesions. (H to K) Hydration level and photographic image of the lesion and nonlesional areas for patients with urticaria. Measurements involved n = 2 patients and n = 4 lesions. Histogram highlighting the difference between (L) φE,N and φE,L, (M) φD,N and φD,L, and (N) T0,N and T0,L for all n = 4 lesions. Computed two-sided P values using the Wilcoxon signed-rank t test is displayed above each histogram. Photo credit: Michael Zhang, Vanderbilt University, and Surabhi R. Madhvapathy, Northwestern University.
Fig. 6
Fig. 6. The effect of moisturizer on a participant diagnosed with AD and xerosis cutis.
(A and B) φ for the epidermis (light gray bars) and dermis (dark gray bars) of the lesion on both legs of a patient with xerosis cutis before and 30 min after application of moisturizing cream to the skin. Dots embedded in the images represent exact measurement locations. The region of the graph shaded in orange represents the data after application of moisturizer. Error bars indicate measurements repeated three times consecutively on the same location. (C) Photograph of the lesion on the right leg of the patient corresponding to the data in (A) before and 30 min after application of moisturizer. (D) φ for the epidermis and dermis on the normal skin of the forehead before and 30 min after application of moisturizer to the skin. No lesions were present on the forehead for this patient. (E) Photograph of the forehead of the patient before application of moisturizer. (F to K) φ for the epidermis and dermis and corresponding images on the AD lesion and nonlesional areas for the same patient on three different body locations before and 30 min after application of moisturizer. In (F) to (K), no post-moisturizer photographs were recorded. Photo credit: Michael Zhang, Vanderbilt University.

Similar articles

Cited by

References

    1. Lim H. W., Collins S. A. B., Resneck J. S. Jr., Bolognia J. L., Hodge J. A., Rohrer T. A., Van Beek M. J., Margolis D. J., Sober A. J., Weinstock M. A., Nerenz D. R., Smith Begolka W., Moyano J. V., The burden of skin disease in the United States. J. Am. Acad. Dermatol. 76, 958–972.e2 (2017). - PubMed
    1. Lowell B. A., Froelich C. W., Federman D. G., Kirsner R. S., Dermatology in primary care: Prevalence and patient disposition. J. Am. Acad. Dermatol. 45, 250–255 (2001). - PubMed
    1. Basarab T., Munn S. E., Jones R. R., Diagnostic accuracy and appropriateness of general practitioner referrals to a dermatology out-patient clinic. Br. J. Dermatol. 135, 70–73 (1996). - PubMed
    1. Wagner R. F. Jr., Wagner D., Tomich J. M., Wagner K. D., Grande D. J., Diagnoses of skin disease: Dermatologists vs. nondermatologists. J. Dermatol. Surg. Oncol. 11, 476–479 (1985). - PubMed
    1. Mulick A. R., Allen V., Williams H. C., Grindlay D. J. C., Pearce N., Abuabara K., Langan S. M., Classifying atopic dermatitis: Protocol for a systematic review of subtypes (phenotypes) and associated characteristics. BMJ Open 8, e023097 (2018). - PMC - PubMed

Publication types

LinkOut - more resources