. 2021 Feb 15;81(4):1063-1075.
doi: 10.1158/0008-5472.CAN-20-1346. Epub 2020 Dec 4.

ATG5-Dependent Autophagy Uncouples T-cell Proliferative and Effector Functions and Separates Graft-versus-Host Disease from Graft-versus-Leukemia

Affiliations

ATG5-Dependent Autophagy Uncouples T-cell Proliferative and Effector Functions and Separates Graft-versus-Host Disease from Graft-versus-Leukemia

Katherine Oravecz-Wilson et al. Cancer Res. .

Abstract

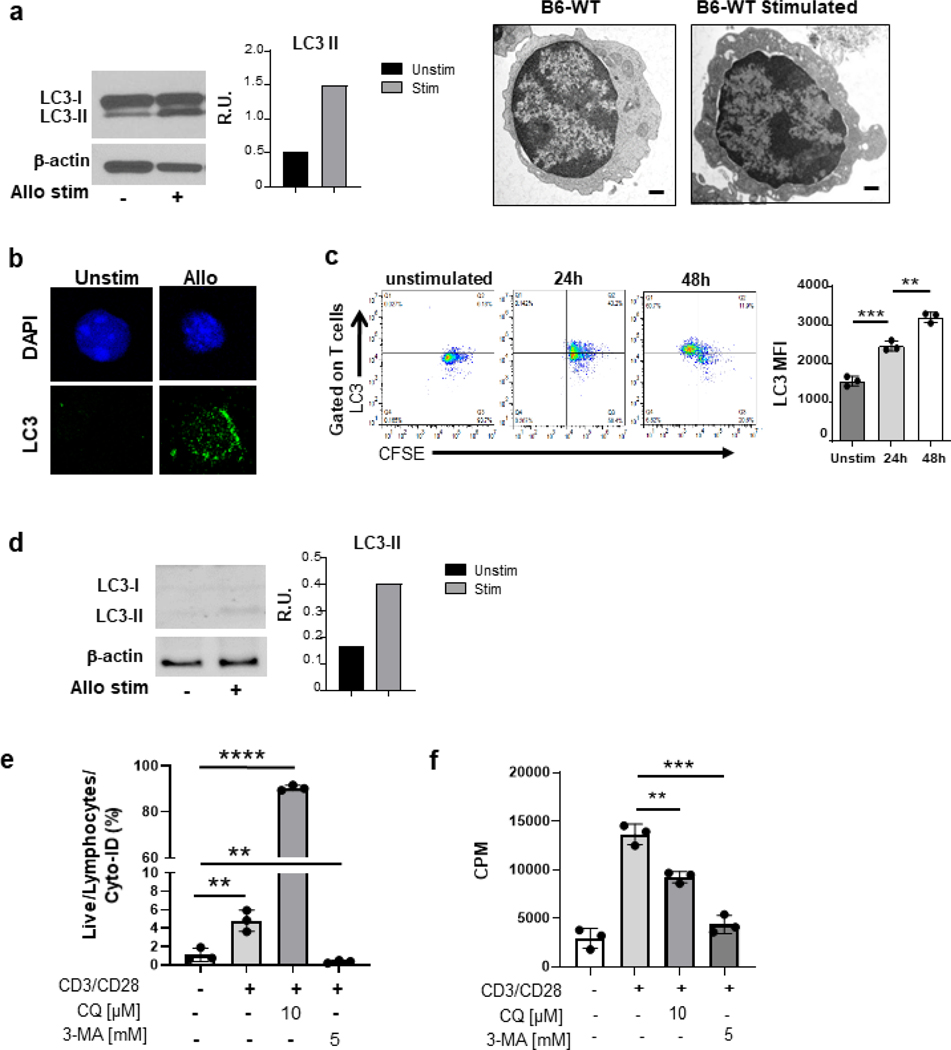
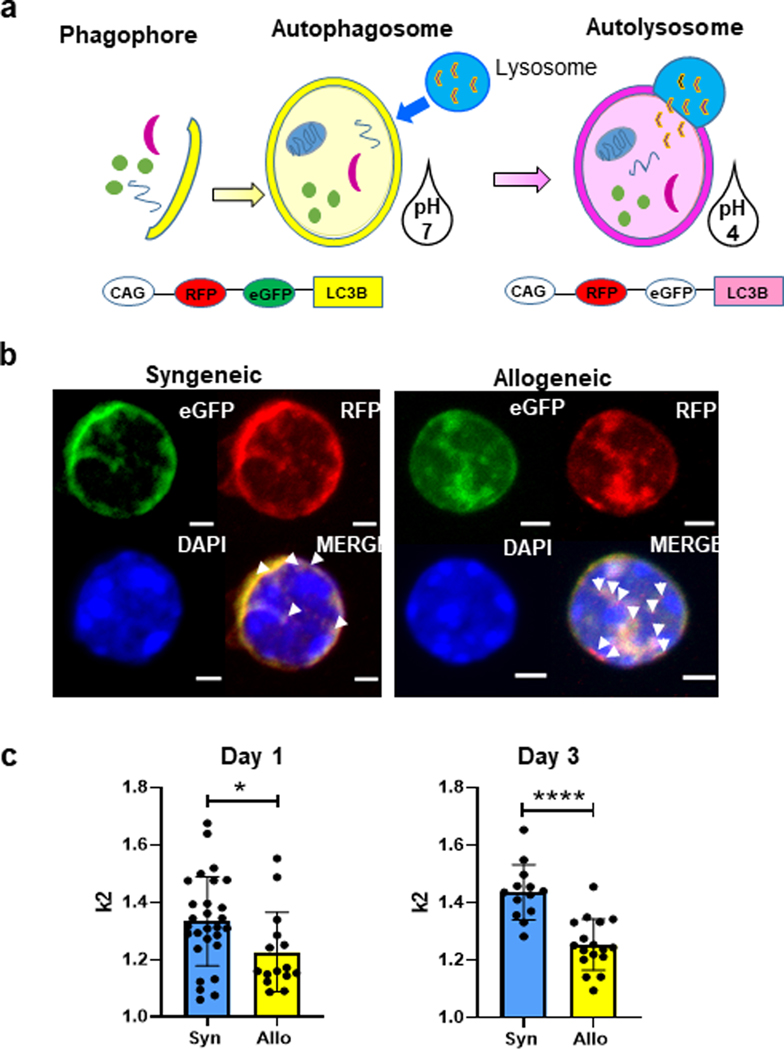
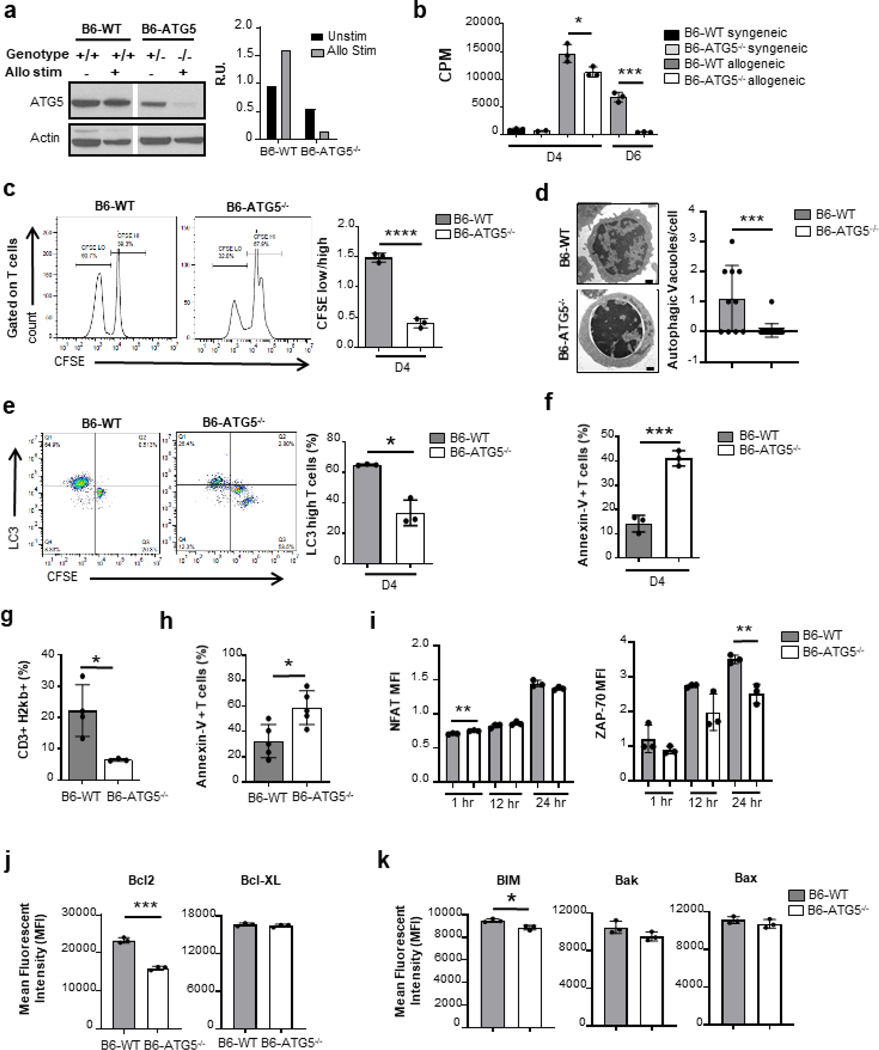
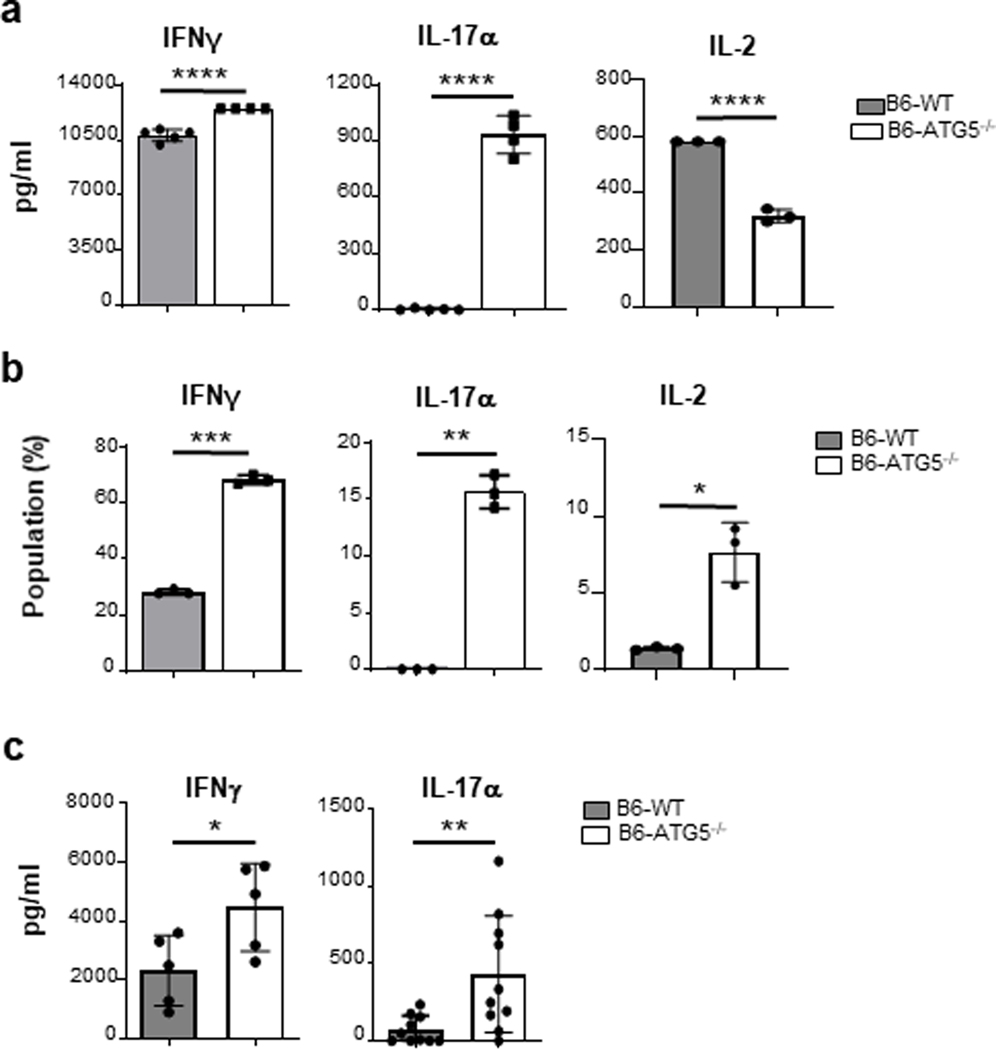
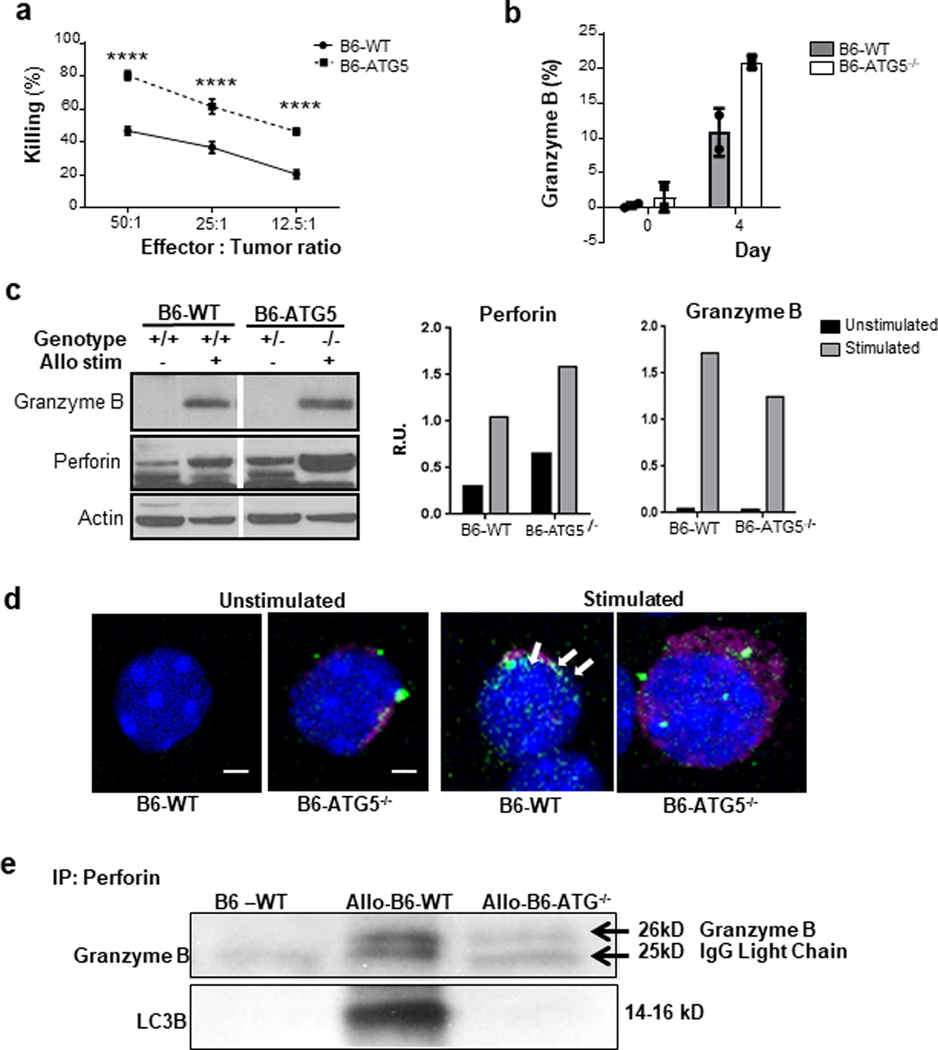
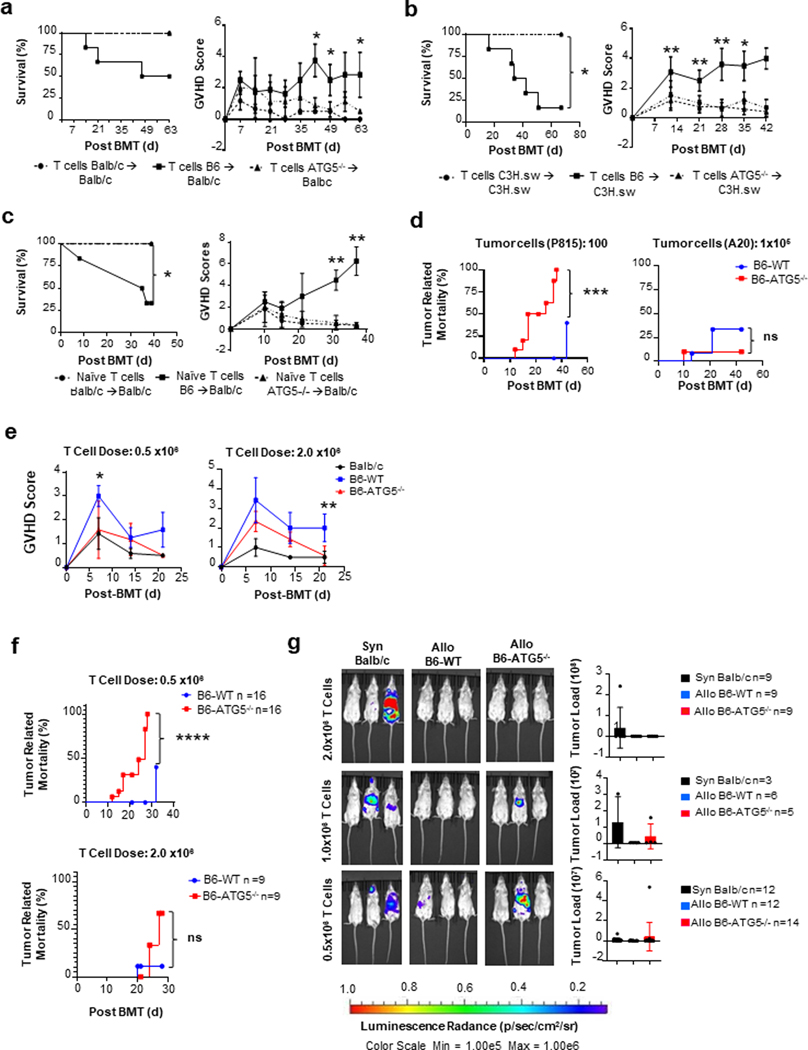
Autophagy is a vital cellular process whose role in T immune cells is poorly understood, specifically, in its regulation of allo-immunity. Stimulation of wild-type T cells in vitro and in vivo with allo-antigens enhances autophagy. To assess the relevance of autophagy to T-cell allo-immunity, we generated T-cell-specific Atg5 knock-out mice. Deficiency of ATG5-dependent autophagy reduced T-cell proliferation and increased apoptosis following in vitro and in vivo allo-stimulation. The absence of ATG5 in allo-stimulated T cells enhanced their ability to release effector cytokines and cytotoxic functions, uncoupling their proliferation and effector functions. Absence of autophagy reduced intracellular degradation of cytotoxic enzymes such as granzyme B, thus enhancing the cytotoxicity of T cells. In several in vivo models of allo-HSCT, ATG5-dependent dissociation of T-cell functions contributed to significant reduction in graft-versus-host disease (GVHD) but retained sufficient graft versus tumor (GVT) response. Our findings demonstrate that ATG5-dependent autophagy uncouples T-cell proliferation from its effector functions and offers a potential new strategy to enhance outcomes after allo-HSCT. SIGNIFICANCE: These findings demonstrate that induction of autophagy in donor T-cell promotes GVHD, while inhibition of T-cell autophagy mitigates GVHD without substantial loss of GVL responses.


Conflict of interest statement

Conflict of Interest: We have no conflicts of interest to disclose.

Figures

Fig. 1.
Fig. 1.. Autophagy is induced following allogeneic TCR stimulation in vitro.
Whole-cell lysates were prepared from purified T cells after stimulation for 4–6 days in a mixed lymphocytic reaction (MLR) with allogeneic irradiated whole mouse splenocytes or human T cell depleted PBMC’s (a) After 4 days of allogenic stimulation, Tcon and activated T cells were processed for electron microscopy preparation.(right) as well as for western blot analysis for the presence of LC3-I and LC3-II bands (left). Purified Tcon cells were used as controls. Graph of the relative intensities of LC3 II bands in relative units (R.U.) after their quantification and normalization to β-actin. (b) After 4 days of allogeneic stimulation, C57BL/6 purified splenic T cells were stained with LC3-FITC antibody and prepared for confocal microscopy. Purified Tcon cells were used as controls. (c) Gated with CD90.2 for T cells, representative FACS plots (left) of CFSEhigh/low and LC3high/low. Graph of the LC3 mean fluorescence intensity (right) of T cells (MFI ± standard error of the mean (SEM). (d) After 6 days of allogeneic stimulation, from a pool of 3 allogenic donors, purified human T cells were prepared for western blot analysis with similar analysis for the presence of LC3-I and LC3-II bands as in (a). (e) Purified human T cells were stimulated with plate-bound anti-CD3 and anti-CD28 antibodies, then analyzed for T cell proliferation based on 3H-thymidine incorporation at 48 hours. The data in counts per minute (CPM) are the mean ± STD of triplicates and are representative of 3 independent donors. (f) After 48 hr stimulation with CD3/CD28, cells were gated on live lymphocytes positive for Cyto-ID staining to analyze for autophagy induction. Cells were treated with 10 uM CQ and 5 mM 3-MA for positive and negative controls. (c) analyzed with two-tailed, unpaired t-test. (a) This graph is representative of 3 separate experiments. (c) Data are a summary of triplicates representative of 2 different experiments. Data in *P< 0.05; **P< 0.01; ***P< 0.001; ****P< 0.0001.
Fig. 2.
Fig. 2.. Verification of autophagy induction with allogeneic stimulation in vivo.
A CAG-RFP-eGFP-LC3 mouse strain was purchased from Jackson Laboratories and purified splenic T cells from these mice were used for a MHC major mismatch allogeneic bone marrow transplant allo-HCT transplants into BALB/c recipients with C57BL/6 donor TCD bone marrow. (a) Schematic of CAG-RFP-eGFP-LC3 mice with dual fluorescent expression capabilities which allows for autophagosomes to be distinguished from autolysosomes, depending on acidity of the environment. RFP is stable in acidic pH (pKa 4.5) while EGFP (pKa 5.9) is quenched. (b) Syngeneic and allogeneic transplanted animals with CAG-RFP-eGFP-LC3 T cells were harvested 4 days’ post-transplant. Co-expression of eGFP (green) and RFP (red) indicated by yellow punctate when LC3 in cytoplasm and autophagosome. Increase in red punctate alone, indicated by arrows indicates LC3 in autophagolysosome. (Scale bar, 2mm) (c) Quantification of the ratio of yellow fluorescent vs red fluorescence between syngeneic and allogeneic was used for indication of autophagy flux.
Fig. 3.
Fig. 3.. Autophagy induction is required for T cell proliferation from ATG5−/− mice.
CD90.2+ purified splenic T cells from C57BL/6 and ATG5−/− mice underwent allogenic stimulation for 4 or 6 days in an MLR and then harvested. (a) Confirmation of loss of ATG5 in the KO animals by WB (left) compared to heterozygote littermate and wildtype C57BL/6 animals. Quantification of WB bands (right). (b) Purified T cell proliferation were quantitated based on 3H-thymidine incorporation at day 4 and day 6. The data in CPM are the mean ± SEM of triplicates and are representative of 2 independent experiments. (c) T cells were labeled with CFSE prior to stimulation and analyzed for CFSE dilution at day 4. Representative histograms of CFSE dilution (left). The mean of the ratios CFSElow/ CFSEhigh ± SEM of triplicates. Data is representative of 2 independent experiments. (d) After 4 days of allogenic stimulation, activated B6-WT and B6-ATG5−/− T cells were processed for electron microscopy preparation (scale bars, 500 nm) individual cells were quantitated for autophagic vacuoles (right panel). (e) Gated with CD90.2 for T cells, (left) graph of the LC3 mean fluorescence intensity of T cells (MFI ± standard error of the mean (SEM) Data are a summary of triplicates representative of 2 different experiments. (f) After 4 days of allogenic stimulation, activated B6-WT and B6-ATG5−/− T cells were stained with Annexin-V and analyzed by flow cytometry. BALB/c recipient mice underwent MHC major mismatch allogeneic bone marrow transplant with C57BL/6 donor TCD bone marrow with purified splenic T cells from B6-WT or B6-ATG5−/− donors. Isolated the splenocytes of recipients at day 7 post-BMT and analyzed them by flow cytometry. We observed a decrease in the expansion of B6-ATG5−/− T cells (g) as well as an increased apoptosis (h) when compared to WT-B6. Data is representative of 3 experiments Whole splenocytes from C57BL/6 and ATG5−/− mice were cultured with anti-CD3/CD28 antibodies and harvested for analysis by flow cytometry at 1h, 12h and 24h. Unstimulated splenocytes were used as controls. (i) Gated on CD90.2-positive T cells, they were analyzed for the MFI of intracellular NFAT (left panel) and histogram overlay on left for unstimulated and 24 h time point (right panel) (j) Intracellular Zap-70. Data are the mean MFI± SEM of triplicates representative of 3 independent experiments. Whole splenocytes from C57BL/6 and ATG5−/− mice were cultured with anti-CD3/CD28 for 48h with additional 5h with Cell Stimulation Cocktail. After stimulation, they were stained and gated on CD90.2-positive T cells, then analyzed by flow cytometry. (k) Left panel: representative histograms of Bcl-2 in CD90.2-positive T cells. Right panel: mean of Bcl-XL MFI ± SEM of triplicates representative of 3 independent experiments. (l) These same CD90.2-positive T cells, then analyzed by flow cytometry for the presence of intracellular staining BIM, Bak, and Bax. Graphs are the mean of MFI ± SEM of triplicates representative of 3 independent experiments. *P< 0.05; **P< 0.01; ***P< 0.001; ****P< 0.0001.
Fig. 4.
Fig. 4.. ATG5-deficient T cells show an unexpected cytokine profile.
Sorted CD90.2+ B6-WT and B6-ATG5−/− T cells were stimulated for 4 days in an MLR with BMDCs from C57B6 (syngeneic) or BALB/c (allogeneic) mice. (a) Supernatants from the MLR were analyzed with ELISA for IFNγ, IL-17α and IL-2. (b) Cells were harvested and stained for intracellular cytokine and analyzed by flow cytometry. The graphs show the mean of triplicates SD and are representative of 2 independent experiments. (c) Serum levels of Day 7 post-transplant animals for cytokine levels. Data analysis done by ELISA assay. Graph representative of 3 experiments. *P< 0.05; **P< 0.01; ***P< 0.001; ****P< 0.0001.
Fig. 5.
Fig. 5.. ATG5−/− activated T cells have an increased killing effect.
A cytolytic T lymphocyte assay (CTL) was performed using purified T cells from B6-WT and B6-ATG5−/− mice. Cells were stimulated for 6 days in a bulk MLR with allogeneic irradiated (30Gy) whole splenocytes from BALB/c mice in order to generate activated CD8-positive T cells. (a) The CD8-positive T cells were used as effectors against P815 targets in a CTL assay. The graph shows the percentage of specific killing at various effector-to-target ratios. Data are the mean± SEM of quadruplicates and are representative of 3 independent experiments. (b) CD8-positive T cells were harvested at day 4 from the bulk MLR and stained for intracellular granzyme B (p=0.065). (c) An MLR was performed using purified T cells from B6-WT and B6-ATG5−/− mice. Cells were stimulated for 4 days in a bulk MLR with allogeneic irradiated (30Gy) whole splenocytes from BALB/c mice in order to generate activated CD8-positive T cells. Cells were harvested and pelleted for protein isolation. Control T cells (left panel) were harvest from spleens of naïve mice and processed for protein isolation. Quantitation of protein expression (right panel) was done using ImageJ software. Representative grafts are from duplicate experiments. (d) CD8-positive T cells were analyzed with confocal microscopy in order to identify co-localization of perforin (pink) and LC3 (green) indicated by white punctate (arrows). (e) B6-WT and B6-ATG5−/− splenic T cells were stimulated for 4 days in an MLR reaction, harvested and prepared for protein lysates. Lysates were then immune-precipitated with perforin antibody and then WB for granzyme B and LC3B. *P< 0.05; **P< 0.01; ***P< 0.001; ****P< 0.0001.
Fig. 6.
Fig. 6.. ATG5 regulates T cell-dependent GVHD and increases T cell cytotoxic function in a murine model.
BALB/c recipient mice underwent MHC major mismatch allogeneic bone marrow transplant with C57BL/6 donor TCD bone marrow with purified splenic T cells from B6-WT or B6-ATG5−/− donors. Mice were monitored weekly for survival and GVHD score. (a) Left Panel: Survival curve of animal’s observations weekly for survival. Right Panel: GVHD scoring of animals weekly for progression of disease. (b) C3H.sw recipient mice underwent MHC minor mismatch allogeneic bone marrow transplant with C57BL/6 donor TCD bone marrow (5×10⁶) with purified splenic T cells (3×10⁶) from WT-C3H.sw (syngeneic), B6-WT or B6-ATG5−/− donors (allogeneic). Mice were monitored weekly. Left Panel: Survival curve of animal’s observations weekly for survival. Right Panel: GVHD scoring of animals weekly for progression of disease. (c) Animal model of GVHD using only naïve T cells for transplant. Naïve T cells from B6-WT or B6-ATG5−/− mice were transplanted into BALB/c recipients. Left Panel: Survival curve of animal’s observations weekly for survival. Right Panel: GVHD scoring of animals weekly for progression of disease. (d) BALB/c recipient’s data for a Graph versus Tumor (GVL) assay against P815 leukemia tumor line. (e) BALB/c recipient’s data for a Graph versus Tumor (GVL) assay against A20 leukemia tumor line. (f) BALB/c mice transplanted with 0.5 or 2.0 × 10⁶ T cells with 100 P815 tumor cells from BALB/c, B6-WT or B6-ATG5−/− donor animals were analyzed weekly for GVHD score (g) and tumor related mortality. (h) BALB/c mice transplanted with 0.5, 1.0, and 2.0 × 10⁶ T cells from either BALB/c, B6-WT or B6-ATG5−/− donor animals were analyzed at day 14. P815 tumor load was measured using the CCD camera (IVIS, Caliper Life Sciences) imaging machine to quantitate to amount of tumor load per mouse. Images are a representative group of animals. *P< 0.05; **P< 0.01; ***P< 0.001; ****P< 0.0001.

References

    1. Mizushima N, Levine B, Cuervo AM & Klionsky DJ Autophagy fights disease through cellular self-digestion. Nature 451, 1069–1075 (2008). - PMC - PubMed
    1. Shintani T. & Klionsky DJ Autophagy in health and disease: a double-edged sword. Science 306, 990–995 (2004). - PMC - PubMed
    1. DeSelm CJ et al. Autophagy proteins regulate the secretory component of osteoclastic bone resorption. Dev Cell 21, 966–974 (2011). - PMC - PubMed
    1. Patel KK et al. Autophagy proteins control goblet cell function by potentiating reactive oxygen species production. EMBO J 32, 3130–3144 (2013). - PMC - PubMed
    1. Chen Y. & Klionsky DJ The regulation of autophagy - unanswered questions. J Cell Sci 124, 161–170 (2011). - PMC - PubMed

Publication types