. 2021 Mar;20(3):477-489.
doi: 10.1158/1535-7163.MCT-19-0987. Epub 2020 Dec 4.

A Novel CDK2/9 Inhibitor CYC065 Causes Anaphase Catastrophe and Represses Proliferation, Tumorigenesis, and Metastasis in Aneuploid Cancers

Affiliations

A Novel CDK2/9 Inhibitor CYC065 Causes Anaphase Catastrophe and Represses Proliferation, Tumorigenesis, and Metastasis in Aneuploid Cancers

Masanori Kawakami et al. Mol Cancer Ther. 2021 Mar.

Abstract

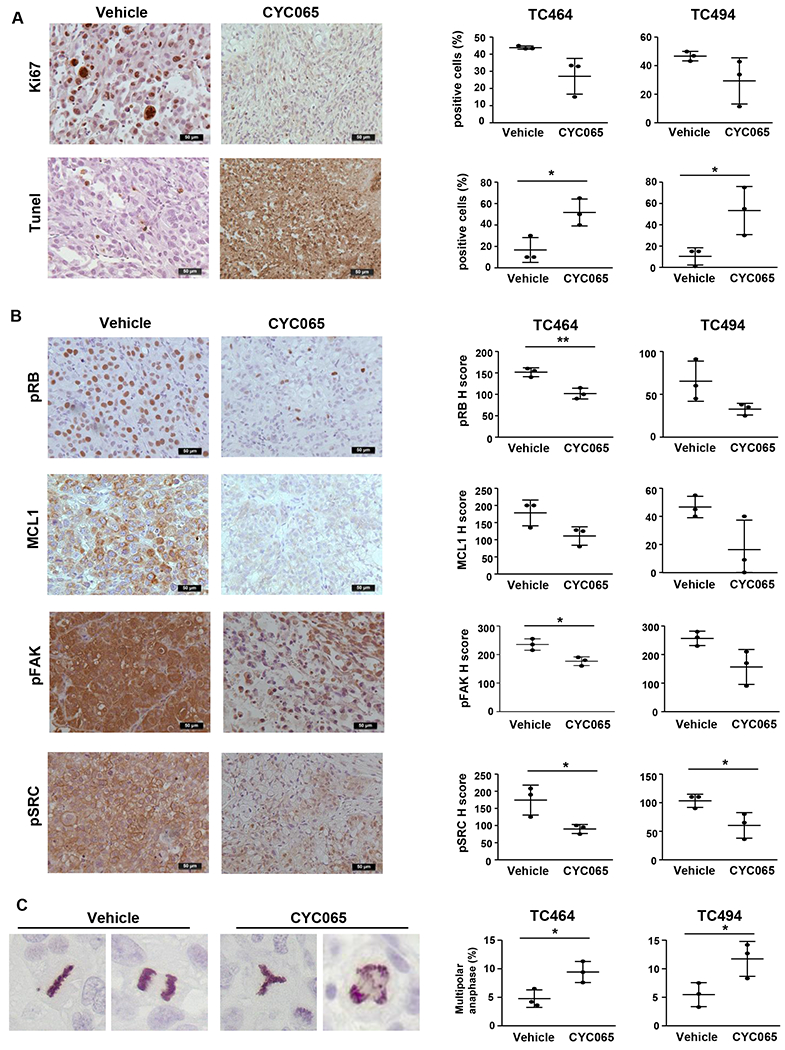
Cyclin-dependent kinase 2 (CDK2) antagonism inhibits clustering of excessive centrosomes at mitosis, causing multipolar cell division and apoptotic death. This is called anaphase catastrophe. To establish induced anaphase catastrophe as a clinically tractable antineoplastic mechanism, induced anaphase catastrophe was explored in different aneuploid cancers after treatment with CYC065 (Cyclacel), a CDK2/9 inhibitor. Antineoplastic activity was studied in preclinical models. CYC065 treatment augmented anaphase catastrophe in diverse cancers including lymphoma, lung, colon, and pancreatic cancers, despite KRAS oncoprotein expression. Anaphase catastrophe was a broadly active antineoplastic mechanism. Reverse phase protein arrays (RPPAs) revealed that along with known CDK2/9 targets, focal adhesion kinase and Src phosphorylation that regulate metastasis were each repressed by CYC065 treatment. Intriguingly, CYC065 treatment decreased lung cancer metastases in in vivo murine models. CYC065 treatment also significantly reduced the rate of lung cancer growth in syngeneic murine and patient-derived xenograft (PDX) models independent of KRAS oncoprotein expression. Immunohistochemistry analysis of CYC065-treated lung cancer PDX models confirmed repression of proteins highlighted by RPPAs, implicating them as indicators of CYC065 antitumor response. Phospho-histone H3 staining detected anaphase catastrophe in CYC065-treated PDXs. Thus, induced anaphase catastrophe after CYC065 treatment can combat aneuploid cancers despite KRAS oncoprotein expression. These findings should guide future trials of this novel CDK2/9 inhibitor in the cancer clinic.


Conflict of interest statement

The authors have no conflicts of interest to disclose.

Figures

Figure 1.
Figure 1.
Anti-neoplastic effects of CYC065 treatment in murine and human lung cancer cells. (A) Dose-response consequences of CYC065 treatment in murine (ED1, LKR13, 393P, 344SQ, and KC2) and human (H522, H1299, Hop62, and A549) lung cancer cells. Effects on murine immortalized pulmonary epithelial cells (C10) and human immortalized bronchial epithelial cells (BEAS-2B) are shown. (B) Relative proliferation is shown for 84 lung cancer cells in a high-throughput screen after CYC065 0.5μM treatment versus vehicle controls. Each bar displays an individual lung cancer cell line. The pie chart shows that the cell population was stratified by relative viability after CYC065 0.5μM treatment (versus vehicle controls) among 84 lung cancer cell lines. (C) Comparison of growth inhibitory effects of CYC065 treatment in KRAS wild-type versus mutant lung cancer cells were displayed using a high-throughput screen of 84 human lung cancer cells. Each symbol displays an individual cell line. (D) Comparisons of CYC065 effects on growth of lung cancer cells versus vehicle controls, washout (CYC065 wash-out after 24 hours treatment), and CYC065 continuously-treated groups. Fold-growth versus day 0 are shown. (E) Percentages of apoptotic cells are displayed after individual CYC065 treatment in murine and human lung cancer cells. Effects in C10 and BEAS-2B cells are displayed. (F) Cell cycle analysis after CYC065 treatment appear for murine and human lung cancer cells. Error bars are standard deviations with *P < 0.05 and **P < 0.01 by Tukey’s multiple comparison test (D) and Dunnett’s multiple comparison t test (versus controls) (E, F).
Figure 2.
Figure 2.
Anaphase catastrophe is a broadly active anti-neoplastic mechanism. (A) Representative immunofluorescent images of spindles from bipolar cells with two centrosomes (left panel), cells with clustered supernumerary centrosomes (middle panel), and cells with supernumerary centrosomes (right panel). The blue signal is Hoechst staining of DNA, red signal is α-tubulin staining, and green signal is γ-tubulin staining. (B) Percentages of cells undergoing multipolar anaphase among anaphase cells after CYC065 treatment are displayed for murine (ED1, LKR13, 393P, 344SQ, and KC2) and human (H522, H1299, Hop62, and A549) lung cancer cells as well as for immortalized (C10 and BEAS-2B) lung epithelial cells. (C) Percentages of cells with centrosome clustering among anaphase cells after CYC065-treatment are shown. (D) Dose-responsive consequences of CYC065 treatment in colon (DLD1 and HCT116) and pancreatic (PSN1 and AsPC1) cancer cells. (E) Percentages of apoptotic cells after CYC065 treatment are displayed in colon and pancreatic cancer cells. (F) Percentages of cells undergoing multipolar anaphase after CYC065 treatment are shown in colon and pancreatic cancer cells. Error bars are standard deviations with *P < 0.05 and **P < 0.01 by Dunnett’s multiple comparison t test (versus controls).
Figure 3.
Figure 3.
Consequences of engineered gain of CDK2 or CDK9 expression on CYC065-treatment effects are shown in lung cancer cells. (A) Immunoblot analyses after transfection of CDK2 or CDK9 expressing plasmids. (B) CYC065-treatment effects are shown for lung cancer cell proliferation after engineered gain of CDK2 or CDK9 expression. (C) Effects of CYC065-treatment on apoptosis induction after engineered gain of CDK2 or CDK9 expression in lung cancer cells are presented. (D) Effects of CYC065-treatment on anaphase catastrophe after independent gain of CDK2 or CDK9 expression in lung cancer cells are displayed. Error bars are standard deviations with *P < 0.05 and **P < 0.01 by the Dunnett’s multiple comparison t test (versus controls).
Figure 4.
Figure 4.
CYC065 effects on lung cancer cell migration and invasion. (A) Percentages of wounded area filled by migrating cells after 6-12 hours of independent vehicle or CYC065 treatment of murine (344SQ and KC2) and human (H1299 and A549) lung cancer cells are displayed. Representative images of wounded areas before and after treatment with vehicle or CYC065-treatments are provided. (B) Percentages of migrated cells after independent vehicle or CYC065-treatment of murine and human lung cancer cells are presented. Representative images of migrating cells after vehicle or CYC065-treatment are shown. (C) Percentages of lung cancer cell invasion after independent vehicle or CYC065-treatment are displayed. Representative images of invading cells after vehicle or CYC065-treatment are shown. Error bars display standard deviations with *P < 0.05 and **P < 0.01 by Dunnett’s multiple comparison t test (versus controls).
Figure 5.
Figure 5.
In vivo CYC065 anti-tumorigenic effects. (A) Comparison of tumor growth in syngeneic murine lung cancer xenograft models treated with vehicle or CYC065. Day 0 is the treatment start date. Error bars are standard deviations with **P < 0.01 by the mixed model analysis. (B) Comparisons of tumor weights in syngeneic murine lung cancer models after treatments. Each symbol represents a single mouse. Bars represent mean values and standard deviations with **P < 0.01 by the Student’s t test. (C) Bioluminescent signals are shown from tumors arising from syngeneic murine lung cancer models treated with vehicle or CYC065. Representative bioluminescence images from these mice appear over time. Error bars represent standard deviations with **P < 0.01 by the mixed model analysis. (D) Comparisons are shown for tumor growth in lung cancer PDX models treated with vehicle or CYC065. Day 0 is the treatment start date. Error bars represent standard deviations with **P < 0.01 by the Student’s t test. (E) Comparisons of tumor weights are presented for lung cancer PDX models after treatments with vehicle or CYC065. Each symbol represents a single mouse. Bars represent mean values and standard deviations with *P < 0.05 and **P < 0.01 by the Student’s t test. (F) Lung tumor formation is provided for a syngeneic tail-vein injection model using metastasis-prone 344SQ cells after treatments with vehicle or CYC065. Representative images of lung tissues are shown. Yellow arrows highlight metastatic tumors. Bars represent mean values and standard deviations with **P < 0.01 by the Student’s t test. (G) Representative hematoxylin-eosin stained photomicrographs of resected lung tissues after treatments with vehicle or CYC065 are provided.
Figure 6.
Figure 6.
In vivo protein expression profiles after CYC065 treatment. (A) Comparisons appear for Ki-67 staining and Tunel assay for scoring of apoptotic cells in lung cancer PDX models after independent treatments with vehicle or CYC065. Each symbol is a single mouse. Representative immunostained images comparing vehicle and CYC065-treated groups are displayed (left panels). Bars represent mean values and standard deviations with *P < 0.05 by the Student’s t test. (B) Comparisons of profiles in lung cancer PDX models after treatments with vehicle or CYC065. Each symbol is a single mouse. Representative immunostained images of each species from vehicle or CYC065-treated groups are shown. Bars represent mean values and standard deviations with *P < 0.05 and **P < 0.01 by the Student’s t test. (C) Analysis of mitosis is shown by phospho-histone H3 Ser10 immunostaining of lung cancer PDX models after treatments with vehicle or CYC065. Representative phospho-histone H3 Ser10 immunostained images that indicate bipolar mitosis in the vehicle-treated group and multipolar mitosis in the CYC065-treated group are displayed. Percentages of cells with multipolar mitosis in lung cancer PDX models after vehicle or CYC065 treatments are shown. Bars represent mean values and standard deviations *P < 0.05 by the Student’s t test.

Similar articles

Cited by

References

    1. Hanahan D, Weinberg RA. Hallmarks of cancer: the next generation. Cell 2011;144(5):646–74. - PubMed
    1. Lingle WL, Lutz WH, Ingle JN, Maihle NJ, Salisbury JL. Centrosome hypertrophy in human breast tumors: implications for genomic stability and cell polarity. Proc Natl Acad Sci (USA) 1998;95(6):2950–5. - PMC - PubMed
    1. Nigg EA. Centrosome aberrations: cause or consequence of cancer progression? Nat Rev Cancer 2002;2(11):815–25. - PubMed
    1. Kramer A, Neben K, Ho AD. Centrosome replication, genomic instability and cancer. Leukemia 2002;16(5):767–75. - PubMed
    1. Zyss D, Gergely F. Centrosome function in cancer: guilty or innocent? Trends Cell Biol 2009;19(7):334–46. - PubMed

Publication types

Substances