. 2020 Dec 4;11(12):1034.
doi: 10.1038/s41419-020-03242-x.

Chloroquine reverses chemoresistance via upregulation of p21WAF1/CIP1 and autophagy inhibition in ovarian cancer

Affiliations

Chloroquine reverses chemoresistance via upregulation of p21WAF1/CIP1 and autophagy inhibition in ovarian cancer

Jae Ryoung Hwang et al. Cell Death Dis. .

Abstract

Overcoming drug-resistance is a big challenge to improve the survival of patients with epithelial ovarian cancer (EOC). In this study, we investigated the effect of chloroquine (CQ) and its combination with cisplatin (CDDP) in drug-resistant EOC cells. We used the three EOC cell lines CDDP-resistant A2780-CP20, RMG-1 cells, and CDDP-sensitive A2780 cells. The CQ-CDDP combination significantly decreased cell proliferation and increased apoptosis in all cell lines. The combination induced expression of γH2AX, a DNA damage marker protein, and induced G2/M cell cycle arrest. Although the CQ-CDDP combination decreased protein expression of ATM and ATR, phosphorylation of ATM was increased and expression of p21WAF1/CIP1 was also increased in CQ-CDDP-treated cells. Knockdown of p21WAF1/CIP1 by shRNA reduced the expression of γH2AX and phosphorylated ATM and inhibited caspase-3 activity but induced ATM protein expression. Knockdown of p21WAF1/CIP1 partly inhibited CQ-CDDP-induced G2/M arrest, demonstrating that knockdown of p21WAF1/CIP1 overcame the cytotoxic effect of the CQ-CDDP combination. Ectopic expression of p21WAF1/CIP1 in CDDP-treated ATG5-shRNA/A2780-CP20 cells increased expression of γH2AX and caspase-3 activity, demonstrating increased DNA damage and cell death. The inhibition of autophagy by ATG5-shRNA demonstrated similar results upon CDDP treatment, except p21WAF1/CIP1 expression. In an in vivo efficacy study, the CQ-CDDP combination significantly decreased tumor weight and increased expression of γH2AX and p21WAF1/CIP1 in A2780-CP20 orthotopic xenografts and a drug-resistant patient-derived xenograft model of EOC compared with controls. These results demonstrated that CQ increases cytotoxicity in combination with CDDP by inducing lethal DNA damage by induction of p21WAF1/CIP1 expression and autophagy inhibition in CDDP-resistant EOC.


Conflict of interest statement

The authors declare that they have no conflict of interest.

Figures
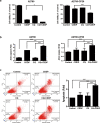
Fig. 1
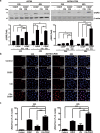
Fig. 1. CQ sensitized EOC cells to CDDP.
a CDDP-sensitive (A2780) and CDDP-resistant (A2780-CP20) EOC cells were treated with CDDP and CQ for 72 h, and cell viability was measured by MTT assay. Results are demonstrated by a bar graph. b Apoptotic cell death was measured by ELISA for detecting active caspase-3. A2780 and A2780-CP20 cells were treated with CDDP (1 µM and 5 µM, respectively) and CQ (20 µM and 30 µM, respectively) as indicated for 48 h, and cell lysates were used for caspase-3 assay. Results are shown as the mean ± SD of triplicate observations from three experiments (n = 3, *P < 0.05, **P < 0.01, ***P < 0.001). c A2780-CP20 cells were stained with Hoechst/propidium iodide to detect the contribution to apoptosis and necrotic cell death after treatment with CDDP and CQ for 48 h. The representative FACS data obtained from three experiments and a bar graph representing apoptotic cells are shown as the mean ± SD (n = 3, ***P < 0.001).
Fig. 2
Fig. 2. CQ increased CDDP-induced DNA damage in EOC cells.
a EOC cells were treated with either CDDP, CQ, or the combination of CQ and CDDP for 24 h and 48 h. Phosphorylation of histone H2AX (γH2AX) was detected by western blot using anti-γH2AX antibody. b Nuclear foci formation of γH2AX was determined by immunofluorescent staining in A2780-CP20 cells treated with each drug as indicated (X400, scale bar represents 20 μm). DAPI was used for nuclear staining. c Nuclear foci formation of γH2AX obtained from b was quantified by a bar graph after calculating the number of nuclear foci of γH2AX and nuclei. The bar graph was generated with data obtained from three experiments (n = 3, *P < 0.05, **P < 0.01, ***P < 0.001).
Fig. 3
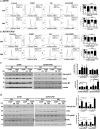
Fig. 3. The CQ-CDDP combination arrested the cell cycle at G2/M and regulated ATM/ATR.
a A2780 and b A2780-CP20 cells were incubated with each drug or the combination of drugs for 24 h and 48 h. Cells were stained with propidium iodide, and cell cycle distribution was measured by flow cytometry. Flow cytometry was performed three times, and representative data are presented. Cell cycle distribution was demonstrated by a bar graph and the statistical data represented for G2/M-arrested cell numbers compared with the control-treated cells. c Activation and expression of cell cycle-related proteins (Cdc2 and cyclin B1) were studied by western blot analysis in A2780 and A2780-CP20 cells using anti-phospho-specific antibody and antibodies recognizing the total proteins. The amount of phosphorylation of Cdc2 normalized by the amount of total Cdc2 expression in A2780 and A2780-CP20 cells is represented by a bar graph in the upper panel and lower panel, respectively. d DNA damage-recognizing proteins, ATM and ATR, were analyzed in A2780 and A2780-CP20 cells by western blot using phospho-specific antibodies and antibodies recognizing both the phosphorylated and unphosphorylated proteins. Arrow indicates ATR. Western blotting was performed at least three times, and a representative figure is presented. The amount of phosphorylation of ATM normalized by total ATM expression in A2780 and A2780-CP20 cells is represented by a bar graph in the upper panel and lower panel, respectively (n = 3, mean ± SD, *P < 0.05, **P < 0.01, ***P < 0.001).
Fig. 4
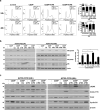
Fig. 4. CQ had a similar effect to ATM or ATR inhibitor in combination with CDDP on the cell cycle.
a Cell cycle distribution was analyzed by flow cytometry in A2780-CP20 cells treated with CDDP alone or in combination with ATM or ATR inhibitor for 24 h and 48 h. Flow cytometry was performed three times, and representative data are presented. Cell cycle distribution was demonstrated by a bar graph and the statistical data represented for G2/M-arrested cell numbers compared with the control cells. b A2780-CP20 cells were incubated with CDDP, CQ, ATR inhibitor, ATM inhibitor, or the combination of CDDP with either CQ, ATRi, or ATMi for 24 h and 48 h. Western blot for ATM and ATR was performed using antibodies for phospho-specific and antibodies recognizing both the phosphorylated and unphosphorylated proteins as indicated. The amount of phosphorylation of ATM normalized by the amount of total ATM expression is represented by a bar graph in the right panel. Arrow indicates ATR. c Expression of cell cycle-related proteins was determined in A2780-CP20 cells after 24 h and 48 h treatment with the CQ-CDDP combination. Western blot analysis was performed three times, and the representative data are presented (n = 3, mean ± SD, *P < 0.05, **P < 0.01, ***P < 0.001).
Fig. 5
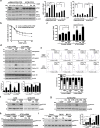
Fig. 5. CQ increased CDDP-induced cell death in drug-resistant EOC through autophagy inhibition and induction of p21WAF1/CIP1.
a A2780-CP20 cells stably expressing control or ATG5 shRNA were treated with CDDP for 48 h, and the expression of ATG5 and autophagy marker proteins, LC3 and p62, were analyzed by western blot using specific antibodies. Knockdown efficiency of ATG5 was shown by western blot. Expression of LC3 and p62 was also analyzed by western blot in A2780-CP20 cells treated with CDDP, CQ, or the CQ-CDDP combination for 48 h. β-actin was used for a protein-loading control. shRNA/CP20 represents control-shRNA- or ATG5-shRNA-expressing A2780-CP20 cells. Western blot was performed three times, and representative data are presented (left panel). The amounts of p62 and LC3-I and -II normalized to the amount of β-actin are represented by a bar graph (middle and right panels, respectively). b Cell viability was measured by MTT assay in A2780-CP20 cells stably expressing control- (closed squares) or ATG5-shRNA (open triangles) in the presence of different concentrations of CDDP at 72 h. c Apoptotic cell death was measured by ELISA for detecting active caspase-3. Control-shRNA and ATG5-shRNA/A2780-CP20 cells were treated with CDDP and CQ as indicated for 48 h, and cell lysates were used for caspase-3 assay. Results are shown as the mean ± SD of duplicate observations from three experiments (n = 3, **P < 0.01, ***P < 0.001). d To analyze DNA damage recognition proteins and downstream cell cycle-related proteins, cell lysates were analyzed on a 4–12% gradient SDS-PAGE by western blot in shRNA/A2780-CP20 stable cells after incubation with CDDP, CQ, and CQ-CDDP combination for 48 h. Amounts of phosphorylated ATM and Cdc2 normalized by the amount of each total protein are represented by a bar graph in the lower panels. e Cell cycle distribution of A2780-CP20 stable cells expressing either control- or ATG5-shRNA was analyzed after incubation with CDDP, CQ or CQ combined with CDDP for 48 h (upper panel). Flow cytometry was performed for three experiments, and representative data are shown. Cell cycle distribution was represented by bar graphs and the statistical data demonstrated cell number in G2/M (lower panel) compared with the control. f Expression of p21WAF1/CIP1 was analyzed by western blot of A2780 and A2780-CP20 cells after incubation with CDDP, CQ, or CQ-CDDP combination. g A2780-CP20 cells were incubated with CDDP, CQ, ATR inhibitor, ATM inhibitor, or the combination of CDDP with either CQ, ATRi, or ATMi for 48 h. Expression of p21WAF1/CIP1 was analyzed by western blot. h Expression of p21WAF1/CIP1 was determined by western blot in shRNA/A2780-CP20 stable cells after incubation with CQ for 48 h. Expression of p21WAF1/CIP1 was determined by western blot analysis in control shRNA and ATG5 shRNA/A2780-CP20 cells treated with drugs as indicated. i A2780-CP20 cells were incubated with CDDP, CQ, bafilomycin A1 (Baf-A1), CQ-Baf-A1 combination, MG-132, or the combination of CDDP with CQ or MG-132 as indicated. CQ and CDDP were treated for 48 h and Baf-A1 and MG-132 were treated overnight. Western blot was performed using anti-p21WAF1/CIP1 antibody. Western blot analysis was performed at least three times, and representative data are presented in this study (mean ± SD, *P < 0.05, **P < 0.01, ***P < 0.001).
Fig. 6
Fig. 6. Expression of p21WAF1/CIP1 was important for the cytotoxic effect of CQ-CDDP.
a, b Proteins related to DNA damage and cell cycle progression were analyzed by western blot in control-shRNA and p21WAF1/CIP1-shRNA/A2780-CP20 cells. The amount of ATM normalized by β-actin is represented by a bar graph. Amounts of phosphorylated ATM and Cdc2 normalized by the amount of each total protein are represented by a bar graph in the right panel (upper and lower panels, respectively). c Active caspase-3 was measured in control-shRNA and p21WAF1/CIP1-shRNA cells after treatment of drugs for 48 h as indicated. Results are shown as the mean ± SD of triplicate observations from three experiments. d Cell cycle distribution of A2780-CP20 stable cells expressing either control- or p21WAF1/CIP1-shRNA was analyzed after incubation with CDDP, CQ, or CQ combined with CDDP for 48 h. Flow cytometry was performed for three experiments, and representative data are shown. Cell cycle distribution was represented by bar graphs and the statistical data demonstrated cell number in G2/M (right panel) compared with the control. e, f HA-tagged p21WAF1/CIP1 or the empty vector were transfected into control-shRNA and ATG5-shRNA/A2780-CP20 cells. After transfection, cells were incubated with CDDP for 48 h. Expression of HA-tagged p21WAF1/CIP1 was analyzed by western blot using anti-p21WAF1/CIP1 antibody. Expression of proteins involved in DNA damage and cell cycle progression as well as γH2AX was detected by western blot using their specific antibodies. β-actin served as a protein-loading control. Arrow indicates ATR expression. g Caspase-3 activity was measured by detecting active caspase-3 in cells transfected with HA-tagged p21WAF1/CIP1 plasmid or the control vector, followed by incubation with CDDP. Results are shown as the mean ± SD of duplicate observations from three experiments (n = 3, mean ± SD, *P < 0.05, **P < 0.01, ***P < 0.001, ns not significant).
Fig. 7
Fig. 7. The CQ-CDDP combination significantly decreased tumor growth in drug-resistant EOC orthotopic xenograft and PDX models.
a Drug-resistant EOC orthotopic mice were generated by i.p. injection of A2780-CP20 cells, and each drug was injected into the mice. After mice were sacrificed, tumors were isolated and weighed. Tumor weights are shown on a scatter plot. bd Tumor tissues obtained from orthotopic mice were stained with antibodies against Ki67, a proliferation marker; γH2AX, a DNA damage marker protein; or p21WAF1/CIP1 (X200, left panels). Bar graphs (right panels) show numbers of Ki67-, γH2AX-, or p21WAF1/CIP1-stained nuclei relative to total hematoxylin-stained nuclei. Scale bar represents 200 μm. e EOC PDX mice were generated using subrenal implantation with a tumor from a patient with drug-resistant serous papillary adenocarcinoma; each drug or the combination of CQ and CDDP was injected into the peritoneal cavity of xenograft mice. Left panel shows tumor size compared with a kidney obtained from the same mouse, and right panel shows tumor weight on a scatter plot. fh Tumor tissues obtained from PDX mice were stained with antibodies against Ki67, γH2AX, and p21WAF1/CIP1 (X200, left panels). Scale bar represents 200 μm. Bar graphs (right panels) show numbers of Ki67-, γH2AX-, or p21WAF1/CIP1-stained nuclei relative to total hematoxylin-stained nuclei. All data represent the mean ± SD (*P < 0.05, **P < 0.01, ***P < 0.001). i A proposed functional mechanism of CQ-CDDP in chemo-resistant EOC.

Similar articles

Cited by

References

    1. Kim S, et al. Tumor evolution and chemoresistance in ovarian cancer. NPJ Precis Oncol. 2018;2:20. doi: 10.1038/s41698-018-0063-0. - DOI - PMC - PubMed
    1. Agarwal R, Kaye SB. Ovarian cancer: strategies for overcoming resistance to chemotherapy. Nat. Rev. Cancer. 2003;3:502–516. doi: 10.1038/nrc1123. - DOI - PubMed
    1. Chen X, et al. Sequential combination therapy of ovarian cancer with cisplatin and gamma-secretase inhibitor MK-0752. Gynecol. Oncol. 2016;140:537–544. doi: 10.1016/j.ygyno.2015.12.011. - DOI - PubMed
    1. Vetter MH, Hays JL. Use of targeted therapeutics in epithelial ovarian cancer: a review of current literature and future directions. Clin. Ther. 2018;40:361–371. doi: 10.1016/j.clinthera.2018.01.012. - DOI - PubMed
    1. Dasari S, Tchounwou PB. Cisplatin in cancer therapy: molecular mechanisms of action. Eur. J. Pharm. 2014;740:364–378. doi: 10.1016/j.ejphar.2014.07.025. - DOI - PMC - PubMed

Publication types

MeSH terms