. 2020 Dec 4;10(1):21306.
doi: 10.1038/s41598-020-77420-4.

Age-stratified discrete compartment model of the COVID-19 epidemic with application to Switzerland

Affiliations

Age-stratified discrete compartment model of the COVID-19 epidemic with application to Switzerland

Fadoua Balabdaoui et al. Sci Rep. .

Abstract

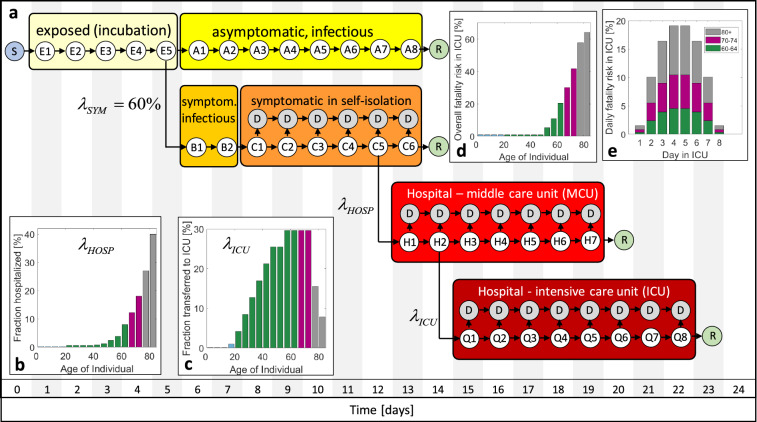
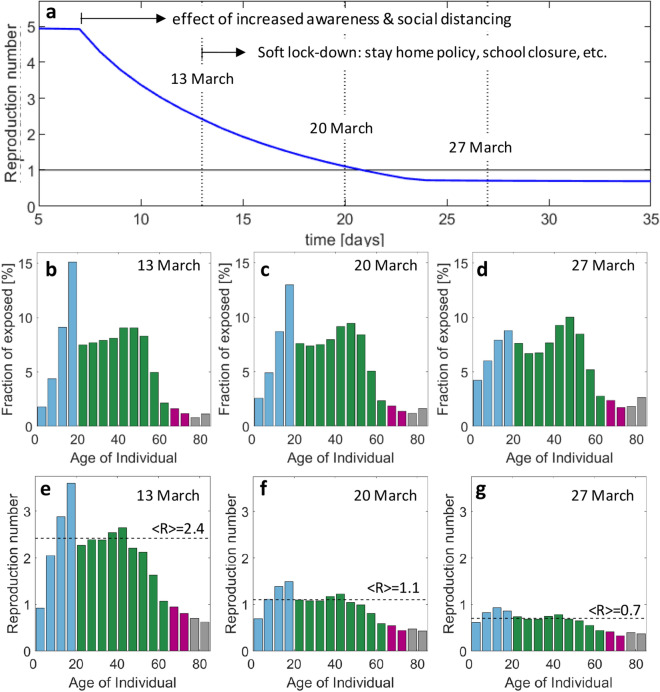
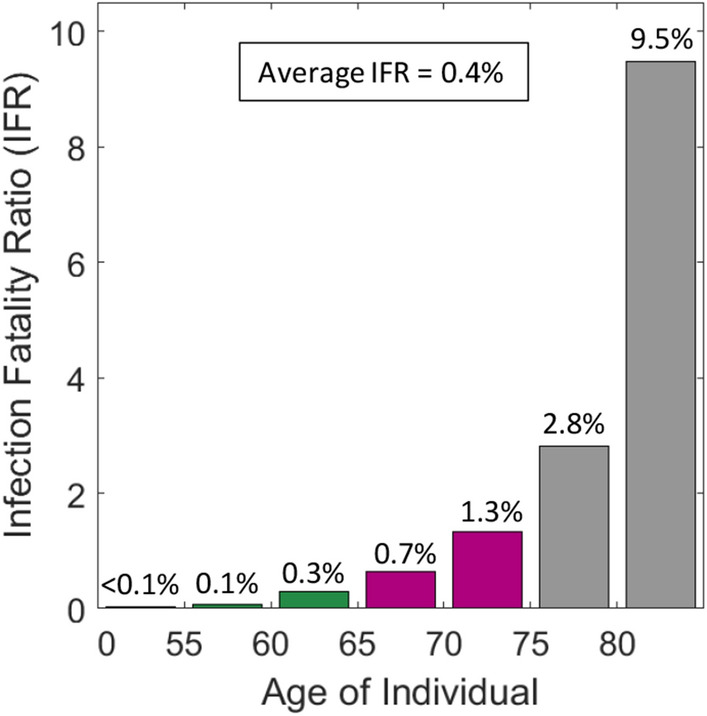
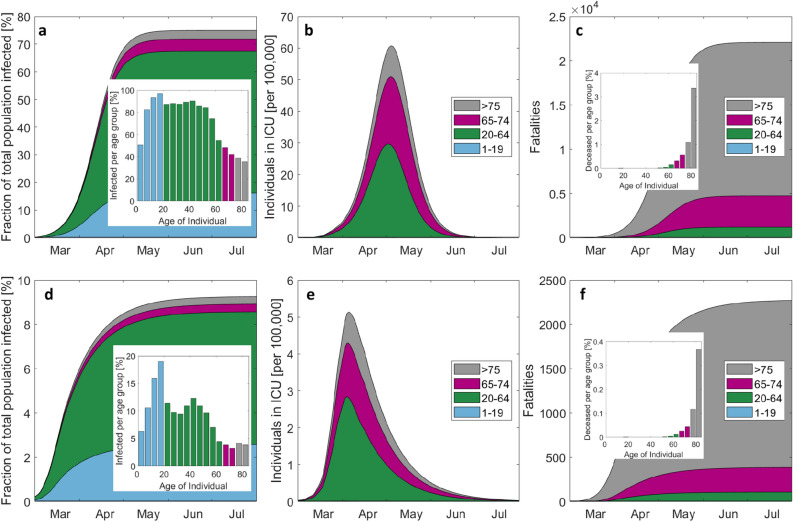
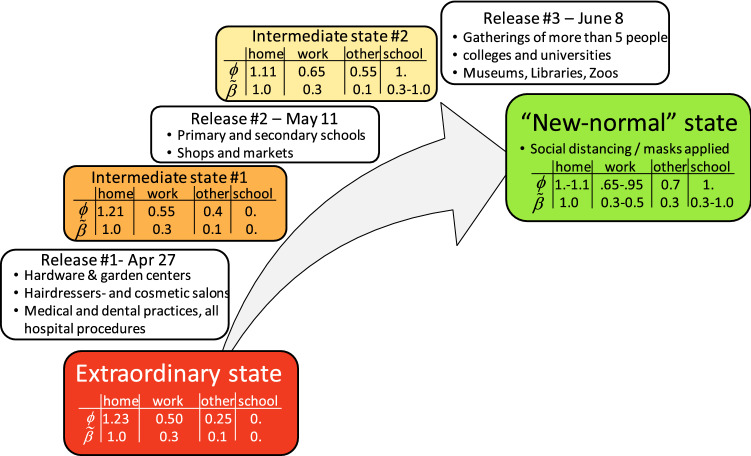
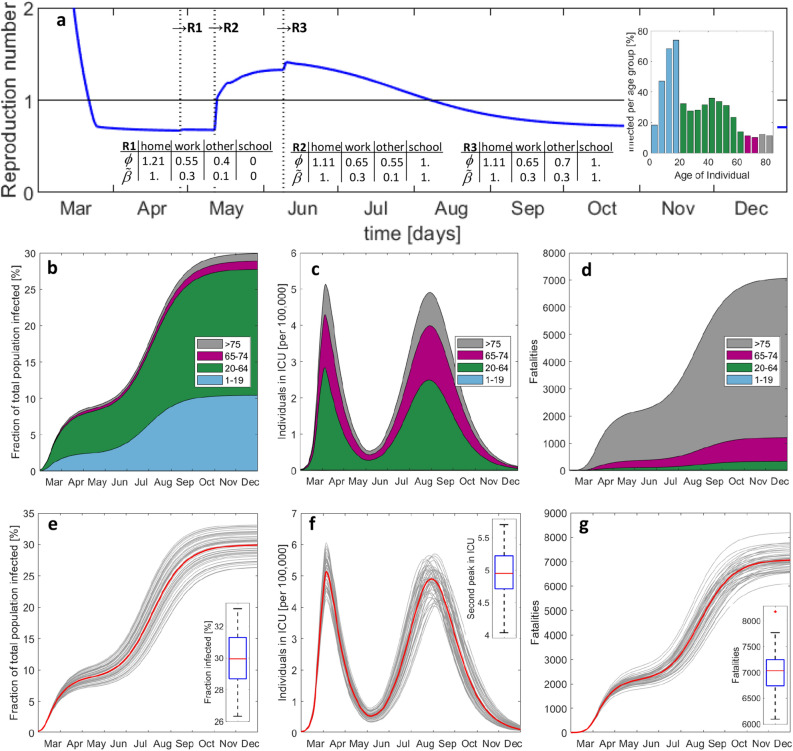
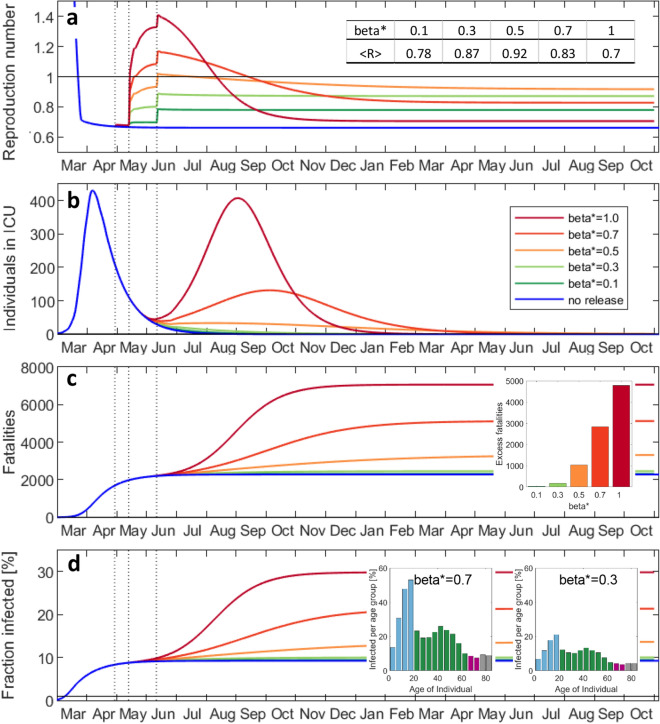
Compartmental models enable the analysis and prediction of an epidemic including the number of infected, hospitalized and deceased individuals in a population. They allow for computational case studies on non-pharmaceutical interventions thereby providing an important basis for policy makers. While research is ongoing on the transmission dynamics of the SARS-CoV-2 coronavirus, it is important to come up with epidemic models that can describe the main stages of the progression of the associated COVID-19 respiratory disease. We propose an age-stratified discrete compartment model as an alternative to differential equation based S-I-R type of models. The model captures the highly age-dependent progression of COVID-19 and is able to describe the day-by-day advancement of an infected individual in a modern health care system. The fully-identified model for Switzerland not only predicts the overall histories of the number of infected, hospitalized and deceased, but also the corresponding age-distributions. The model-based analysis of the outbreak reveals an average infection fatality ratio of 0.4% with a pronounced maximum of 9.5% for those aged ≥ 80 years. The predictions for different scenarios of relaxing the soft lockdown indicate a low risk of overloading the hospitals through a second wave of infections. However, there is a hidden risk of a significant increase in the total fatalities (by up to 200%) in case schools reopen with insufficient containment measures in place.


Conflict of interest statement

The authors declare no competing interests.

Figures

Figure 1
Figure 1
Discrete transmission model for COVID-19. (a) The different compartments comprise susceptible (S), exposed (E), asymptomatic (A), symptomatic before (B) and in self-isolation (C), hospitalized in MCU (H) and ICU (Q), removed (R) and deceased (D) individuals. Individuals are classified into sub-compartments E1, E2, etc. according to the number of days they have spent in a given comportment. (b) age-dependent probability of hospitalization of symptomatic individuals, (c) probability of transfer from MCU to ICU, (d) fatality risk in ICU, (e) daily fatality ratio in ICU exemplarily shown for age-groups 80 + , 70–74 and 60–64.
Figure 2
Figure 2
Model identification and validation for Switzerland. (a) History of fatalities, (b) age distribution of deceased and location distribution (pie charts), (c) history of individuals in hospital (MCU and ICU combined) and those in ICU, (d) age distribution of hospitalized. The values provided in parentheses in (b) and (d) correspond to the documented data for April 20. Day 1 on the charts shown in (a) and (c) corresponds to March 1, 2020.
Figure 3
Figure 3
Reproduction number for first wave of epidemic. (a) Evolution of reproduction number (average weighted by the age distribution of the exposed) during transient phase induced by increased awareness and government measures. Age distribution of the compartment of exposed individuals on (b) March 13, (c) March 20 and (d) March 27. The corresponding age-stratified reproduction numbers for these dates are shown in (eg).
Figure 4
Figure 4
Estimated age-specific infection fatality ratio (IFR). The weighted average is computed based on the age distribution in the compartment of exposed individuals on April 20th.
Figure 5
Figure 5
Evolution of the epidemic for the hypothetical cases of no measures taken (top) and perpetual extraordinary state (bottom). (a) and (d) show the cumulative cases and the final age-distribution by the end of the epidemic, the number of individuals in ICU is shown by (b) and (e), while the cumulated number of fatalities is depicted in (c,f). Note that the scales of the top and bottom figures differ by one order of magnitude.
Figure 6
Figure 6
Roadmap for transitioning from an extraordinary state to a “new-normal” state. The progressive release will generate two intermediate states. The scaling factors ϕi for the location-dependent contact matrices and the associated knock-down factors β* for the transmission probability prior to the soft lock-down are given in a table for each state.
Figure 7
Figure 7
Predicted evolution of the epidemic after step-wise release of measures including school reopening without special caution. Histories of (a) average reproduction number, (b) total number of exposed, (c) individuals in ICU, and (d) accumulated fatalities. The vertical lines in (a) indicate the instants of release measures #1 to #3. The inserted bar plot shows the infected per age-group by December 2020. (eg) Results from Monte-Carlo analysis. The 50 Gy curves in each plot are obtained after a random perturbation of the main model parameters, while the red curve corresponds to the respective deterministic solution reported in (bd). The boxplots show the median (red), the 25th and 75th percentiles (in blue), the extreme data (black) and outliers (red star symbol).
Figure 8
Figure 8
Effect of special caution at school on the evolution of the epidemic. Histories of (a) average reproduction number, (b) individuals in ICU, (c) accumulated fatalities, (d) fraction of the total population infected. The factor β* represents the reduction of the probability of transmission at school. The table insert in (a) denotes the average reproduction number in October 2021. The insert in (c) shows the death toll (fatalities in excess of result for no release) for reopening schools as function of β*. The inserts in (d) illustrate the age-distribution of the infected.

References

    1. Guan W, et al. Clinical characteristics of coronavirus disease 2019 in China. New Eng. J. Med. 2020;382:1708–1720. doi: 10.1056/NEJMoa2002032. - DOI - PMC - PubMed
    1. Hethcote HW. The mathematics of infectious diseases. SIAM Rev. 2000 doi: 10.1137/S0036144500371907. - DOI
    1. Ferguson, N. M. et al. Impact of non-pharmaceutical interventions (NPIs) to reduce COVID-19 mortality and healthcare demand (preprint). 10.25561/77482 (2020). - PMC - PubMed
    1. Lin Q, et al. A conceptual model for the coronavirus disease 2019 (COVID-19) outbreak in Wuhan, China with individual reaction and governmental action. Int. J. Infect. Dis. 2020;93:211–216. doi: 10.1016/j.ijid.2020.02.058. - DOI - PMC - PubMed
    1. Prem K, et al. The effect of control strategies to reduce social mixing on outcomes of the COVID-19 epidemic in Wuhan, China: A modelling study. Lancet. 2020 doi: 10.1016/S2468-2667(20)30073-6. - DOI - PMC - PubMed