

High yield synthesis of graphene quantum dots from biomass waste as a highly selective probe for Fe3+ sensing
- PMID: 33277551
- PMCID: PMC7718218
- DOI: 10.1038/s41598-020-78070-2
High yield synthesis of graphene quantum dots from biomass waste as a highly selective probe for Fe3+ sensing
Abstract
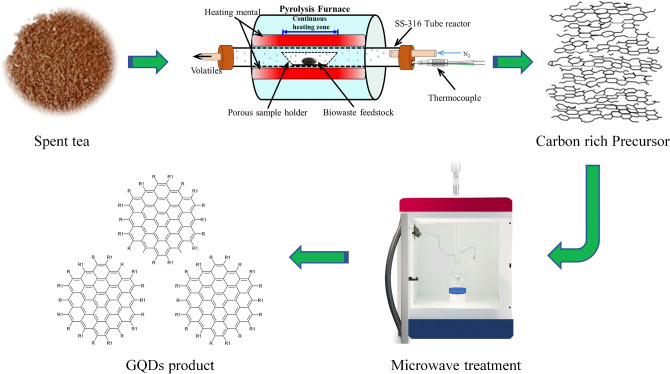
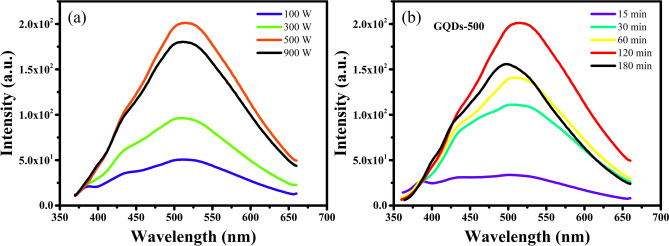
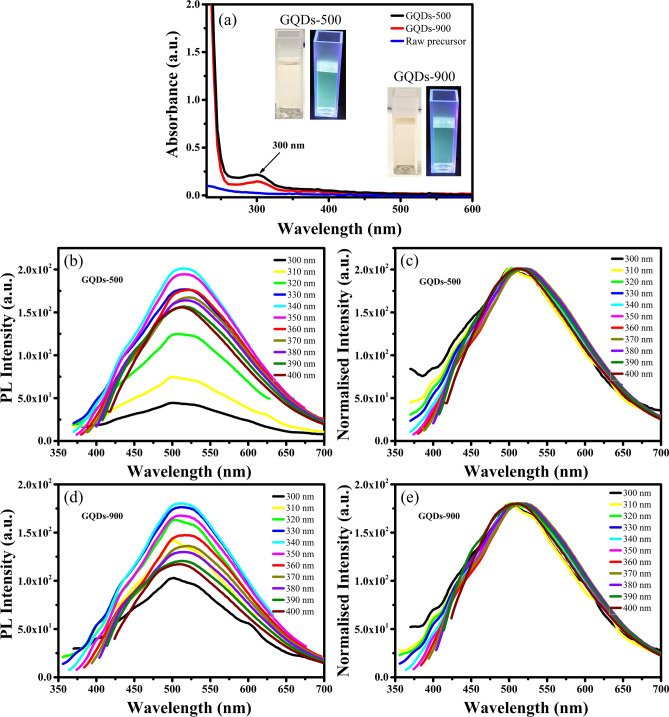
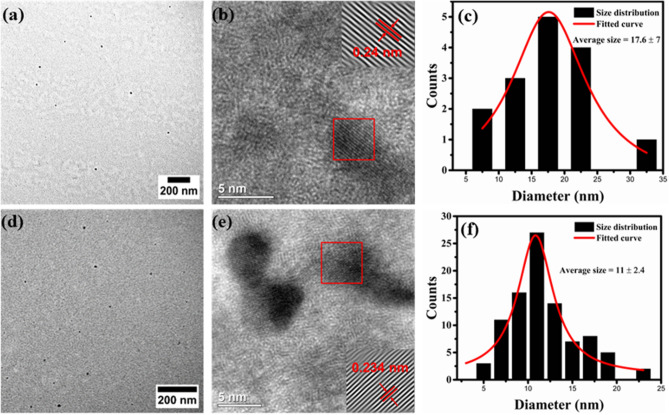
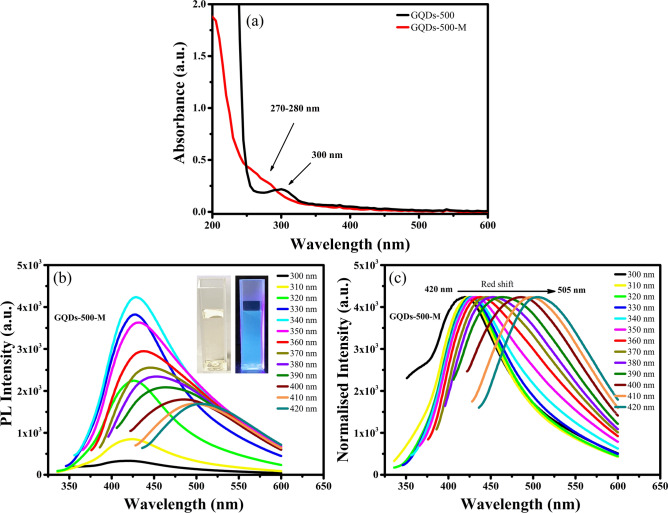
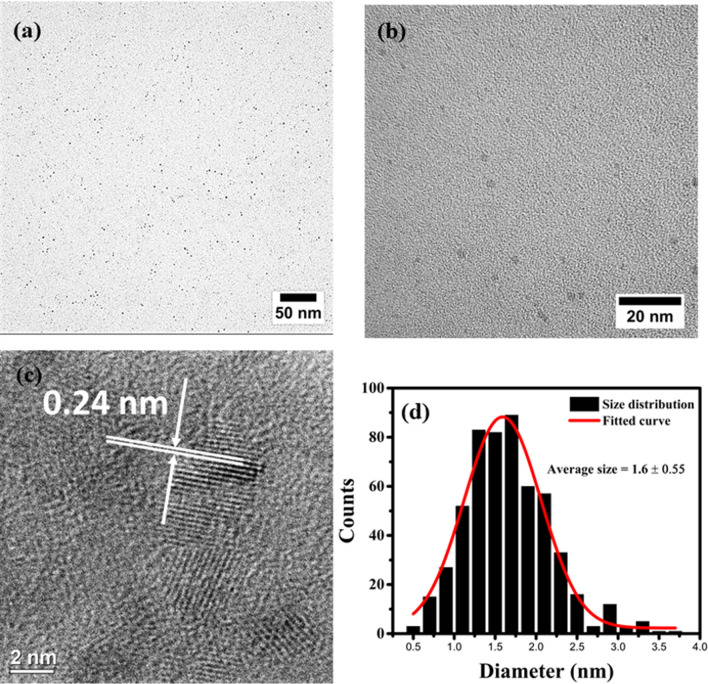
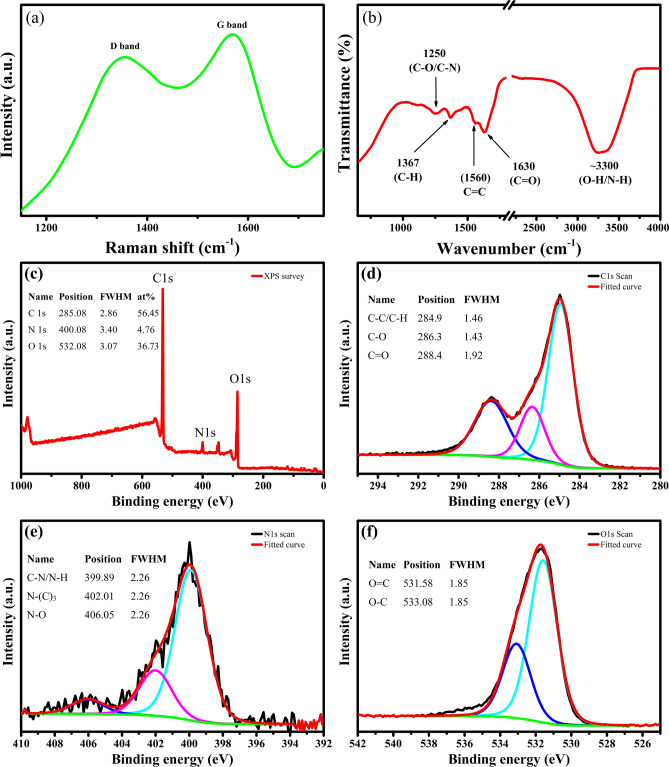
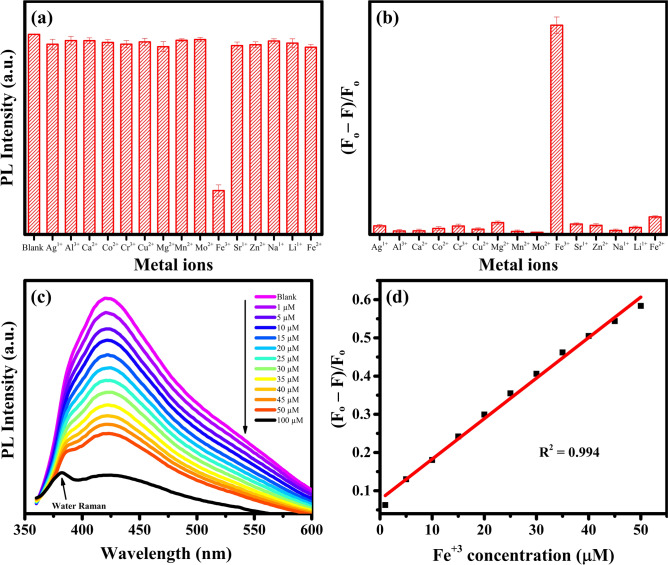
Graphene quantum dots (GQDs), a novel type of zero-dimensional fluorescent materials, have gained considerable attention owing to their unique optical properties, size and quantum confinement. However, their high cost and low yield remain open challenges for practical applications. In this work, a low cost, green and renewable biomass resource is utilised for the high yield synthesis of GQDs via microwave treatment. The synthesis approach involves oxidative cutting of short range ordered carbon derived from pyrolysis of biomass waste. The GQDs are successfully synthesised with a high yield of over 84%, the highest value reported to date for biomass derived GQDs. As prepared GQDs are highly hydrophilic and exhibit unique excitation independent photoluminescence emission, attributed to their single-emission fluorescence centre. As prepared GQDs are further modified by simple hydrothermal treatment and exhibit pronounced optical properties with a high quantum yield of 0.23. These modified GQDs are used for the highly selective and sensitive sensing of ferric ions (Fe3+). A sensitive sensor is prepared for the selective detection of Fe3+ ions with a detection limit of as low as 2.5 × 10⁻⁶ M. The utilisation of renewable resource along with facile microwave treatment paves the way to sustainable, high yield and cost-effective synthesis of GQDs for practical applications.
Conflict of interest statement
The authors declare no competing interests.
Figures
Similar articles
-
A holistic review on red fluorescent graphene quantum dots, its synthesis, unique properties with emphasis on biomedical applications.Heliyon. 2024 Aug 8;10(16):e35760. doi: 10.1016/j.heliyon.2024.e35760. eCollection 2024 Aug 30. Heliyon. 2024. PMID: 39220916 Free PMC article. Review.
-
Eco-Friendly Sustainable Synthesis of Graphene Quantum Dots from Biowaste as a Highly Selective Sensor.Nanomaterials (Basel). 2022 Oct 21;12(20):3696. doi: 10.3390/nano12203696. Nanomaterials (Basel). 2022. PMID: 36296886 Free PMC article.
-
Selective, Sensitive and Label-Free Detection of Fe3+ Ion in Tap Water Using Highly Fluorescent Graphene Quantum Dots.J Fluoresc. 2019 May;29(3):541-548. doi: 10.1007/s10895-019-02365-5. Epub 2019 Mar 22. J Fluoresc. 2019. PMID: 30903353
-
One-step synthesis of boron-doped graphene quantum dots for fluorescent sensors and biosensor.Talanta. 2019 Jul 1;199:581-589. doi: 10.1016/j.talanta.2019.02.098. Epub 2019 Mar 1. Talanta. 2019. PMID: 30952301
-
Green synthesis of carbon quantum dots and their environmental applications.Environ Res. 2022 Sep;212(Pt B):113283. doi: 10.1016/j.envres.2022.113283. Epub 2022 Apr 21. Environ Res. 2022. PMID: 35461844 Review.
Cited by
-
A holistic review on red fluorescent graphene quantum dots, its synthesis, unique properties with emphasis on biomedical applications.Heliyon. 2024 Aug 8;10(16):e35760. doi: 10.1016/j.heliyon.2024.e35760. eCollection 2024 Aug 30. Heliyon. 2024. PMID: 39220916 Free PMC article. Review.
-
Tuning Nanographene-Enhanced Raman Scattering for Rapid Label-Free Detection of Amino Acids.ACS Appl Mater Interfaces. 2024 Oct 9;16(40):54377-54388. doi: 10.1021/acsami.4c08298. Epub 2024 Sep 24. ACS Appl Mater Interfaces. 2024. PMID: 39316462 Free PMC article.
-
Quantum Material-Based Self-Propelled Microrobots for the Optical "On-the-Fly" Monitoring of DNA.ACS Appl Mater Interfaces. 2023 Dec 20;15(50):58548-58555. doi: 10.1021/acsami.3c09920. Epub 2023 Dec 11. ACS Appl Mater Interfaces. 2023. PMID: 38078399 Free PMC article.
-
Graphene quantum dots for biosensing and bioimaging.RSC Adv. 2024 May 17;14(23):16001-16023. doi: 10.1039/d4ra01431f. eCollection 2024 May 15. RSC Adv. 2024. PMID: 38765479 Free PMC article. Review.
-
Eco-Friendly and Sustainable Pathways to Photoluminescent Carbon Quantum Dots (CQDs).Nanomaterials (Basel). 2023 Jan 30;13(3):554. doi: 10.3390/nano13030554. Nanomaterials (Basel). 2023. PMID: 36770515 Free PMC article. Review.
References
-
- Abbas A, Mariana LT, Phan AN. Biomass-waste derived graphene quantum dots and their applications. Carbon. 2018;140:77–99. doi: 10.1016/j.carbon.2018.08.016. - DOI
-
- Ananthanarayanan A, et al. Facile synthesis of graphene quantum dots from 3D graphene and their application for Fe3+ sensing. Adv. Funct. Mater. 2014;24:3021–3026. doi: 10.1002/adfm.201303441. - DOI
-
- Zhang Z, Zhang J, Chen N, Qu L. Graphene quantum dots: an emerging material for energy-related applications and beyond. Energy Environ. Sci. 2012;5:8869–8890. doi: 10.1039/c2ee22982j. - DOI
Publication types
LinkOut - more resources
Full Text Sources
Research Materials
