. 2020 Dec 4;10(1):21256.
doi: 10.1038/s41598-020-77628-4.

Management strategies in a SEIR-type model of COVID 19 community spread

Affiliations

Management strategies in a SEIR-type model of COVID 19 community spread

Anca Rǎdulescu et al. Sci Rep. .

Abstract

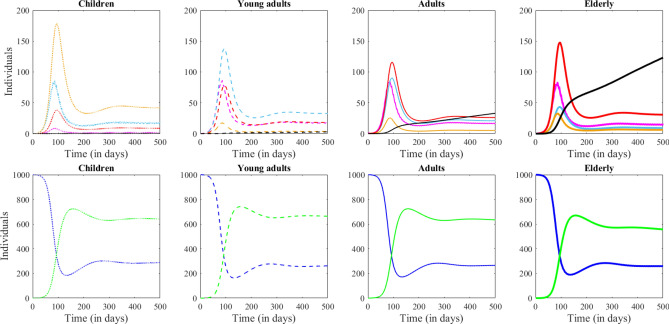
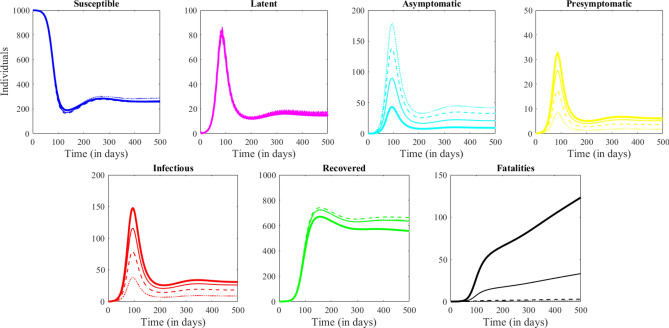
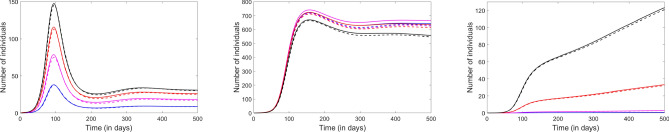
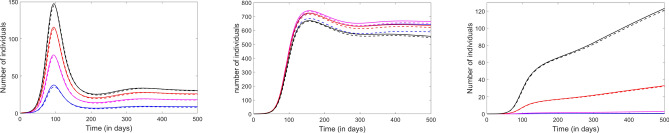
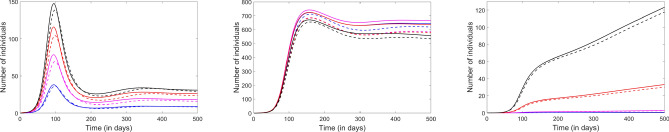
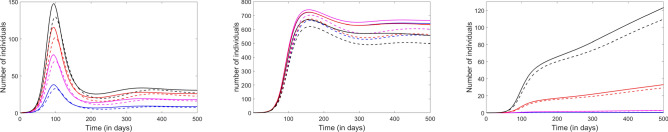
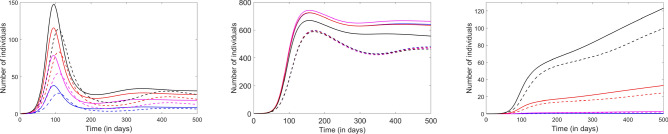
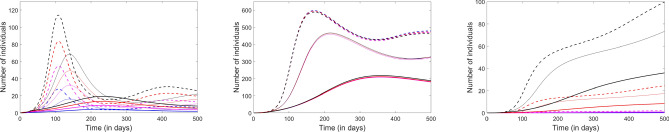
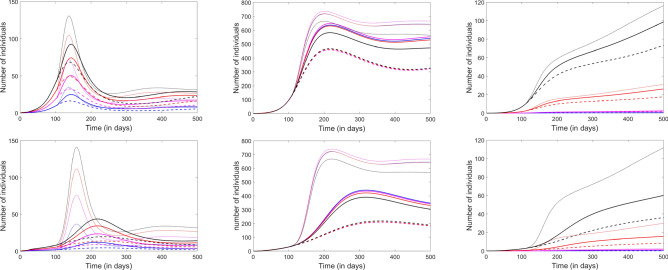
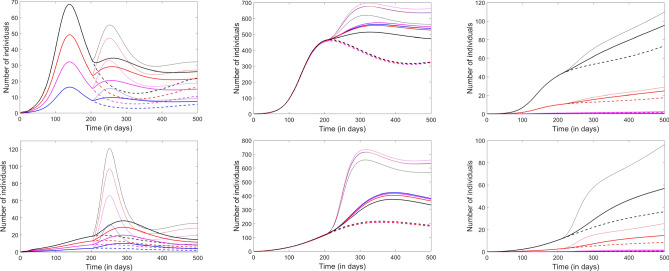
The 2019 Novel Corona virus infection (COVID 19) is an ongoing public health emergency of international focus. Significant gaps persist in our knowledge of COVID 19 epidemiology, transmission dynamics, investigation tools and management, despite (or possibly because of) the fact that the outbreak is an unprecedented global threat. On the positive side, enough is currently known about the epidemic process to permit the construction of mathematical predictive models. In our work, we adapt a traditional SEIR epidemic model to the specific dynamic compartments and epidemic parameters of COVID 19, as it spreads in an age-heterogeneous community. We analyze management strategies of the epidemic course (as they were implemented through lockdown and reopening procedures in many of the US states and countries worldwide); however, to more clearly illustrate ideas, we focus on the example of a small scale college town community, with the timeline of control measures introduced in the state of New York. We generate predictions, and assess the efficiency of these control measures (closures, mobility restrictions, social distancing), in a sustainability context.


Conflict of interest statement

The authors declare no competing interests.

Figures

Figure 1
Figure 1
System dynamics in absence of any preventive measures. Each column shows the evolution of one age group (from left to right: Children, Young adults, Adults and Elderly). The Symptomatic and Recovered compartments are shown in separate panels, for clarity of the illustration (larger scale than the other compartments). The number of Susceptible individuals is shown in blue, the Latent in pink, Asymptomatic in cyan, Presymptomatic in orange, Infected in red, the Recovered in green and the Fatalities in black.
Figure 2
Figure 2
System dynamics in absence of any preventive measures. Each panel shows the dynamics in one model compartment (from left to right: Susceptible, Exposed, Infected, Recovered and Dead.) In each panel, each age is represented by a different line type: Children as a dotted line, Young adults are a dashed line, Adults as a thin solid line and Elderly as a thick solid line.
Figure 3
Figure 3
Effect of the campus closure on the system dynamics. The left panel shows the rise and fall of the infected compartment, the center panel shows the recovered compartment and the right panel shows the accumulation of fatalities. Each age group is represented in one color: Children (blue), Young adults (pink), Adults (red) and Elderly (black). The solid curves illustrate the solutions in absence of closures; the dashed curves show the effect of the campus closure implemented 10 days after infection.
Figure 4
Figure 4
Effect of the school district closure on the system dynamics. The left panel represents the infected compartment, the center panel shows the recovered compartment and the right panel, the fatalities. Each age group is represented in one color: Children (blue), Young adults (pink), Adults (red) and Elderly (black). The solid curves illustrate the solutions in absence of closures; the dashed curves show the effect of the school closure imposed 15 days after infection.
Figure 5
Figure 5
Effect of bar closures on the system dynamics. The left panel represents the infected compartment, the center panel shows the recovered compartment and the right panel, the fatalities. Each age group is represented in one color: Children (blue), Young adults (pink), Adults (red) and Elderly (black). The solid curves illustrate the solutions in absence of closures; the dashed curves show the effect of the bars closure implemented 25 days after infection.
Figure 6
Figure 6
Effect of shutting down attendance to religious services. The left panel represents the infected compartment, the center panel shows the recovered compartment and the right panel, the fatalities. Each age group is represented in one color: Children (blue), Young adults (pink), Adults (red) and Elderly (black). The solid curves illustrate the solutions in absence of closures; the dashed curves show the effect of the church gathering restrictions implemented 25 days after infection.
Figure 7
Figure 7
Cumulative effect of realistic closing procedures on the system dynamics. The left panel represents the infected compartment, the center panel shows the recovered compartment and the right panel, the fatalities. Each age group is represented in one color: Children (blue), Young adults (pink), Adults (red) and Elderly (black). The solid curves illustrate the solutions in absence of closures; the dashed curves represent the cumulated effects of closing the campus at day 10, the school district at day 15, the bars and churches at day 25 (the approximate timeline of the real life implementations of these closures in New York State).
Figure 8
Figure 8
Effect of exercising social distancing in addition to the existing shutdowns. The left panel represents the infected compartment, the center panel the recovered, and the right panel, the fatalities. Each age group is represented in one color: Children (blue), Young adults (pink), Adults (red) and Elderly (black). The dashed curves illustrate the original predictions; the thin solid curves represent the evolution of the system when the value of the exposure parameters were decreased by 20% of the original values, to reflect the effect of social distancing at all destinations; the thick solid curves represent a deeper, 40% reduction of β values.
Figure 9
Figure 9
Effect of lifting closures and relaxing social distancing after 100 days. From left to right, the panels represent the infected, the recovered and the fatalities compartments. Each age group is represented in one color: Children (blue), Young adults (pink), Adults (red) and Elderly (black). The dashed curves illustrate the prediction with closures and social distancing in place. The thin solid curves illustrate the prediction with both closures and social distance restrictions lifted. The thick solid curves represent a scenario in which closures are lifted, but social distancing is maintained. In the top panels, β is reduced by 20% with social distancing; in the bottom panels, it is reduced by 40%.
Figure 10
Figure 10
Effect of lifting closures and relaxing social distancing after 200 days. From left to right, the panels represent the infected, the recovered and the fatalities compartments. Each age group is represented in one color: Children (blue), Young adults (pink), Adults (red) and Elderly (black). The dashed curves illustrate the prediction with closures and social distancing in place. The thin solid curves illustrate the prediction with both closures and social distance restrictions lifted. The thick solid curves represent a scenario in which closures are lifted, but social distancing is maintained. In the top panels, β is reduced by 20% with social distancing; in the bottom panels, it is reduced by 40%.

References

    1. Lauer SA, Grantz KH, Bi Q, Jones FK, Zheng Q, Meredith HR, Azman AS, Reich NG, Lessler J. The incubation period of coronavirus disease 2019 (covid-19) from publicly reported confirmed cases: estimation and application. Ann. Intern. Med. 2020;172(9):577–582. doi: 10.7326/M20-0504. - DOI - PMC - PubMed
    1. Jang S, Han SH, Rhee J-Y. Cluster of coronavirus disease associated with fitness dance classes, South Korea. Emerg. Infect. Dis. 2020;26(8):1917. doi: 10.3201/eid2608.200633. - DOI - PMC - PubMed
    1. Luo, L. et al. Modes of contact and risk of transmission in covid-19: a prospective cohort study 4950 close contact persons in guangzhou of China. The Lancet. (2020, preprint).
    1. Tong Z-D, Tang A, Li K-F, Li P, Wang H-L, Yi J-P, Zhang Y-L, Yan J-B. Potential presymptomatic transmission of sars-cov-2, Zhejiang Province, China, 2020. Emerg. Infect. Dis. 2020;26(5):1052. doi: 10.3201/eid2605.200198. - DOI - PMC - PubMed
    1. Ping Y, Zhu J, Zhang Z, Han Y. A familial cluster of infection associated with the 2019 novel coronavirus indicating possible person-to-person transmission during the incubation period. J. Infect. Dis. 2020;221(11):1757–1761. doi: 10.1093/infdis/jiaa077. - DOI - PMC - PubMed