. 2020 Dec 4;3(1):735.
doi: 10.1038/s42003-020-01459-2.

The substrate specificity of the human TRAPPII complex's Rab-guanine nucleotide exchange factor activity

Affiliations

The substrate specificity of the human TRAPPII complex's Rab-guanine nucleotide exchange factor activity

Meredith L Jenkins et al. Commun Biol. .

Abstract

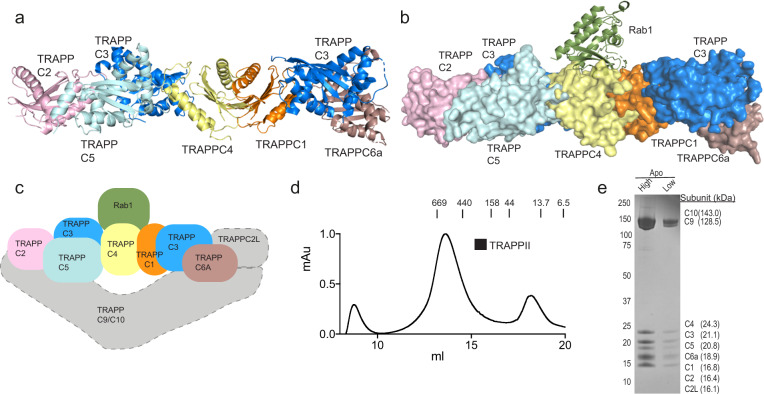
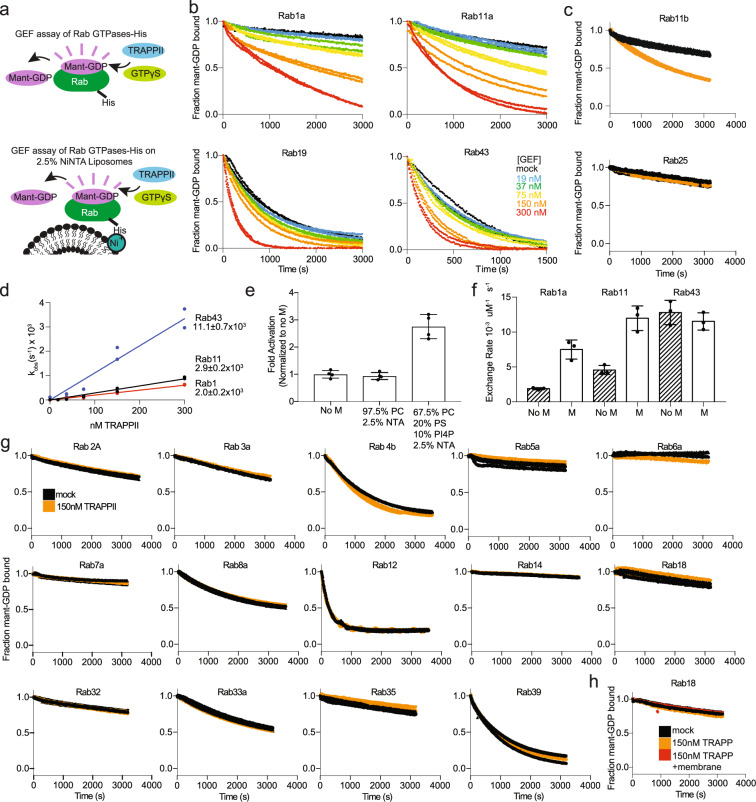
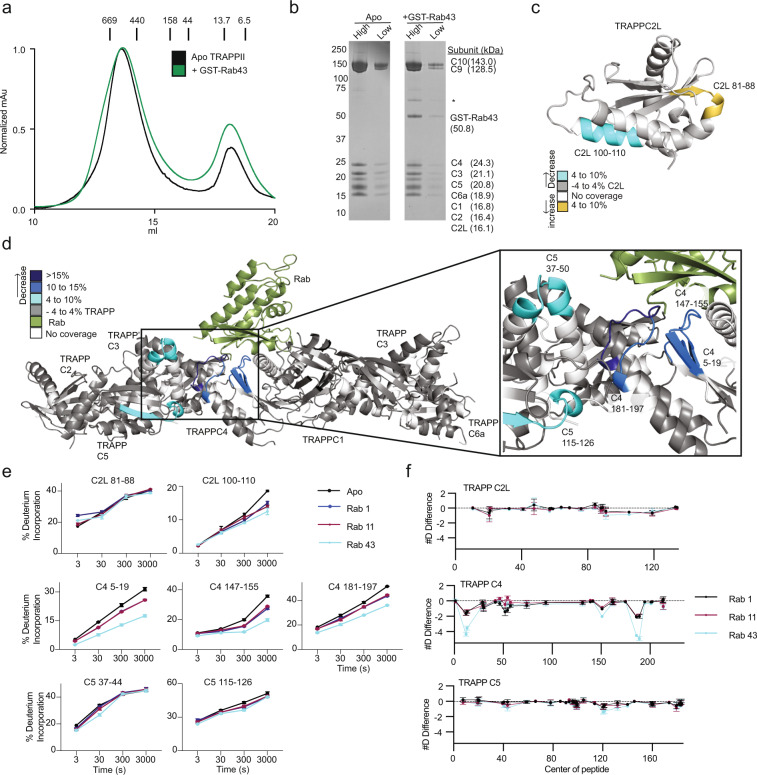
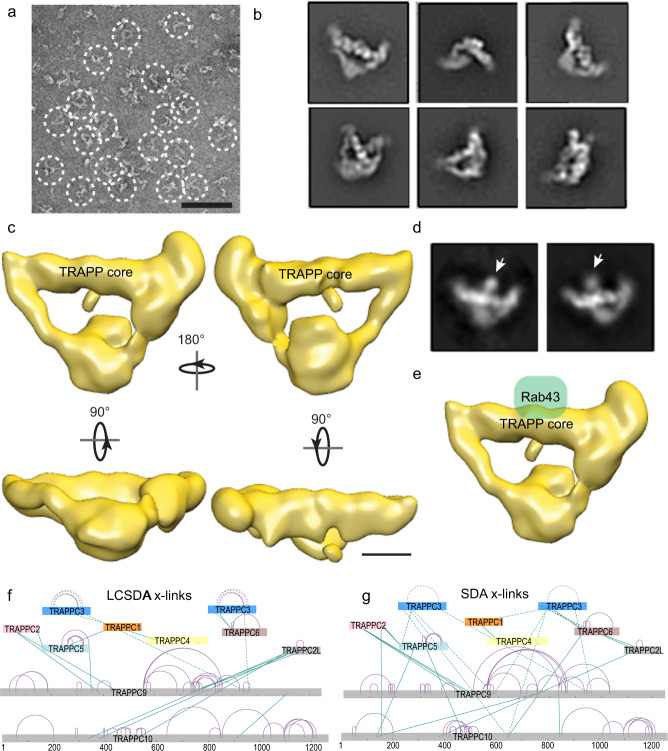
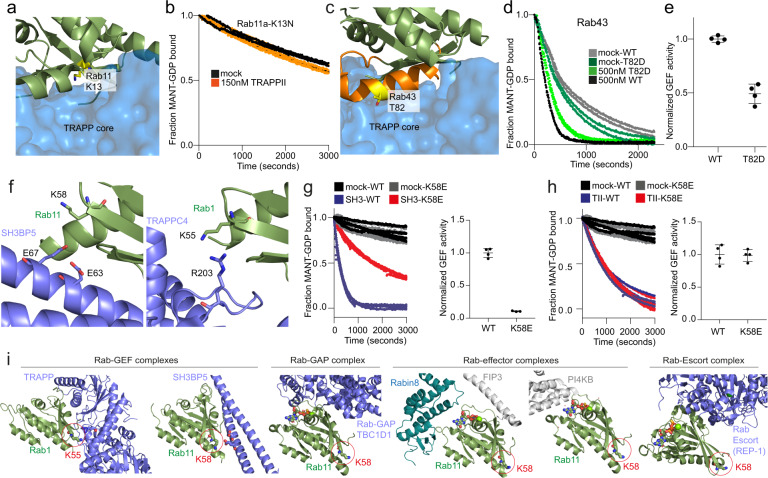
The TRAnsport Protein Particle (TRAPP) complexes act as Guanine nucleotide exchange factors (GEFs) for Rab GTPases, which are master regulators of membrane trafficking in eukaryotic cells. In metazoans, there are two large multi-protein TRAPP complexes: TRAPPII and TRAPPIII, with the TRAPPII complex able to activate both Rab1 and Rab11. Here we present detailed biochemical characterisation of Rab-GEF specificity of the human TRAPPII complex, and molecular insight into Rab binding. GEF assays of the TRAPPII complex against a panel of 20 different Rab GTPases revealed GEF activity on Rab43 and Rab19. Electron microscopy and chemical cross-linking revealed the architecture of mammalian TRAPPII. Hydrogen deuterium exchange MS showed that Rab1, Rab11 and Rab43 share a conserved binding interface. Clinical mutations in Rab11, and phosphomimics of Rab43, showed decreased TRAPPII GEF mediated exchange. Finally, we designed a Rab11 mutation that maintained TRAPPII-mediated GEF activity while decreasing activity of the Rab11-GEF SH3BP5, providing a tool to dissect Rab11 signalling. Overall, our results provide insight into the GTPase specificity of TRAPPII, and how clinical mutations disrupt this regulation.


Conflict of interest statement

The authors declare no competing interests.

Figures

Fig. 1
Fig. 1. Structure models for TRAPP core with and without Rab1 and purification of TRAPPII complex.
a Model of the mammalian TRAPP conserved subunits. The structural model was generated through a combination of the following structures (PDB: 2J3T, 2J3W, and 3CUE),,. Phyre2 was utilized to generate structures of mammalian homologs for TRAPP subunits with no solved crystal structure. The location of TRAPPC2L bound to the conserved subunits is unknown. b Surface representation of a model of the human TRAPP core subunits bound to Rab1(PDB:3CUE). c Cartoon model for the human TRAPPII complex. The core subunits are colored according to the models in (a) and (b). The gray boxes represent TRAPPII specific subunits with an unknown orientation. d Size exclusion chromatography (SEC) trace of TRAPPII on a Superose 6 gel filtration column with molecular weight markers indicated (kDa). The y-axis is normalized to max mAU. e SDS-PAGE gel of purified TRAPPII complex from the gel filtration peak (~13.5 ml) shown in panel (d). High and low labels refer to protein amount loaded (high = 4 μg, low = 0.67 μg).
Fig. 2
Fig. 2. In vitro GEF assays reveal that TRAPPII is a potent GEF for Rab1, Rab11, Rab19, and Rab43.
a Cartoon Schematic of GEF activation assays using fluorescent analog Mant-GDP in the presence and absence of NiNTA-containing lipid vesicles. b In vitro GEF assay of TRAPPII on Rab1a, Rab11a, Rab19, and Rab43. Nucleotide exchange was monitored by measuring the fluorescent signal during the TRAPPII (19–300 nM) catalyzed release of Mant-GDP from 4 µM of Rab-His6 in the presence of 100 µM GTPγS. Each concentration was conducted in duplicate (n = 2). c In vitro GEF assay of TRAPPII on Rab11b and Rab25(Rab11c). Nucleotide exchange was monitored by measuring the fluorescent signal during the TRAPPII (150 nM) catalyzed release of Mant-GDP from 4 µM of Rab-His6 in the presence of 100 µM GTPγS. Error bars represent SD (n = 3). d Nucleotide exchange rates of Rab1, Rab11, and Rab43 plotted as a function of TRAPPII concentration. The kcat/Km values for all Rabs were calculated from the slope (n = 2). e Bar graph representing the difference in Rab11 GEF activity in the presence and absence of two different 400 nm extruded liposomes at 0.2 mg/ml. Nucleotide exchange was monitored by measuring the fluorescent signal during the TRAPPII (150 nM)-catalyzed release of Mant-GDP from 4 µM of Rab11-His6 in the presence of 100 µM GTPγS. Error bars show SD (n = 4). f Bar graph representing the difference in GEF activation of Rab1, Rab11, and Rab43 in the presence and absence of 400 nm extruded liposomes at 0.2 mg/ml (67.5% PC, 20% PS, 10% PI(4)P, 2.5% DGS NTA). Error bars show SD (n = 3). g In vitro GEF assays of TRAPPII against a panel of 14 Rab GTPases loaded with Mant-GDP with 150 nM TRAPPII and 4 µM Rab GTPase (n = 2–3). h In vitro GEF assay of 4 µM Rab18 loaded with Mant-GDP with 150 nM TRAPPII in the presence or absence of 400 nm extruded liposomes at 0.2 mg/ml (67.5% PC, 20% PS, 10% PI(4)P, 2.5% DGS NTA) (n = 3).
Fig. 3
Fig. 3. HDX-MS reveals a conserved Rab-binding interface for TRAPPII.
a Size Exclusion Chromatography (SEC) trace of the TRAPPII and TRAPPII: GST-Rab43 complexes. Apo proteins, and proteins mixed at a 2:1 molar ratio, were subject to SEC on a Superose 6 Increase 10/300 GL column. Size markers are indicated on the trace (kDa). Rab43 and TRAPPII co-eluted together in a single peak, indicating complex formation. b An SDS-PAGE gel of each SEC peak is shown (4–12% NuPAGE gradient gel run at 200 V for 45 min and stained with Coomassie Brilliant Blue dye). High and low labels refer to protein amount loaded (high = 4 μg, low = 0.67 μg). The asterisk denotes a contaminating E.coli protein. c Maximum significant differences in HDX observed across all time points upon Rab43 incubation with TRAPPII are mapped on the predicted structure of TRAPPC2L. Peptides are colored according to the legend. d Maximum significant differences in HDX observed across all time points upon Rab43 incubation with TRAPPII are mapped on the model of the TRAPP core. Peptides are colored according to the legend. e Selected TRAPPII peptides displaying decreases in exchange in the presence of either Rab1, Rab11, or Rab43 are shown. For all panels, error bars show SD (n = 3). f The number of deuteron difference for all analyzed peptides over the entire deuterium exchange time course for Rab1, Rab11, or Rab43 in the presence of TRAPPII. Only subunits with significant differences are shown. Every point represents the central residue of an individual peptide. Changes are mapped according to the legend.
Fig. 4
Fig. 4. Electron microscopy and chemical cross-linking reveal architecture of the TRAPPII complex.
a A representative raw image of negatively stained purified human TRAPPII complex. Triangle-shaped particles but not diamond-shaped particles were observed (circled). Scale bar is 50 nm. b Representative 2D class averages of TRAPPII complex. Box edge length of 45 nm. c 3D reconstruction of TRAPPII with multiple orientations of the complex. Scale bar is 50 Å. d Representative 2D class averages of TRAPPII complex with GST-tagged Rab43. The Rab43 density localizes to the center of the TRAPP core (arrow). Box edge length of 45 nm. e EM density maps of TRAPPII with a modeled position of Rab43. Scale bar is 50 Å. f, g Reduced set of cross-linking mass spectrometry data for the TRAPPII complex using the hetero-bifunctional photo-activatable cross-linkers NHS-Diazirine (SDA), and NHS-LC-Diazirine (LC-SDA). The TRAPP subunits are arranged similar as in the orientation of Fig. 1a. Inter-protein cross-links are shown in green, with intra-protein cross-links shown in purple. Cross-links to the TRAPPC3 subunit are shown as dashed lines to highlight the ambiguity arising from two copies. Complete cross-linking data are shown in the source data. Cross-link map networks are generated with xiNET online cross-link viewer tool.
Fig. 5
Fig. 5. Biochemical analysis of clinical Rab mutants shows specific altered GEF activity.
a Model of Rab11 bound to the TRAPP core, with the K13 residue that is mutated in developmental disorders (K13N). b In vitro GEF assay of TRAPPII WT (150 nM) for the clinically relevant mutation Rab11a K13N (4 μM) (n = 3). c Model of Rab43 bound to the TRAPP core, highlighting the residue T82 which can be phosphorylated by LRRK2. d Normalized GEF activity showing TRAPPII activation of WT Rab43 and Rab43-T82D phosphometic mutant (n = 2). e The rates of GEF exchange for WT Rab43 and phosphomimetic T82D normalized against WT. Error bars show SD (n = 4). f Model of SH3BP5 and the TRAPP core bound to Rab11 and Rab1, respectively (based on PDB models PDB:3CUE, 6DJL),. The modified residue (K58) is labeled on both. g (left) Normalized GEF activity trace showing SH3BP5 (150 nM) activation of Rab11 WT (4 μM) and Rab11-K58E (4 μM) mutant (n = 3). (right) Rates of exchange were calculated and normalized against WT to determine the effect of the K58 mutant activation by SH3BP5. Error bars show SD (n = 4). h (left) Normalized GEF activity showing TRAPPII (150 nM) activation of Rab11 WT (4 μM) and Rab11-K58E (4 μM) mutant (n = 3). (right) Rates of exchange were calculated and normalized against WT to determine the effect of the K58 mutant activation by TRAPPII. Error bars show SD (n = 4). i Analysis of the interface of Rab11 with GEFs, GAPs, escort, and effector proteins compared to the location of the mutated K58 residue. The GEF complexes are from the structures of yeast TRAPP core bound to Rab1 (PDB: 3cue), and SH3BP5 bound to Rab11 (PDB: 6DJL),. The GAP model was generated by aligning Rab11 with the Rab33 portion of the gyp1/Rab33 complex (PDB: 2G77). The structure of the TBC domain of the human TBC1D1 (PDB: 3QYE) was then superimposed on the Gyp1p TBC domain, and the cartoon TBC1D1 TBC domain is illustrated (blue). The effector models are from the structure of Rab11 bound to FIP3 and Rabin8, and Rab11 bound to PI4KB (PDB: 4UJ4, 4D0L),. The escort complex was generated by superimposing the Rab7 component of a REP-1/Rab7 complex (PDB: 1VG0) onto Rab1.

References

    1. Müller MP, Goody RS. Molecular control of Rab activity by GEFs, GAPs and GDI. Small GTPases. 2017;13:1–17. - PMC - PubMed
    1. Novick P. Regulation of membrane traffic by Rab GEF and GAP cascades. Small GTPases. 2016;7:252–256. doi: 10.1080/21541248.2016.1213781. - DOI - PMC - PubMed
    1. Cherfils J, Zeghouf M. Regulation of small GTPases by GEFs, GAPs, and GDIs. Physiol. Rev. 2013;93:269–309. doi: 10.1152/physrev.00003.2012. - DOI - PubMed
    1. Lipatova Z, Segev N. Ypt/Rab GTPases and their TRAPP GEFs at the Golgi. FEBS Lett. 2019;593:2488–2500. doi: 10.1002/1873-3468.13574. - DOI - PMC - PubMed
    1. Sacher M, Shahrzad N, Kamel H, Milev MP. TRAPPopathies: an emerging set of disorders linked to variations in the genes encoding transport protein particle (TRAPP)-associated proteins. Traffic. 2019;20:5–26. doi: 10.1111/tra.12615. - DOI - PubMed

Publication types

Substances

Grants and funding