

Metabolic changes induced by oral glucose tests in horses and their diagnostic use
- PMID: 33277752
- PMCID: PMC7848347
- DOI: 10.1111/jvim.15992
Metabolic changes induced by oral glucose tests in horses and their diagnostic use
Abstract
Background: Little is known about the implications of hyperinsulinemia on energy metabolism, and such knowledge might help understand the pathophysiology of insulin dysregulation.
Objectives: Describe differences in the metabolic response to an oral glucose test, depending on the magnitude of the insulin response.
Animals: Twelve Icelandic horses in various metabolic states.
Methods: Horses were subjected to 3 oral glucose tests (OGT; 0.5 g/kg body weight glucose). Basal, 120 and 180 minutes samples were analyzed using a combined liquid chromatography tandem mass spectrometry and flow injection analysis tandem mass spectrometry metabolomic assay. Insulin concentrations were measured using an ELISA. Analysis was performed using linear models and partial least-squares regression.
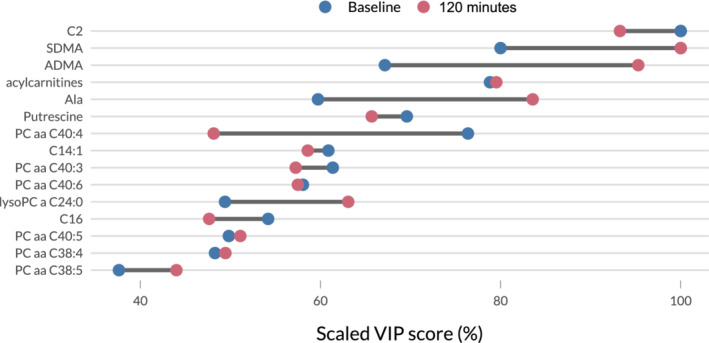
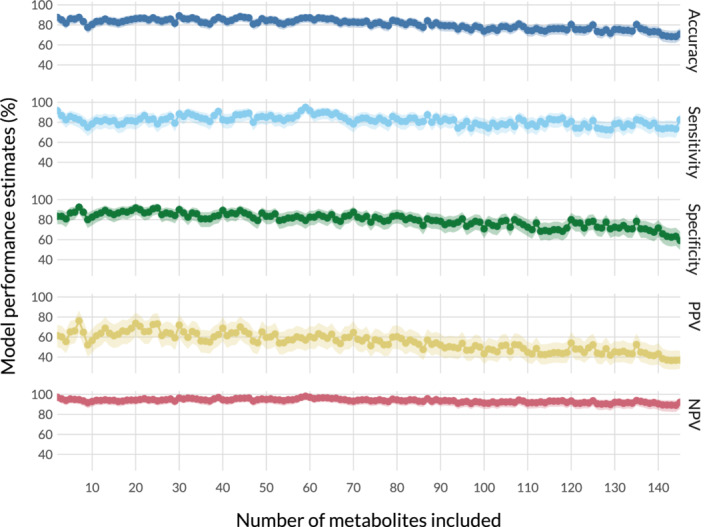
Results: The kynurenine : tryptophan ratio increased over time during the OGT (adjusted P-value = .001). A high insulin response was associated with lower arginine (adjusted P-value = .02) and carnitine (adjusted P-value = .03) concentrations. A predictive model using only baseline samples performed well with as few as 7 distinct metabolites (sensitivity, 86%; 95% confidence interval [CI], 81%-90%; specificity, 88%; 95% CI, 84%-92%).
Conclusions and clinical importance: Our results suggest induction of low-grade inflammation during the OGT. Plasma arginine and carnitine concentrations were lower in horses with high insulin response and could constitute potential therapeutic targets. Development of screening tools to identify insulin-dysregulated horses using only baseline blood sample appears promising.
Keywords: EMS; biomarker; insulin dysregulation; metabolomics; oral glucose test.
© 2020 The Authors. Journal of Veterinary Internal Medicine published by Wiley Periodicals LLC. on behalf of the American College of Veterinary Internal Medicine.
Conflict of interest statement
Authors declare no conflict of interest.
Figures

References
-
- Frank N, Geor RJ, Bailey SR, Durham AE, Johnson PJ, American College of Veterinary Internal Medicine . Equine metabolic syndrome. J Vet Intern Med. 2010;24(3):467‐475. - PubMed
-
- Frank N, Tadros EM. Insulin dysregulation. Equine Vet J. 2014;46(1):103‐112. - PubMed
-
- Asplin KE, Sillence MN, Pollitt CC, McGowan CM. Induction of laminitis by prolonged hyperinsulinaemia in clinically normal ponies. Vet J. 2007;174(3):530‐535. - PubMed
-
- de Laat MA, McGowan CM, Sillence MN, Pollitt CC. Equine laminitis: induced by 48 h hyperinsulinaemia in Standardbred horses. Equine Vet J. 2010;42(2):129‐135. - PubMed
MeSH terms
Substances
LinkOut - more resources
Full Text Sources
Miscellaneous
