

Prognostic value of lipid metabolism-related genes in head and neck squamous cell carcinoma
- PMID: 33277966
- PMCID: PMC7860527
- DOI: 10.1002/iid3.379
Prognostic value of lipid metabolism-related genes in head and neck squamous cell carcinoma
Abstract
Background: Altered lipid metabolism is involved in the development of many tumors. However, the role of dissimilar lipid metabolism in head and neck squamous cell carcinoma (HNSCC) is not fully established.
Aims: Here, we sought to determine the prognostic value of lipid metabolism-related genes in HNSCC.
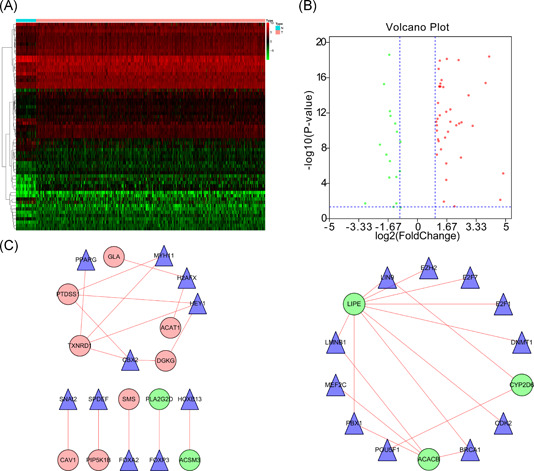
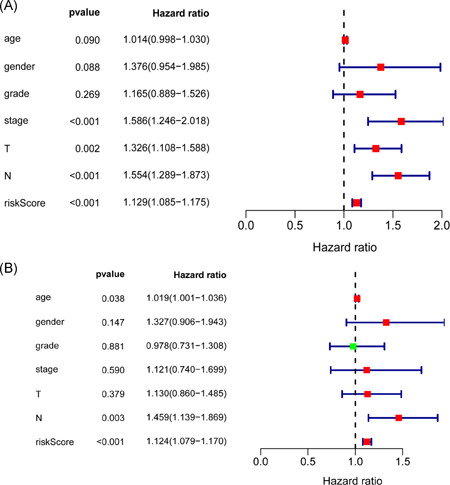
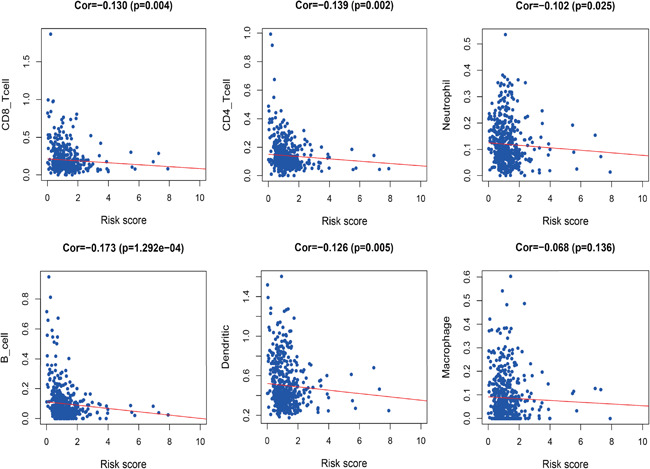
Methods: RNA-seq data and clinical features of 545 HNSCC cases were obtained from The Cancer Genome Atlas database. A regulatory network of transcription factors-lipid metabolism genes and a risk prognostic model of lipid metabolism-related genes was developed using bioinformatics and Cox regression modeling. We used tumor immune estimation resource to analyze immune cell infiltration in patients with HNSCC based on the prognostic index (PI) of lipid metabolism-related genes.
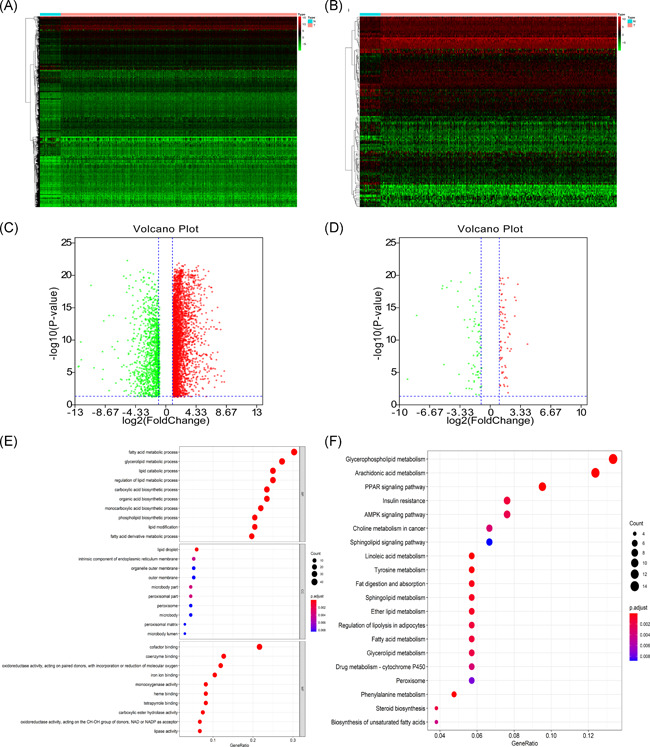
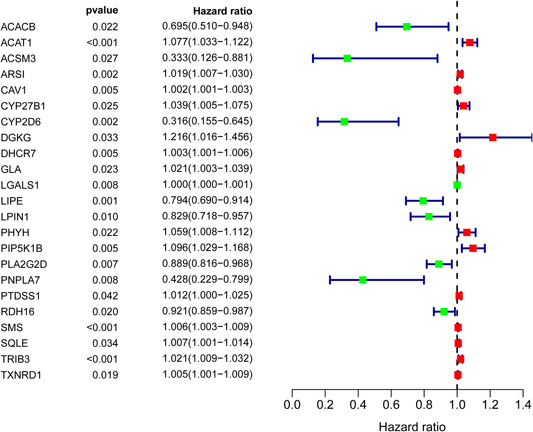
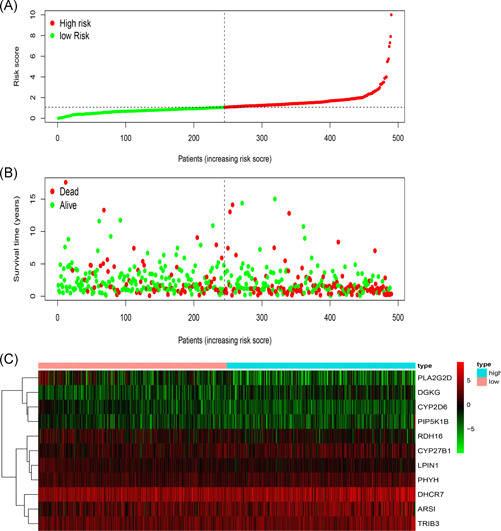
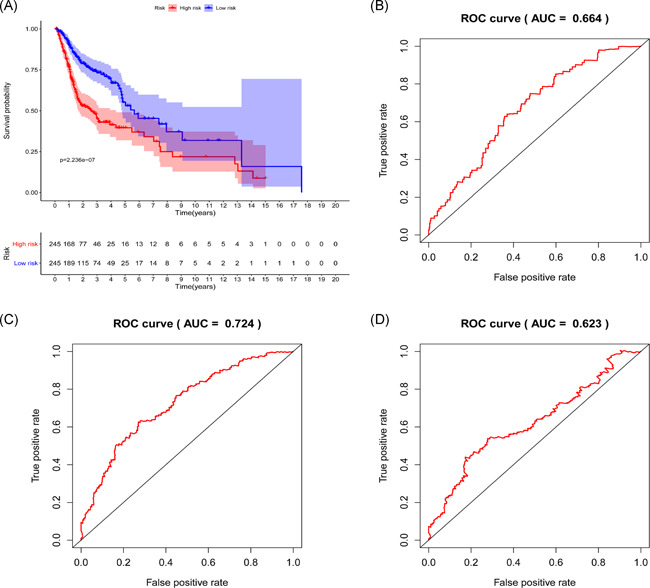
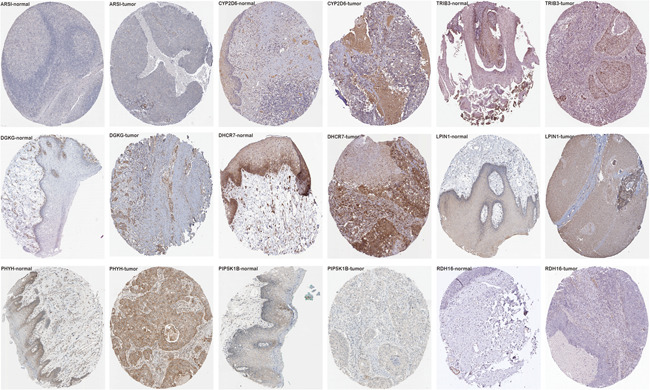
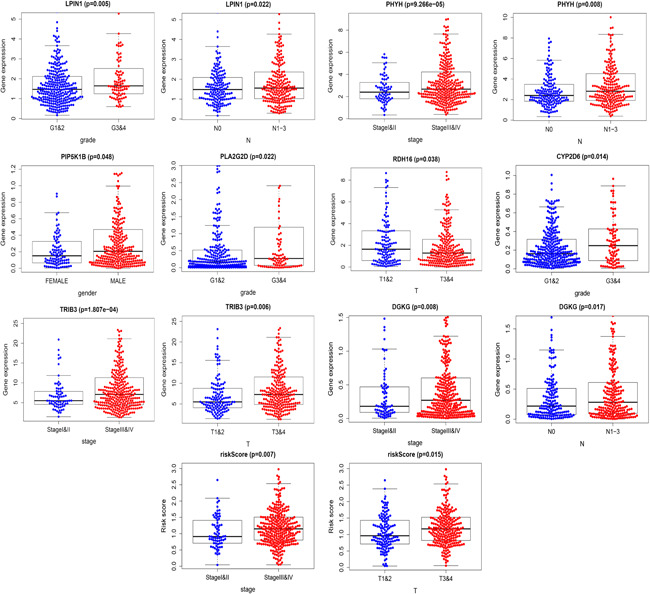
Results: A total of 136 differentially expressed lipid metabolism genes were identified. Of these, 23 are related to prognosis. In addition to predicting HNSCC prognosis, 11 lipid metabolism-related genes (ARSI, CYP27B1, CYP2D6, DGKG, DHCR7, LPIN1, PHYH, PIP5K1B, PLA2G2D, RDH16, and TRIB3) also affect HNSCC clinical features (stage, gender, and pathological stage). The PI of lipid metabolism-related genes embodied the state of HNSCC tumor immune microenvironment.
Keywords: HNSCC; PI; TCGA; lipid metabolism.
© 2020 The Authors. Immunity, Inflammation and Disease published by John Wiley & Sons Ltd.
Conflict of interest statement
All the authors declare that there are no conflicts of interest.
Figures
Similar articles
-
Development and validation of a fourteen- innate immunity-related gene pairs signature for predicting prognosis head and neck squamous cell carcinoma.BMC Cancer. 2020 Oct 20;20(1):1015. doi: 10.1186/s12885-020-07489-7. BMC Cancer. 2020. PMID: 33081731 Free PMC article.
-
Tumor Mutation Burden, Immune Cell Infiltration, and Construction of Immune-Related Genes Prognostic Model in Head and Neck Cancer.Int J Med Sci. 2021 Jan 1;18(1):226-238. doi: 10.7150/ijms.51064. eCollection 2021. Int J Med Sci. 2021. PMID: 33390791 Free PMC article.
-
Prognostic value of novel immune-related genomic biomarkers identified in head and neck squamous cell carcinoma.J Immunother Cancer. 2020 Jul;8(2):e000444. doi: 10.1136/jitc-2019-000444. J Immunother Cancer. 2020. PMID: 32719094 Free PMC article.
-
Systematic review on the current knowledge and use of single-cell RNA sequencing in head and neck cancer.APMIS. 2021 Nov;129(11):619-625. doi: 10.1111/apm.13173. APMIS. 2021. PMID: 34561896
-
Molecular and biological factors in the prognosis of head and neck squamous cell cancer.Mol Biol Rep. 2023 Sep;50(9):7839-7849. doi: 10.1007/s11033-023-08611-1. Epub 2023 Jul 26. Mol Biol Rep. 2023. PMID: 37493876 Review.
Cited by
-
Metabolic Molecule PLA2G2D Is a Potential Prognostic Biomarker Correlating With Immune Cell Infiltration and the Expression of Immune Checkpoint Genes in Cervical Squamous Cell Carcinoma.Front Oncol. 2021 Oct 18;11:755668. doi: 10.3389/fonc.2021.755668. eCollection 2021. Front Oncol. 2021. PMID: 34733790 Free PMC article.
-
Obesity enhances the response to neoadjuvant anti-PD1 therapy in oral tongue squamous cell carcinoma.Cancer Med. 2024 Jun;13(12):e7346. doi: 10.1002/cam4.7346. Cancer Med. 2024. PMID: 38923758 Free PMC article.
-
Platelet proteo-transcriptomic profiling validates mediators of thrombosis and proteostasis in patients with myeloproliferative neoplasms.bioRxiv [Preprint]. 2023 Oct 26:2023.10.23.563619. doi: 10.1101/2023.10.23.563619. bioRxiv. 2023. PMID: 37961700 Free PMC article. Preprint.
-
Liver Regeneration-Related Genes of Nontumor Liver Tissues Predict the Prognosis of Patients with Hepatocellular Carcinoma.J Hepatocell Carcinoma. 2023 Dec 7;10:2197-2209. doi: 10.2147/JHC.S433688. eCollection 2023. J Hepatocell Carcinoma. 2023. PMID: 38090626 Free PMC article.
-
Development of an endoplasmic reticulum stress-related signature with potential implications in prognosis and immunotherapy in head and neck squamous cell carcinoma.Diagn Pathol. 2023 Apr 22;18(1):51. doi: 10.1186/s13000-023-01338-4. Diagn Pathol. 2023. PMID: 37087456 Free PMC article.
References
-
- Snaebjornsson MT, Janaki‐Raman S, Schulze A. Greasing the wheels of the cancer machine: the role of lipid metabolism in cancer. Cell Metab. 2020;31(1):62‐76. - PubMed
Publication types
MeSH terms
Substances
LinkOut - more resources
Full Text Sources
Other Literature Sources
Medical
Research Materials
Miscellaneous
