. 2021 Jan 7;184(1):149-168.e17.
doi: 10.1016/j.cell.2020.11.025. Epub 2020 Nov 19.

Synergism of TNF-α and IFN-γ Triggers Inflammatory Cell Death, Tissue Damage, and Mortality in SARS-CoV-2 Infection and Cytokine Shock Syndromes

Affiliations

Synergism of TNF-α and IFN-γ Triggers Inflammatory Cell Death, Tissue Damage, and Mortality in SARS-CoV-2 Infection and Cytokine Shock Syndromes

Rajendra Karki et al. Cell. .

Abstract

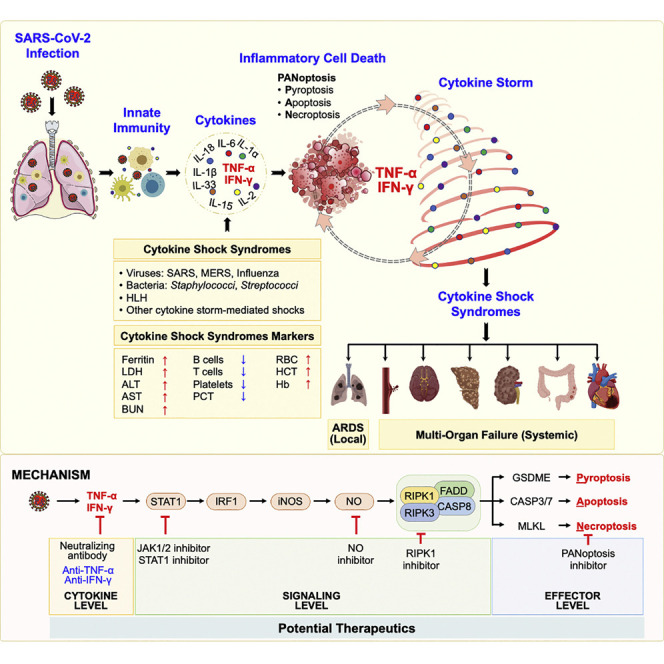
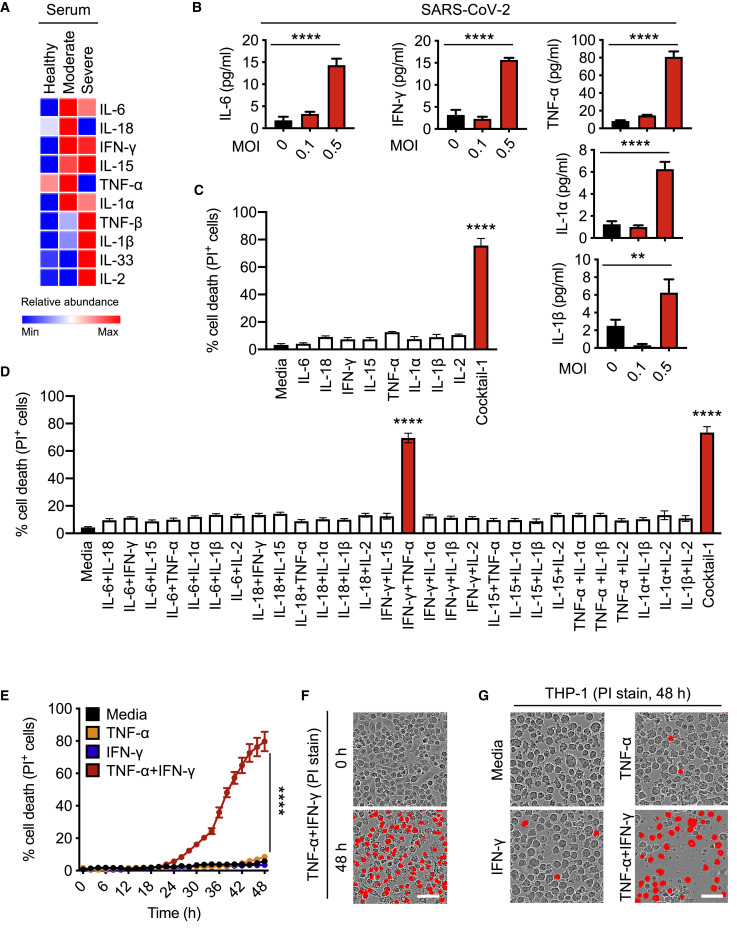
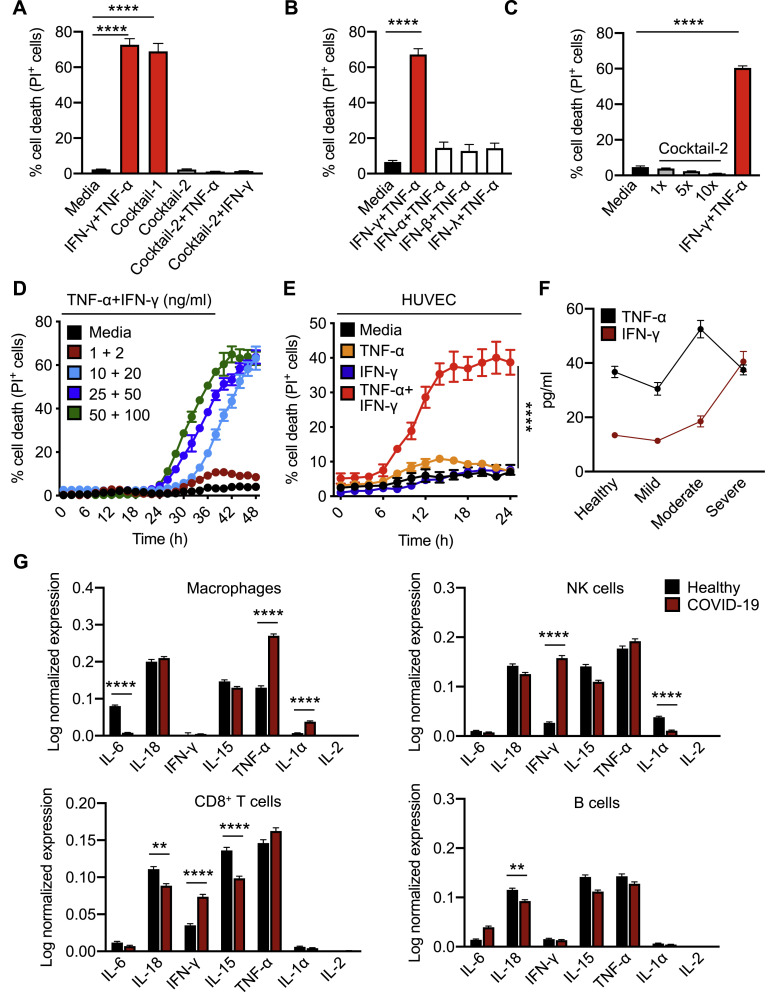
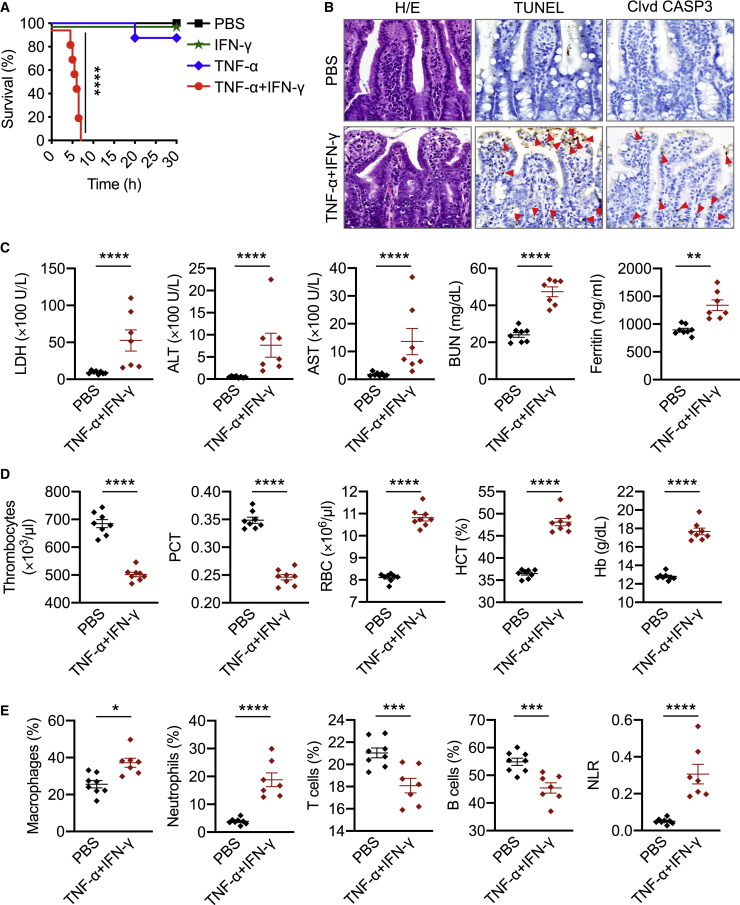
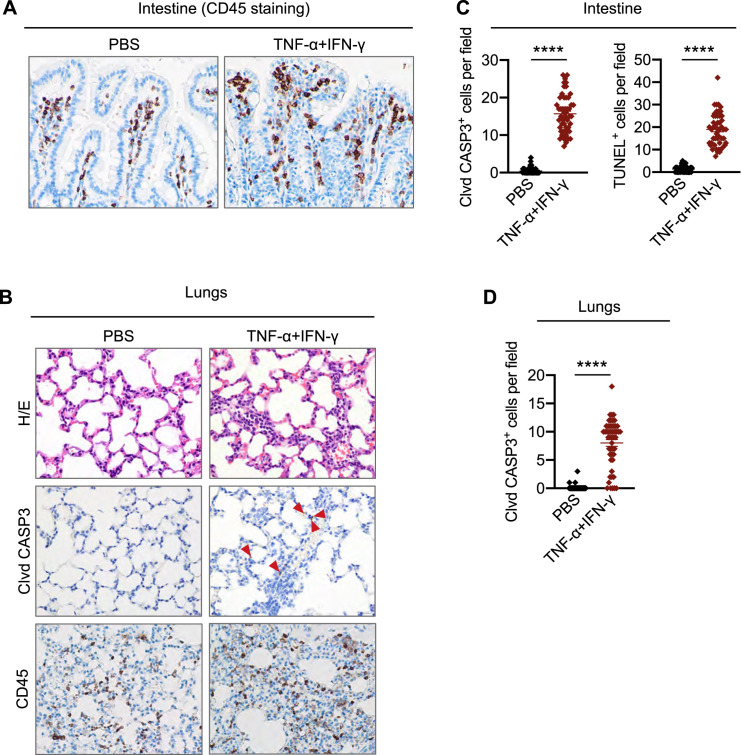
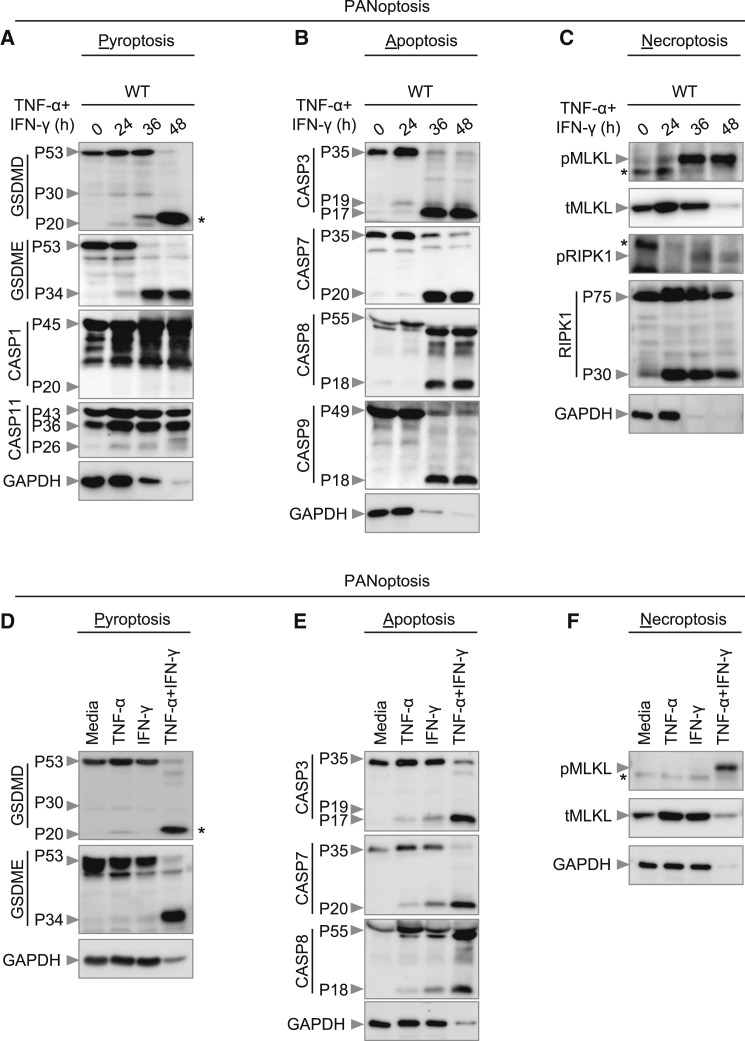
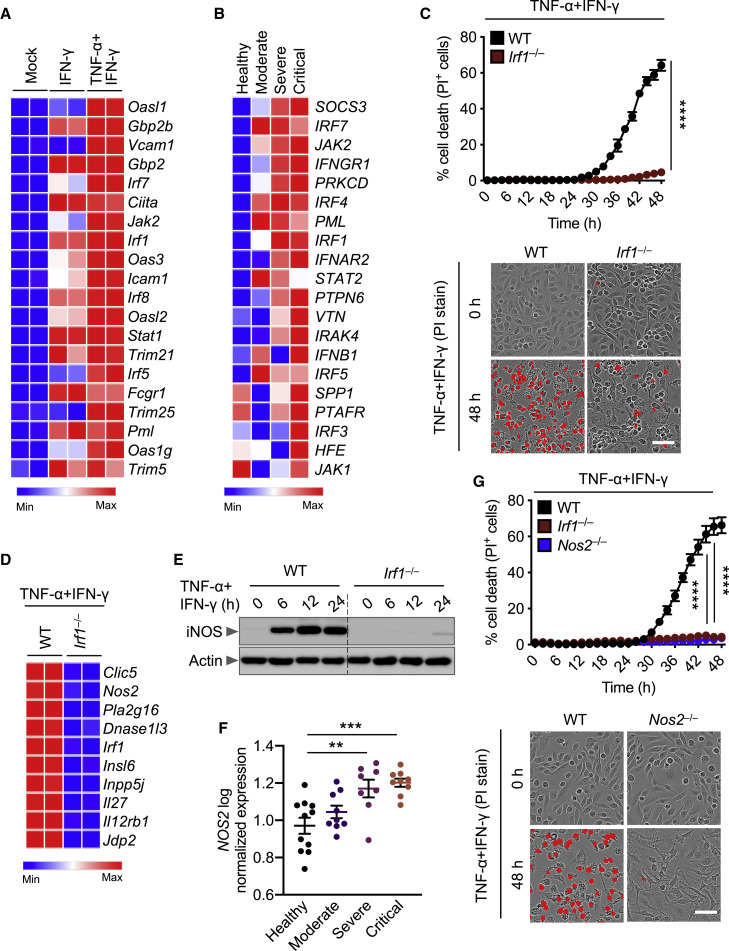
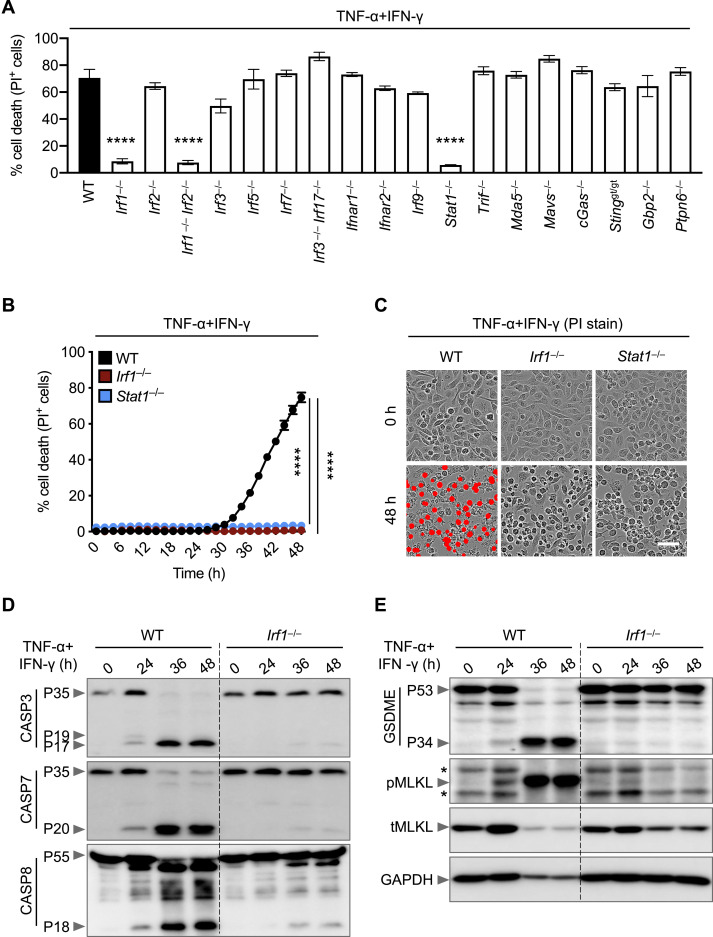
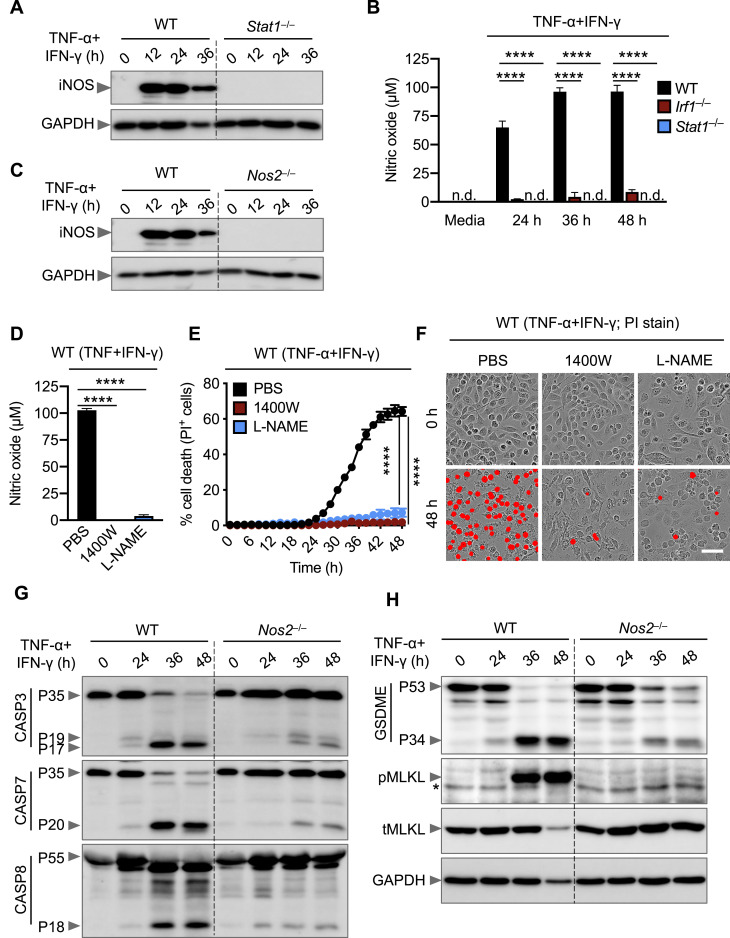
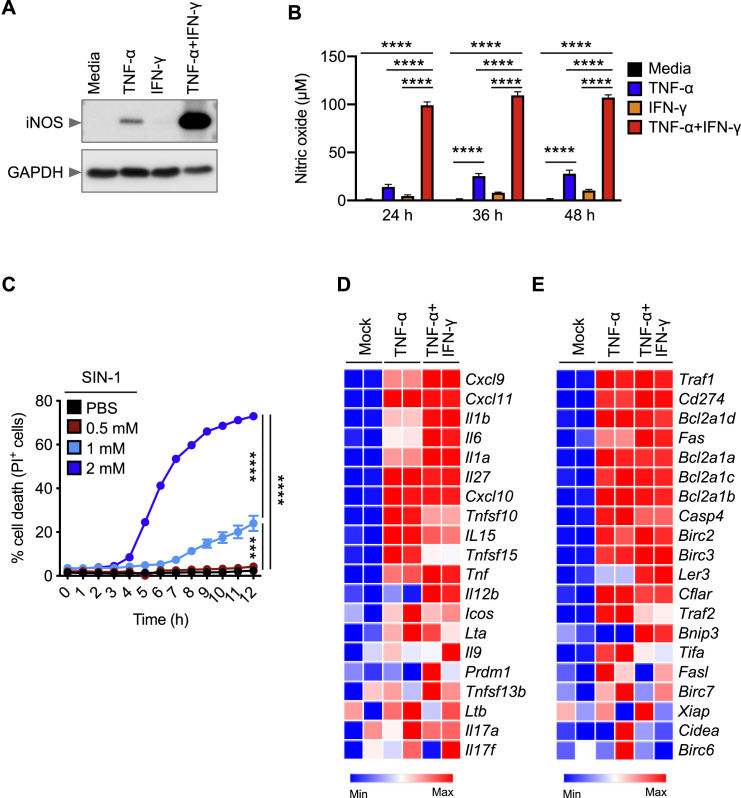
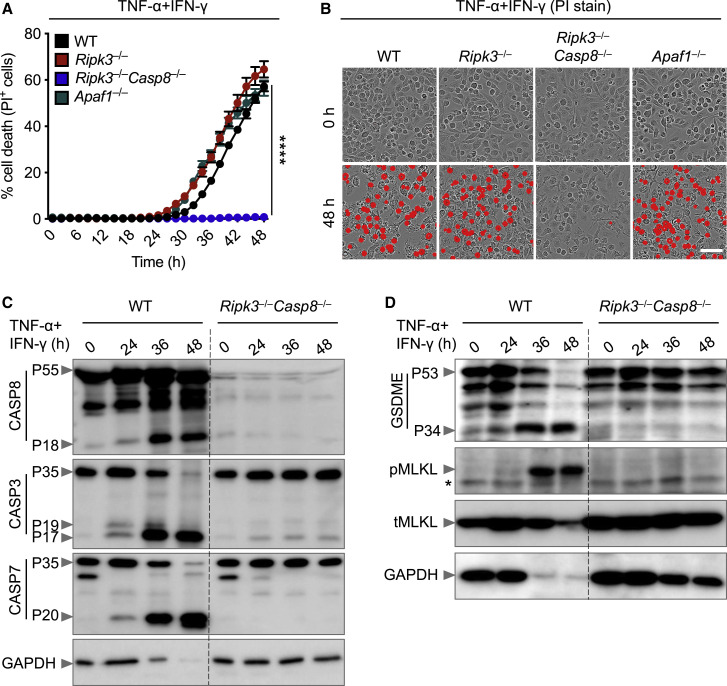
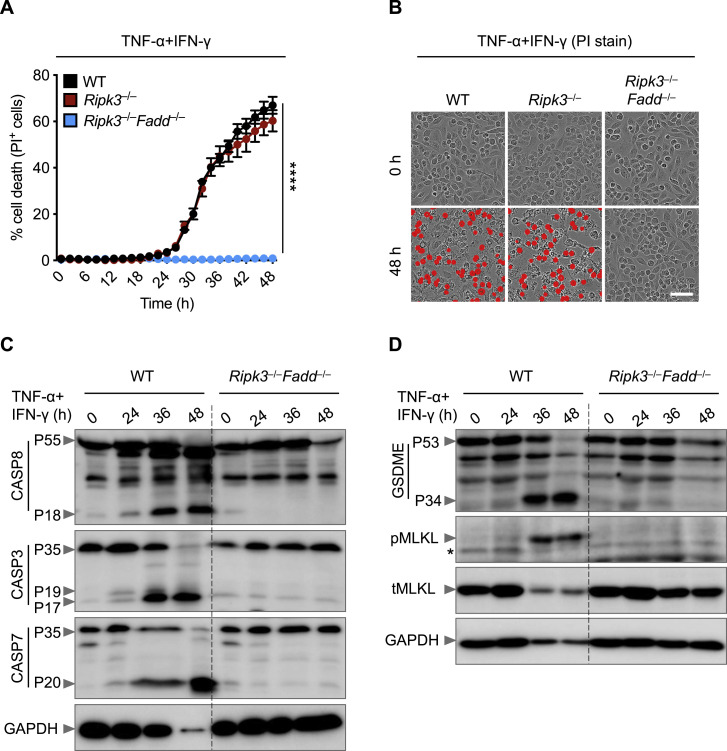
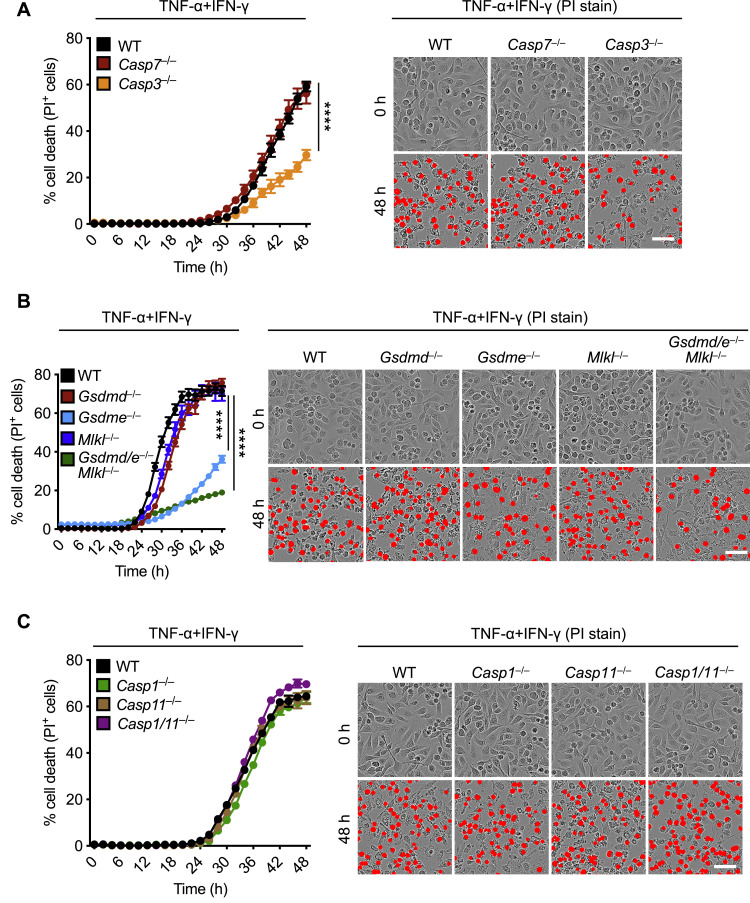
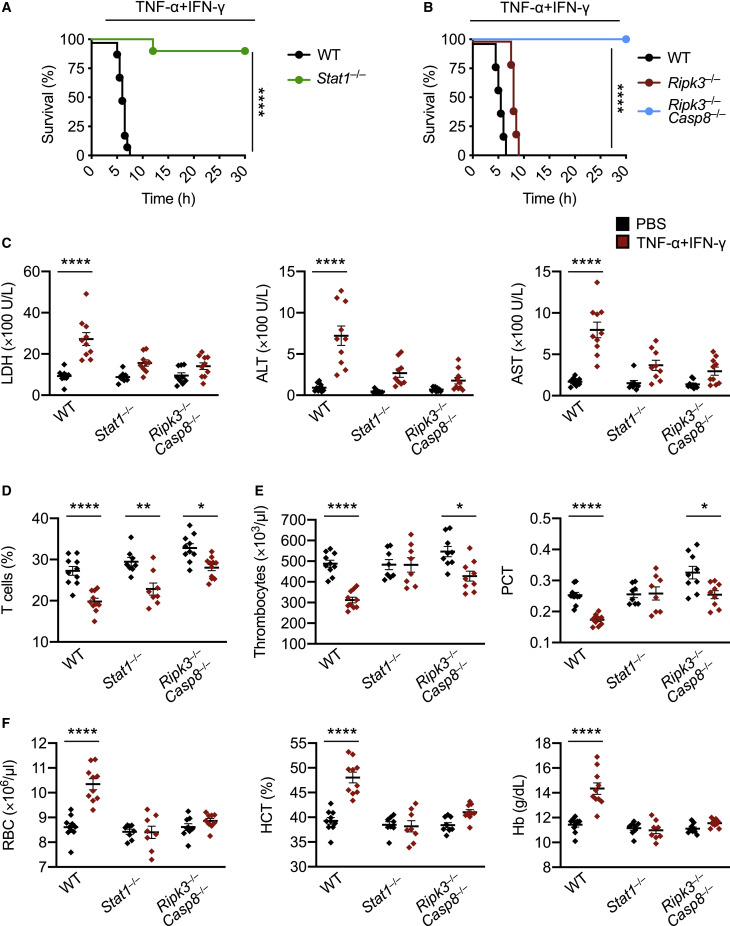
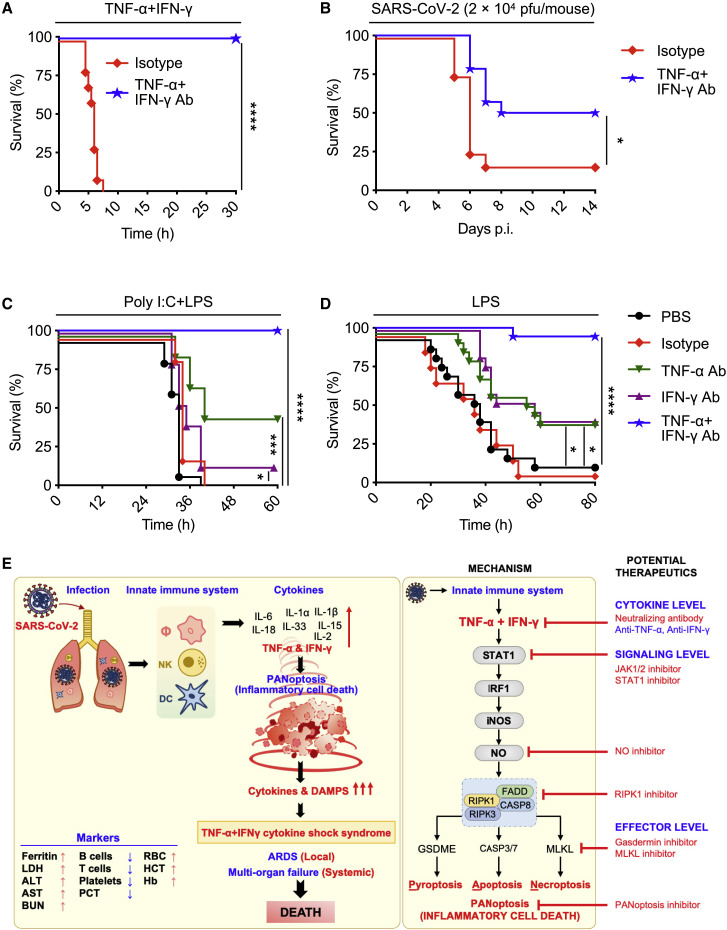
COVID-19 is characterized by excessive production of pro-inflammatory cytokines and acute lung damage associated with patient mortality. While multiple inflammatory cytokines are produced by innate immune cells during SARS-CoV-2 infection, we found that only the combination of TNF-α and IFN-γ induced inflammatory cell death characterized by inflammatory cell death, PANoptosis. Mechanistically, TNF-α and IFN-γ co-treatment activated the JAK/STAT1/IRF1 axis, inducing nitric oxide production and driving caspase-8/FADD-mediated PANoptosis. TNF-α and IFN-γ caused a lethal cytokine shock in mice that mirrors the tissue damage and inflammation of COVID-19, and inhibiting PANoptosis protected mice from this pathology and death. Furthermore, treating with neutralizing antibodies against TNF-α and IFN-γ protected mice from mortality during SARS-CoV-2 infection, sepsis, hemophagocytic lymphohistiocytosis, and cytokine shock. Collectively, our findings suggest that blocking the cytokine-mediated inflammatory cell death signaling pathway identified here may benefit patients with COVID-19 or other infectious and autoinflammatory diseases by limiting tissue damage/inflammation.

Keywords: COVID-19; IFN-γ; PANoptosis; SARS-CoV-2; TNF-α; apoptosis; cytokine storm; inflammation; necroptosis; pyroptosis.


Conflict of interest statement

Declaration of Interests St. Jude Children’s Research hospital filed a provisional patent application on TNF-α and IFN-γ signaling described in this study, listing R.K. and T.-D.K. as inventors (serial no. 63/106,012).

Figures

None
Graphical abstract
Figure 1
Figure 1
Pro-inflammatory Cytokines Are Increased in COVID-19, and Co-treatment of TNF-α and IFN-γ Induces Cell Death (A) Heatmap depicting the levels of pro-inflammatory cytokines in serum of patients with COVID-19 and healthy people (Lucas et al., 2020). (B) Pro-inflammatory cytokines released from PBMCs infected with SARS-CoV-2. (C) Percent of BMDMs that are dead 48 h after cytokine treatment using the IncuCyte imaging system and propidium iodide (PI) staining. “Cocktail-1” contained all 8 cytokines (IL-6, IL-18, IFN-γ, IL-15, TNF-α, IL-1α, IL-1β, and IL-2). (D) Percent of BMDMs that are dead 48 h after treatment with the indicated combination of cytokines. (E) Real-time analysis of cell death in BMDMs treated with the indicated cytokines. (F and G) Representative images of cell death in BMDMs (F) and THP-1 cells (G) after 48 h of the indicated treatments. Scale bar, 50 μm. Data are representative of at least three independent experiments. ∗∗p < 0.01; ∗∗∗∗p < 0.0001. Analysis was performed using the one-way ANOVA (B–D) or the two-way ANOVA (E). Significance asterisks in (C) and (D) indicate the comparison to the media-treated control. Data are shown as mean ± SEM (B–E). See also Figure S1.
Figure S1
Figure S1
Co-treatment of TNF-α and IFN-γ Induces Cell Death, Related to Figure 1 (A) Percent of bone marrow-derived macrophages (BMDMs) that are dead 48 h after cytokine treatment using the IncuCyte imaging system and propidium iodide (PI) staining. BMDMs were stimulated with the indicated cytokines, “Cocktail-1” (IL-6, IL-18, IFN-γ, IL-15, TNF-α, IL-1α, IL-1β, and IL-2), “Cocktail-2” (IL-6, IL-18, IL-15, IL-1α, IL-1β, and IL-2), Cocktail-2+TNF-α, or Cocktail-2+IFN-γ. (B) Percent of BMDMs that are dead 48 h after treatment with the indicated cytokines using the IncuCyte imaging system and PI staining. (C) Percent of BMDMs that are dead 48 h after treatment with increasing concentration of cytokines in Cocktail-2 or TNF-α and IFN-γ using the IncuCyte imaging system and PI staining. (D) Real-time analysis of cell death in BMDMs using the IncuCyte imaging system and PI staining after treatment with increasing concentrations of TNF-α and IFN-γ. (E) Real-time analysis of cell death in primary human umbilical vein endothelial cells (HUVEC) treated with the indicated cytokines using the IncuCyte imaging system and PI staining. (F) Circulating amounts of TNF-α and IFN-γ in healthy volunteers and patients with mild, moderate, or severe COVID-19 (Silvin et al., 2020). (G) Expression of pro-inflammatory cytokines in macrophages, NK cells, CD8+ T cells, and B cells based on publicly available single-cell RNA-seq data using peripheral blood mononuclear cells obtained from healthy donors and patients with mild and severe COVID-19 (Lee et al., 2020b). Data are representative of at least three independent experiments. ∗∗p < 0.01; ∗∗∗∗p < 0.0001. Analysis was performed using the one-way ANOVA (A–C) or the two-way ANOVA (E and G). Data are shown as mean ± SEM.
Figure 2
Figure 2
Cytokine Shock by TNF-α and IFN-γ Mirrors COVID-19 Symptoms (A) Survival of 6- to 8-week-old WT mice after intraperitoneal (i.p.) injection of PBS (n = 10), IFN-γ (n = 12), TNF-α (n = 15), or TNF-α+IFN-γ (n = 15). (B) H/E staining, TUNEL, and cleaved caspase-3 (Clvd CASP3) immuno-staining of colon samples from mice injected with PBS or TNF-α+IFN-γ after 5 h. Red arrows indicate stained cells. (C–E) Analysis of (C) serum levels of LDH, ALT, AST, blood urea nitrogen (BUN), and ferritin; (D) the number of thrombocytes, plateletcrit (PCT), RBC count, hematocrit (HCT), and hemoglobin (Hb) concentration in the blood; and (E) the percentage of macrophages, neutrophils, T cells, and B cells and the neutrophil-to-lymphocyte ratio (NLR) in the blood of mice injected with PBS or TNF-α and IFN-γ after 5 h. Data are representative of at least three independent experiments. p < 0.05; ∗∗p < 0.01; ∗∗∗p < 0.001; ∗∗∗∗p < 0.0001. Analysis was performed using the survival curve comparison (log-Rank [Mantel-Cox] test) (A) or the t test (C–E). Data are shown as mean ± SEM (C–E). See also Figure S2.
Figure S2
Figure S2
TNF-α and IFN-γ Shock Induces Inflammatory Responses and Intestinal and Lung Damage, Related to Figure 2 (Α) CD45 immuno-staining in the intestine collected from mice injected intraperitoneally with PBS or TNF-α and IFN-γ at 5 h post-treatment. (B) Hematoxylin and eosin staining (H/E), cleaved caspase-3 (Clvd CASP3), and CD45 immuno-staining in the lungs collected from mice injected intraperitoneally with PBS or TNF-α and IFN-γ at 5 h post-treatment. Red arrows indicate stained cells for Clvd CASP3. (C) Quantitative analysis of Clvd CASP3-positive and TUNEL-positive cells in the intestine collected from mice injected intraperitoneally with PBS or TNF-α and IFN-γ at 5 h post-treatment. Fifty fields were analyzed under the microscope. (D) Quantitative analysis of Clvd CASP3-positive cells in the lungs collected from mice injected intraperitoneally with PBS or TNF-α and IFN-γ at 5 h post-treatment. Fifty fields were analyzed under the microscope. Data are representative of at least three independent experiments. Data are shown as mean ± SEM (C and D). ∗∗∗∗p < 0.0001. Analysis was performed using the t test (C and D).
Figure 3
Figure 3
Co-treatment of TNF-α and IFN-γ Induces PANoptosis (A–C) Immunoblot analysis of (A) pro- (P53), activated (P30), and inactivated (P20) GSDMD, pro- (P53) and activated (P34) GSDME, pro- (P45) and activated (P20) CASP1, and pro- (P43) and cleaved (P36 and P26) CASP11; (B) pro- (P35) and cleaved (P19 and P17) CASP3, pro- (P35) and cleaved (P20) CASP7, pro- (P55) and cleaved (P18) CASP8, and pro- (P49) and cleaved (P18) CASP9; and (C) phosphorylated MLKL (pMLKL), total MLKL (tMLKL), phosphorylated RIPK1 (pRIPK1), and pro- (P75) and cleaved (P30) RIPK1 in BMDMs co-treated with TNF-α and IFN-γ. (D–F) Immunoblot analysis of (D) GSDMD and GSDME; (E) CASP3, CASP7, and CASP8; and (F) pMLKL and tMLKL in BMDMs after treatment with TNF-α alone, IFN-γ alone, or co-treatment with TNF-α and IFN-γ for 36 h. GAPDH was used as the internal control. Asterisks denote a nonspecific band. Data are representative of at least three independent experiments.
Figure 4
Figure 4
IRF1 and NOS2 Mediate TNF-α and IFN-γ-Induced Inflammatory Cell Death (A) Heatmap depicting the expression levels of type II IFN-responsive genes in WT BMDMs treated with IFN-γ alone or co-treated with TNF-α and IFN-γ for 16 h relative to their expression in untreated (Mock) BMDMs. (B) Heatmap depicting the expression levels of type II IFN-responsive genes in patients with moderate, severe, and critical COVID-19 relative to their expression in healthy patients (Hadjadj et al., 2020). (C) Real-time analysis of cell death in TNF-α and IFN-γ co-treated WT and Irf1–/– BMDMs. Representative images of cell death are shown at 0 h and after 48 h of TNF-α and IFN-γ treatment. (D) Heatmap depicting the expression levels of the most downregulated genes in Irf1–/– BMDMs co-treated with TNF-α and IFN-γ for 16 h relative to their expression in WT treated BMDMs. (E) Immunoblot analysis of iNOS in WT and Irf1–/– BMDMs co-treated with TNF-α and IFN-γ. Actin was used as the internal control. (F) Expression analysis of NOS2 in patients with moderate, severe, and critical COVID-19 relative to the expression in healthy patients (Hadjadj et al., 2020). (G) Real-time analysis of cell death in WT, Irf1–/–, and Nos2–/– BMDMs during co-treatment with TNF-α and IFN-γ. Representative images of cell death are shown at 0 h and after 48 h of TNF-α and IFN-γ treatment. Scale bar, 50 μm. Data are representative of at least three independent experiments. ∗∗p < 0.01; ∗∗∗p < 0.001; ∗∗∗∗p < 0.0001. Analysis was performed using the one-way ANOVA (F) or two-way ANOVA (C and G). Data are shown as mean ± SEM (C, F, and G). See also Figures S3, S4, and S5.
Figure S3
Figure S3
IRF1 and STAT1 Are Required for Cell Death Downstream of TNF-α and IFN-γ Co-treatment, Related to Figure 4 (A) Percent of bone marrow-derived macrophages (BMDMs) that are dead 48 h after TNF-α and IFN-γ co-treatment using the IncuCyte imaging system and propidium iodide (PI) staining. (B) Real-time analysis of cell death in wild type (WT), Irf1–/–, and Stat1–/– BMDMs using the IncuCyte imaging system and PI staining after treatment with TNF-α and IFN-γ. (C) Representative images of cell death in WT, Irf1–/–, and Stat1–/– BMDMs are shown at 0 h and after 48 h of TNF-α and IFN-γ treatment. Scale bar, 50 μm. (D and E) Immunoblot analysis of (D) pro- (P35) and cleaved caspase-3 (P19 and P17; CASP3), pro- (P35) and cleaved caspase-7 (P20; CASP7), and pro- (P55) and cleaved caspase-8 (P18; CASP8) and (E) pro- (P53) and activated (P34) gasdermin E (GSDME), phosphorylated MLKL (pMLKL), and total MLKL (tMLKL) in WT and Irf1–/– BMDMs co-treated with TNF-α and IFN-γ for the indicated time. GAPDH was used as the internal control. Asterisks denote a nonspecific band. Data are representative of at least three independent experiments. ∗∗∗∗p < 0.0001. Analysis was performed using the one-way ANOVA (A) or two-way ANOVA (B). Data are shown as mean ± SEM (A and B).
Figure S4
Figure S4
Nitric Oxide Produced Downstream of IRF1 and STAT1 Is Required for Cell Death Triggered by TNF-α and IFN-γ Co-treatment, Related to Figure 4 (A) Immunoblot analysis of iNOS in wild type (WT) and Stat1–/– bone marrow-derived macrophages (BMDMs) co-treated with TNF-α and IFN-γ for the indicated time. GAPDH was used as the internal control. (Β) Nitric oxide production in WT, Irf1–/–, and Stat1–/– BMDMs co-treated with TNF-α and IFN-γ for the indicated time. (C) Immunoblot analysis of iNOS in WT and Nos2–/– BMDMs co-treated with TNF-α and IFN-γ for the indicated time. GAPDH was used as the internal control. (D) Production of nitric oxide by WT BMDMs treated with nitric oxide inhibitors, 1400W (100 μΜ) or L-NAME (1 mM), together with TNF-α and IFN-γ for 36 h. (E) Real-time analysis of cell death in PBS-, 1400W-, or L-NAME–treated WT BMDMs using the IncuCyte imaging system and propidium iodide (PI) staining after stimulation with TNF-α and IFN-γ. (F) Representative images of cell death in PBS-, 1400W-, or L-NAME–treated WT BMDMs are shown at 0 h and after 48 h of TNF-α and IFN-γ treatment. Scale bar, 50 μm. (G and H) Immunoblot analysis of (G) pro- (P35) and cleaved caspase-3 (P19 and P17; CASP3), pro- (P35) and cleaved caspase-7 (P20; CASP7), and pro- (P55) and cleaved caspase-8 (P18; CASP8) and (H) pro- (P53) and activated (P34) gasdermin E (GSDME), phosphorylated MLKL (pMLKL), and total MLKL (tMLKL) in WT and Nos2–/– BMDMs co-treated with TNF-α and IFN-γ for the indicated time. GAPDH was used as the internal control. Asterisk denotes a nonspecific band. Data are representative of at least three independent experiments. ∗∗∗∗p < 0.0001. Analysis was performed using the one-way ANOVA (D) or two-way ANOVA (B and E). Data are shown as mean ± SEM (B, D, and E). n.d., not detected.
Figure S5
Figure S5
Concentration of Nitric Oxide Is Critical to Induce Cell Death, and IFN-γ Does Not Suppress TNF-α-Mediated NF-κB Signaling, Related to Figure 4 (A) Immunoblot analysis of iNOS in wild type (WT) bone marrow-derived macrophages (BMDMs) treated with TNF-α alone, IFN-γ alone, or TNF-α and IFN-γ together for 24 h. GAPDH was used as the internal control. (Β) Nitric oxide production in WT BMDMs treated with TNF-α alone, IFN-γ alone, or TNF-α and IFN-γ together for the indicated time. (C) Real-time analysis of cell death in PBS- and nitric oxide donor SIN-1–treated WT BMDMs using the IncuCyte imaging system and propidium iodide (PI) staining. (D and E) Heatmap depicting the expression levels of NF-κB target genes for (D) inflammatory cytokines/chemokines and (E) apoptosis regulators in WT BMDMs treated with TNF-α alone or co-treated with TNF-α and IFN-γ for 16 h relative to their expression in untreated (Mock) BMDMs. Data are representative of at least three independent experiments. ∗∗∗p < 0.001; ∗∗∗∗p < 0.0001. Analysis was performed using the two-way ANOVA (B and C).
Figure 5
Figure 5
Caspase-8 Drives PANoptosis Induced by Co-treatment with TNF-α and IFN-γ (A) Real-time analysis of cell death in WT, Ripk3–/–, Ripk3–/–Casp8–/–, and Apaf1–/– BMDMs co-treated with TNF-α and IFN-γ. (B) Representative images of cell death in WT, Ripk3–/–, Ripk3–/–Casp8–/–, and Apaf1–/– BMDMs. Scale bar, 50 μm. (C and D) Immunoblot analysis of (C) pro- (P55) and cleaved (P18) CASP8, pro- (P35) and cleaved (P19 and P17) CASP3, and pro- (P35) and cleaved (P20) CASP7 and (D) pro- (P53) and activated (P34) GSDME, phosphorylated MLKL (pMLKL), and total MLKL (tMLKL) in WT and Ripk3–/–Casp8–/– BMDMs co-treated with TNF-α and IFN-γ. GAPDH was used as the internal control. Asterisks denote a nonspecific band. Data are representative of at least three independent experiments. ∗∗∗∗p < 0.0001. Analysis was performed using the two-way ANOVA. Data are shown as mean ± SEM (A). See also Figures S6 and S7.
Figure S6
Figure S6
FADD Regulates Cell Death Induced by TNF-α and IFN-γ Co-treatment, Related to Figure 5 (A) Real-time analysis of cell death in wild type (WT), Ripk3–/–, and Ripk3–/–Fadd–/– bone marrow-derived macrophages (BMDMs) using the IncuCyte imaging system and propidium iodide (PI) staining after co-treatment with TNF-α and IFN-γ. (B) Representative images of cell death in WT, Ripk3–/–, and Ripk3–/–Fadd–/– BMDMs are shown at 0 h and after 48 h of TNF-α and IFN-γ treatment. Scale bar, 50 μm. (C) Immunoblot analysis of pro- (P55) and cleaved caspase-8 (P18; CASP8), pro- (P35) and cleaved caspase-3 (P19 and P17; CASP3), and pro- (P35) and cleaved caspase-7 (P20; CASP7) in WT and Ripk3–/–Fadd–/– BMDMs co-treated with TNF-α and IFN-γ for the indicated time. GAPDH was used as the internal control. (D) Immunoblot analysis of pro- (P53) and activated (P34) gasdermin E (GSDME), phosphorylated MLKL (pMLKL), and total MLKL (tMLKL) in WT and Ripk3–/–Fadd–/– BMDMs co-treated with TNF-α and IFN-γ for the indicated time. GAPDH was used as the internal control. Asterisk denotes a nonspecific band. Data are representative of at least three independent experiments. ∗∗∗∗p < 0.0001. Analysis was performed using the two-way ANOVA (A). Data are shown as mean ± SEM (A).
Figure S7
Figure S7
Deletion of Individual Cell Death Pathways Is Not Sufficient to Protect Cells from Death Induced by TNF-α and IFN-γ, Related to Figure 5 (A–C) Real-time analysis of cell death in wild type (WT), Casp7–/–, and Casp3–/– bone marrow-derived macrophages (BMDMs) (A); WT, Gsdmd–/–, Gsdme–/–, Mlkl–/–, and Gsdmd–/–Gsdme–/–(Gsdmd/e–/–)Mlkl–/– BMDMs (B); or WT, Casp1–/–, Casp11–/–, and Casp1/11–/– BMDMs (C) using the IncuCyte imaging system and propidium iodide (PI) staining after co-treatment with TNF-α and IFN-γ. Representative images of cell death are shown at 0 h and after 48 h of TNF-α and IFN-γ treatment. Scale bar, 50 μm. ∗∗∗∗p < 0.0001. Analysis was performed using the two-way ANOVA. Data are representative of at least three independent experiments. Data are shown as mean ± SEM.
Figure 6
Figure 6
Inhibition of PANoptosis Provides Protection against TNF-α and IFN-γ-Driven Lethality in Mice (A and B) Survival of 6- to 8-week-old (A) WT (n = 10) and Stat1–/– (n = 10) mice and (B) WT (n = 10), Ripk3–/– (n = 12), and Ripk3–/–Casp8–/– (n = 15) mice after i.p. injection of TNF-α and IFN-γ. (C–E) Analysis of (C) serum levels of LDH, ALT, and AST; (D) percentage of T cells in blood; (E) the number of thrombocytes and plateletcrit (PCT) in the blood; and (F) RBC count, hematocrit (HCT), and hemoglobin (Hb) concentration in the blood of WT, Stat1–/–, and Ripk3–/–Casp8–/– mice injected i.p. with PBS or TNF-α and IFN-γ at 5 h post-treatment. Data are representative of two independent experiments. Data are shown as mean ± SEM (C–F). p < 0.05; ∗∗p < 0.01; ∗∗∗∗p < 0.0001. Analysis was performed using the survival curve comparison (log-Rank [Mantel-Cox] test) (A and B) or the two-way ANOVA (C–F).
Figure 7
Figure 7
Blocking TNF-α and IFN-γ Provides Protection in Disease Models Associated with Cytokine Storm: SARS-CoV-2 Infection, Cytokine Shock, Sepsis, and HLH (A) Survival of 6- to 8-week-old WT mice injected with isotype control (n = 10) or neutralizing antibodies against TNF-α and IFN-γ (n = 14) 12 h before i.p. injection of TNF-α and IFN-γ. (B) Survival of 7- to 8-week-old K18-hACE2 transgenic mice injected with isotype control (n = 12) or neutralizing antibodies against TNF-α and IFN-γ (n = 13) on day 1, 3, and 4 after infection with SARS-CoV-2 (2 × 104 pfu/mouse). (C) Survival of 7- to 8-week-old WT mice injected i.p. with poly I:C (10 mg/kg body weight) followed 24 h later by i.p. injection of PBS (n = 15), isotype control (n = 15), neutralizing antibody against TNF-α (n = 15), neutralizing antibody against IFN-γ (n = 15), or neutralizing antibodies against both TNF-α and IFN-γ (n = 15). Mice were then challenged with LPS (5 mg/kg body weight) 1 h after the treatments. (D) Survival of 7- to 8-week-old WT mice injected with PBS (n = 17), isotype control (n = 10), neutralizing antibody against TNF-α (n = 17), neutralizing antibody against IFN-γ (n = 17), or neutralizing antibodies against both TNF-α and IFN-γ (n = 18) 30 min and 6 h after i.p. injection of a lethal dose of LPS (20 mg/kg body weight). (E) Schematic overview of the mechanism of TNF-α and IFN-γ-induced pathology and the inflammatory cell death pathway with strategies for potential therapeutics. Data are pooled from two independent experiments (A–D). p < 0.05; ∗∗∗p < 0.001; ∗∗∗∗p < 0.0001. Analysis was performed using the survival curve comparison (log-Rank [Mantel-Cox] test).

Update of

References

    1. Albina J.E., Reichner J.S. Role of nitric oxide in mediation of macrophage cytotoxicity and apoptosis. Cancer Metastasis Rev. 1998;17:39–53. - PubMed
    1. Aouba A., Baldolli A., Geffray L., Verdon R., Bergot E., Martin-Silva N., Justet A. Targeting the inflammatory cascade with anakinra in moderate to severe COVID-19 pneumonia: case series. Ann. Rheum. Dis. 2020;79:1381–1382. - PubMed
    1. Atal S., Fatima Z. IL-6 Inhibitors in the Treatment of Serious COVID-19: A Promising Therapy? Pharmaceut. Med. 2020;34:223–231. - PMC - PubMed
    1. Bailey A., Pope T.W., Moore S.A., Campbell C.L. The tragedy of TRIUMPH for nitric oxide synthesis inhibition in cardiogenic shock: where do we go from here? Am. J. Cardiovasc. Drugs. 2007;7:337–345. - PubMed
    1. Belkhelfa M., Rafa H., Medjeber O., Arroul-Lammali A., Behairi N., Abada-Bendib M., Makrelouf M., Belarbi S., Masmoudi A.N., Tazir M., Touil-Boukoffa C. IFN-γ and TNF-α are involved during Alzheimer disease progression and correlate with nitric oxide production: a study in Algerian patients. J. Interferon Cytokine Res. 2014;34:839–847. - PubMed

Publication types

MeSH terms