Review
. 2021 Feb 3;29(2):442-463.
doi: 10.1016/j.ymthe.2020.11.029. Epub 2020 Dec 3.

Clinical Perspective: Treating RPE65-Associated Retinal Dystrophy

Affiliations
Review

Clinical Perspective: Treating RPE65-Associated Retinal Dystrophy

Albert M Maguire et al. Mol Ther. .

Abstract

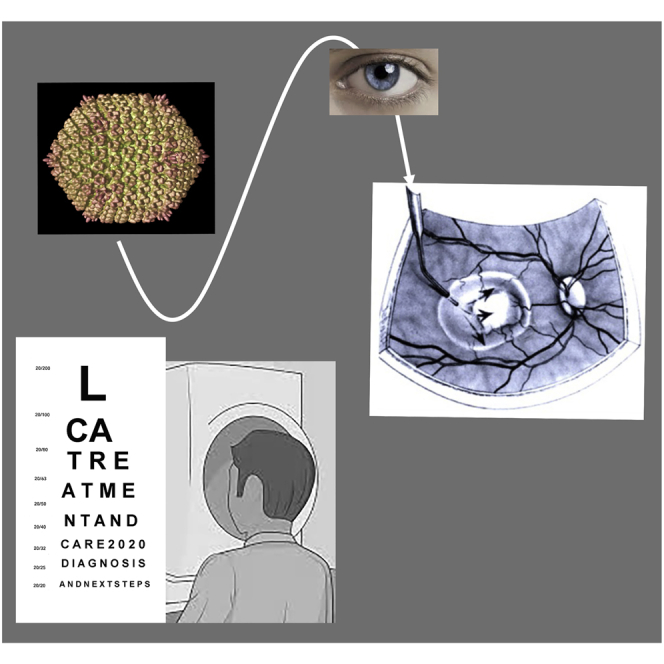
Until recently, there was no approved treatment for a retinal degenerative disease. Subretinal injection of a recombinant adeno-associated virus (AAV) delivering the normal copy of the human RPE65 cDNA led to reversal of blindness first in animal models and then in humans. This led to the first US Food and Drug Administration (FDA)-approved gene therapy product for a genetic disease, voretigene neparvovec-rzyl (Luxturna). Luxturna was then approved by the European Medicines Association and is now available in the US through Spark Therapeutics and worldwide through Novartis. Not only has treatment with Luxturna changed the lives of people previously destined to live a life of blindness, but it has fueled interest in developing additional gene therapy reagents targeting numerous other genetic forms of inherited retinal disease. This review describes many of the considerations for administration of Luxturna and describes how lessons from experience with Luxturna could lead to additional gene-based treatments of blindness.


Conflict of interest statement

J.B. and A.M.M. are co-authors on a patent relevant to development of gene therapy for RPE65 deficiency (US Patent #8,147,823) but waived any potential financial gain in 2002. B.P.L. serves as a consultant for Spark Therapeutics but directs his payments to the Department of Ophthalmology at the University of Gent. A.M.M. and T.S.A. carry out long-term follow-up of patients treated with Luxturna in the CHOP phase 1 to 4 (post-approval) trials under a CTA from Spark Therapeutics. E.M.A. declares no competing interests.

Figures

None
Graphical abstract
Figure 1
Figure 1
Spectrum of Funduscopic Changes in RPE65-IRD Arrows point to areas of RPE depigmentation in a bull’s eye configuration (P2 and P3) in the parafovea and to areas of lacunar chorioretinal atrophy (P3) in the periphery. P4 shows yellow-white lesions.
Figure 2
Figure 2
Structural-Functional Relationships in RPE65-IRD (A) Color fundus images of the right eye of two of the patients. (B) Goldmann kinetic perimetry with large targets (V-4e and IV-4e) in untreated patients demonstrating limited extent of the visual fields (to the central 20°–40°) and no perception of smaller targets. (C) 7-mm-long, non-straightened, SD-OCT cross-sections along the vertical (VR21) and horizontal (VR25) meridian through the fovea in two patients. Nuclear layers are labeled (ONL, outer nuclear layer; INL, inner nuclear layer; GCL, ganglion cell layer). Visible outer photoreceptor/RPE sublaminae are labeled (ELM, external limiting membrane; EZ, inner segment/outer segment ellipsoid region) following conventional terminology. T, temporal retina; N, nasal retina; I, inferior retina; S, superior retina. Scale bars (bottom left), 200 μm. The images illustrate severe foveal abnormalities and the asymmetric extent of the degree photoreceptor preservation around the foveal center (T > N, S > I) at this stage in patients from this family with RPE65-LCA. Asterisk denotes points to severe foveal ONL thinning with approximation of the EZ band to the RPE (VR21) or interruption (VR25). Bar above the scan shows psychophysically determined cone (light-adapted, white stimulus). Dotted line above bar defines lower limit (mean of 2 SD) of sensitivity for control subjects. Images illustrate structural functional dissociation with severe retinal dysfunction contrasting with relatively preserved central retinal structure.
Figure 3
Figure 3
Retinal Thickness Topography as a Guide for Retinal Gene Therapy Montage built from overlapping 30o X 20o “raster” (or volume) scans vertically separated by 0.1 mm from a young patient with RPE65-IRD. Retinal thickness is mapped to a pseudocolor scale shown to the right. Overlaid are 9-mm-long SD-OCT cross-sections sampling regions with a high likelihood of demonstrating detectable photoreceptors. In young subjects the decline in thickness of a visible ONL with increasing distance from the fovea generally corresponds to the decline in overall retinal thickness.
Figure 4
Figure 4
Assessing Photoreceptor and RPE Health in RPE65-IRDs (A) SD-OCT total thickness topography (left) and near infrared fundus autofluorescence (NIR-FAF) in an RPE65-IRD patient. Overlaid dotted line defines area with detectable photoreceptors by inspection of individual SD-OCT cross-sections that may be targeted by the subretinal injection or bleb. Inset: normal NIR-FAF. f, fovea. (B) SD-OCT, 6-mm-long cross-sections through the fovea before treatment. Nuclear and outer sublaminae are labeled as in Figure 2. Inset: near infrared reflectance (NIR-REF) image with an overlaying arrow to show the position and orientation of the scans. Scale bar (bottom left), 200 μm. The ONL thickness in cross-section does not accurately match the thickness topography. The red arrow in (A) points to a thicker (warmer color) parafoveal region that does not match the even and symmetrical decline in ONL thickness with distance from the fovea into the nasal and temporal retina demonstrated in the SD-OCT cross-section in (B), suggesting, in the absence of cystoid edema, inner retinal thickening due to secondary inner retinal remodeling. A faint NIR-FAF signal near the center surrounded by background choroidal autofluorescence corresponds in lateral extent with a region of clearly detectable RPE/Bruch’s membrane (BrM), photoreceptor ONL, and EZ signals on the SD-OCT cross-section (diagonal white arrows). A very thin ONL can be traced away from the foveal center into the pericentral retina, well beyond the area of relative preservation of RPE and photoreceptors. Note the hyporeflective space between the EZ and RPE/BrM band at the foveal center that likely corresponds with sparsely distributed and shorter cone photoreceptor outer segments.
Figure 5
Figure 5
Structural Details by Multimodal Retinal Imaging in Late-Stage RPE65-IRD (A) Fundus photography: total retinal thickness topography and NIR-FAF in a patient with severe disease. White arrows points to areas of detectable RPE melanin by fundus photography (left panel) and NIR-FAF (right panel) near the foveal center and in peripapillary retina. As in Figure 4, a red arrow points to an area of increased overall retinal thickness that does not match the gradual, even decline in ONL thickness, symmetrical on either side of the fovea. (B) 16-mm-long horizontal SD-OCT cross-section through the fovea in the same patient. Red line overlaid on the NIR-REF image delineates region with detectable, albeit severely thin, ONL, as demonstrated on the SD-OCT cross-section by outlining the outer plexiform layer in yellow. The RPE/BrM is clearly detectable on the SD-OCT scan, and there are spotty signals above the apical RPE/BrM that may correspond with the abnormal photoreceptor outer segment or its remnants. (C) Fundus photography: NIR-REF and NIR-FAF in a patient with severe disease. White arrows point to areas of relatively better coloration in the parafoveal retina (left panel) possibly reflecting surviving RPE, which corresponds to a darker region on NIR-REF. There is virtually no RPE melanin autofluorescence detectable on the non-normalized NIR-FAF (right panel). The area of better coloration on the color fundus image corresponds with a darker image on the NIR-REF and NIR-FAF image suggesting detectable photoreceptors and demelanized RPE overlaying the background choroidal autofluorescence signals that are crisscrossed by large dark choroidal vessels (right panel). (D) 9-mm-long vertical SD-OCT cross-section through the fovea in the same patient. A severely thin ONL, outlined by the outer plexiform layer (in yellow), overlies a thin RPE/BrM signal that likely corresponds to a severely abnormal RPE or bare BrM devoid of overlying RPE. A severely abnormal to non-detectable RPE, even if photoreceptors are identifiable, may be considered an additional contraindication for AAV2.RPE65 augmentation treatment in RPE65-IRD.
Figure 6
Figure 6
Surgical Details of the Subretinal Delivery of Gene Therapy Two intraoperative snapshots demonstrating the peripheral boundaries of the subretinal bleb (arrows) in relation to the location of the retinotomy (arrowheads). Asterisk indicates foveal region.
Figure 7
Figure 7
Functional Changes after Subretinal Gene Therapy for RPE65-IRD (A) NIR-FAF, 55°-wide images of the posterior retina of the right eye of the two with RPE65-LCA treated with bilateral subretinal gene therapy (Luxturna, Sparks Therapeutics, Philadelphia, PA, USA). Red line denotes the inferior boundary of a subretinal bleb that contains the treating product, which extends from the superior retina crossing the fovea and into the inferior pericentral retina. (B) Light-adapted achromatic and dark-adapted two-color chromatic static perimetry (showing only responses to a blue 500-nm stimulus) in the patients before (dashed lines) and after (continuous line) gene therapy. Dotted lines define lower limit (mean of 2 SD) of sensitivity in control subjects. S, superior visual field; I, inferior visual field. Horizontal arrows show the improvement in sensitivity supporting a treatment effect.
Figure 8
Figure 8
Full-field Sensitivity Changes after Gene Therapy for RPE65-IRDs FST sensitivity estimates measured with spectral stimuli (blue, 467 nm; red, 637 nm) in dark-adapted (>30 min) patients. Dotted gray line is the lower limit (mean of 2 SD) of the sensitivity to the short wavelength 467-nm stimulus in control subjects. Values are converted into positive dB values from possible negative outputs from the FST instrument. Patients are sorted left to right by age.

References

    1. Stone E.M., Andorf J.L., Whitmore S.S., DeLuca A.P., Giacalone J.C., Streb L.M., Braun T.A., Mullins R.F., Scheetz T.E., Sheffield V.C., Tucker B.A. Clinically focused molecular investigation of 1000 consecutive families with inherited retinal disease. Ophthalmology. 2017;124:1314–1331. - PMC - PubMed
    1. Koenekoop R.K. An overview of Leber congenital amaurosis: a model to understand human retinal development. Surv. Ophthalmol. 2004;49:379–398. - PubMed
    1. Foxman S.G., Heckenlively J.R., Bateman J.B., Wirtschafter J.D. Classification of congenital and early onset retinitis pigmentosa. Arch. Ophthalmol. 1985;103:1502–1506. - PubMed
    1. Heckenlively J., Foxmann S.G. Congenital and early-onset forms of retinitis pigmentosa. In: Heckenlively J., editor. Retinitis Pigmentosa. J.B. Lippincott; 1988. pp. 107–149.
    1. den Hollander A.I., Roepman R., Koenekoop R.K., Cremers F.P. Leber congenital amaurosis: genes, proteins and disease mechanisms. Prog. Retin. Eye Res. 2008;27:391–419. - PubMed

Publication types

Substances