

CCL2 is associated with microglia and macrophage recruitment in chronic traumatic encephalopathy
- PMID: 33278887
- PMCID: PMC7718711
- DOI: 10.1186/s12974-020-02036-4
CCL2 is associated with microglia and macrophage recruitment in chronic traumatic encephalopathy
Abstract
Background: Neuroinflammation has been implicated in the pathogenesis of chronic traumatic encephalopathy (CTE), a progressive neurodegenerative disease association with exposure to repetitive head impacts (RHI) received though playing contact sports such as American football. Past work has implicated early and sustained activation of microglia as a potential driver of tau pathology within the frontal cortex in CTE. However, the RHI induced signals required to recruit microglia to areas of damage and pathology are unknown.
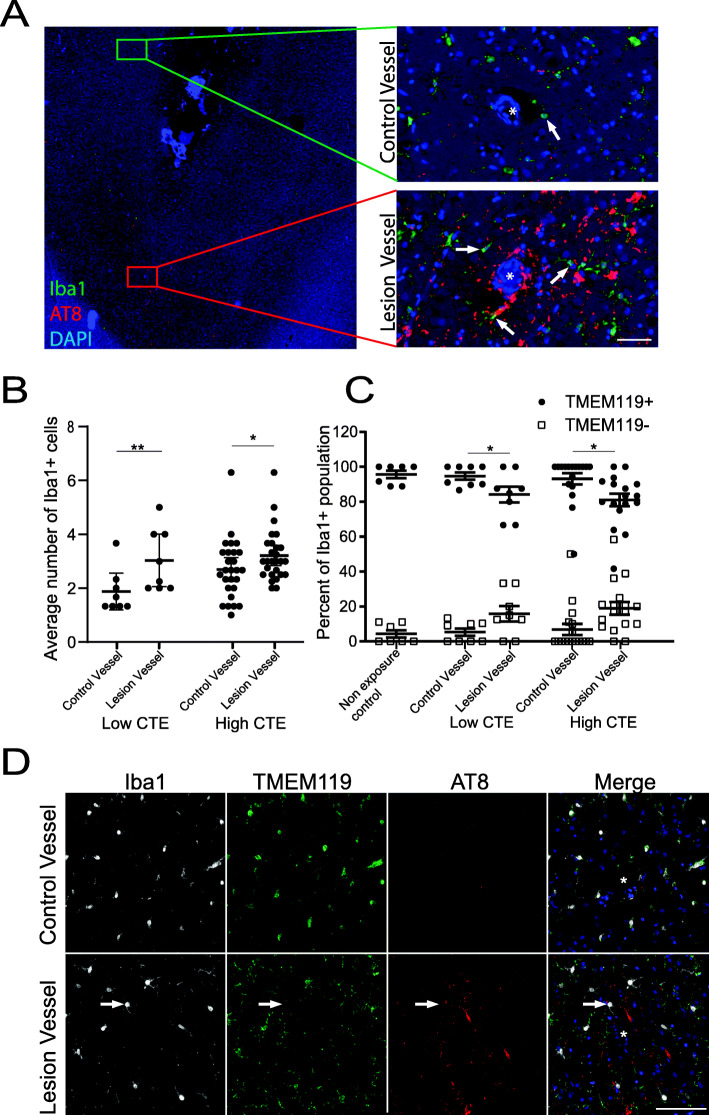
Methods: Postmortem brain tissue was obtained from 261 individuals across multiple brain banks. Comparisons were made using cases with CTE, cases with Alzheimer's disease (AD), and cases with no neurodegenerative disease and lacked exposure to RHI (controls). Recruitment of Iba1+ cells around the CTE perivascular lesion was compared to non-lesion vessels. TMEM119 staining was used to characterize microglia or macrophage involvement. The potent chemoattractant CCL2 was analyzed using frozen tissue from the dorsolateral frontal cortex (DLFC) and the calcarine cortex. Finally, the amounts of hyperphosphorylated tau (pTau) and Aβ42 were compared to CCL2 levels to examine possible mechanistic pathways.
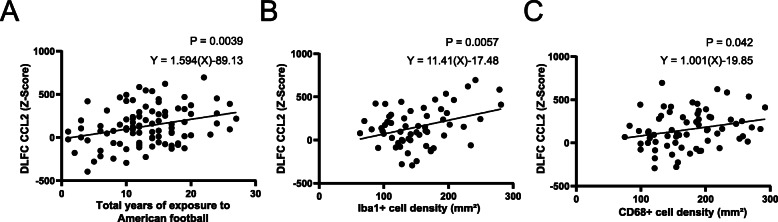
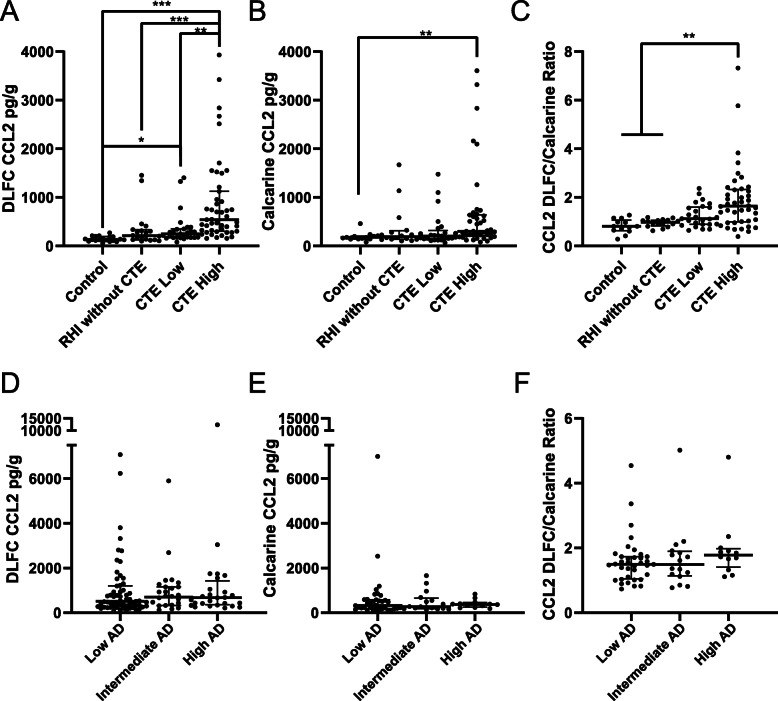
Results: An increase in Iba1+ cells was found around blood vessels with perivascular tau pathology compared to non-affected vessels in individuals with RHI. TMEM119 staining revealed the majority of the Iba1+ cells were microglia. CCL2 protein levels in the DLFC were found to correlate with greater years of playing American football, the density of Iba1+ cells, the density of CD68+ cells, and increased CTE severity. When comparing across multiple brain regions, CCL2 increases were more pronounced in the DLFC than the calcarine cortex in cases with RHI but not in AD. When examining the individual contribution of pathogenic proteins to CCL2 changes, pTau correlated with CCL2, independent of age at death and Aβ42 in AD and CTE. Although levels of Aβ42 were not correlated with CCL2 in cases with CTE, in males in the AD group, Aβ42 trended toward an inverse relationship with CCL2 suggesting possible gender associations.
Conclusion: Overall, CCL2 is implicated in the pathways recruiting microglia and the development of pTau pathology after exposure to RHI, and may represent a future therapeutic target in CTE.
Keywords: American football; CTE; Chemokine; Head impacts; Microglia; Neuroinflammation; TBI; Tau.
Conflict of interest statement
The authors declare that they have no competing interests.
Figures
References
-
- Cherry JD, Tripodis Y, Alvarez VE, Huber B, Kiernan PT, Daneshvar DH, Mez J, Montenigro PH, Solomon TM, Alosco ML, et al. Microglial neuroinflammation contributes to tau accumulation in chronic traumatic encephalopathy. Acta Neuropathol Commun. 2016;4:112. doi: 10.1186/s40478-016-0382-8. - DOI - PMC - PubMed
MeSH terms
Substances
Grants and funding
- U54NS115266/NS/NINDS NIH HHS/United States
- 75N92019D00031/HL/NHLBI NIH HHS/United States
- P30 AG013846/AG/NIA NIH HHS/United States
- K23 NS102399/NS/NINDS NIH HHS/United States
- BX004349/U.S. Department of Veterans Affairs
- U54 NS115266/NS/NINDS NIH HHS/United States
- HHSN268201500001I/HL/NHLBI NIH HHS/United States
- K23NS102399/NS/NINDS NIH HHS/United States
- HHSN2682015000011/Contract
- RF1AG057768/AG/NIA NIH HHS/United States
- AG08122/NH/NIH HHS/United States
- R01 AG054076/AG/NIA NIH HHS/United States
- AG057902/AG/NIA NIH HHS/United States
- U19-AG068753/NH/NIH HHS/United States
- K23AG046377/AG/NIA NIH HHS/United States
- RF1AG054156/AG/NIA NIH HHS/United States
- U01NS086659/NS/NINDS NIH HHS/United States
- AG054076/NH/NIH HHS/United States
- AARF-17-529888/ALZ/Alzheimer's Association/United States
- BX002466/U.S. Department of Veterans Affairs
- I01-CX001038/U.S. Department of Veterans Affairs
- IK2 BX004349/BX/BLRD VA/United States
- RF1 AG057902/AG/NIA NIH HHS/United States
- P30AG013846; supplement 0572063345-5/AG/NIA NIH HHS/United States
- AG06234/AG/NIA NIH HHS/United States
LinkOut - more resources
Full Text Sources
Medical
Miscellaneous
