. 2021 Mar 3;29(3):1335-1348.
doi: 10.1016/j.ymthe.2020.11.031. Epub 2020 Dec 3.

ADAR1 Stimulation by IFN-α Downregulates the Expression of MAVS via RNA Editing to Regulate the Anti-HBV Response

Affiliations

ADAR1 Stimulation by IFN-α Downregulates the Expression of MAVS via RNA Editing to Regulate the Anti-HBV Response

Tao Li et al. Mol Ther. .

Abstract

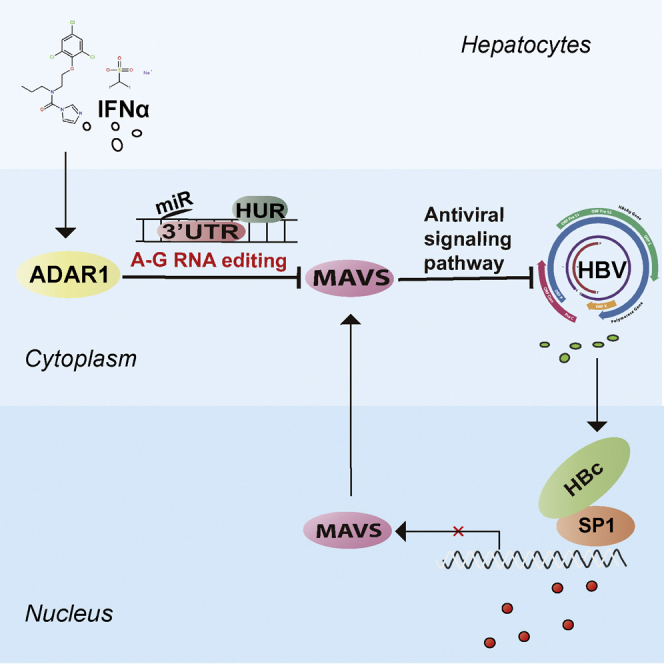
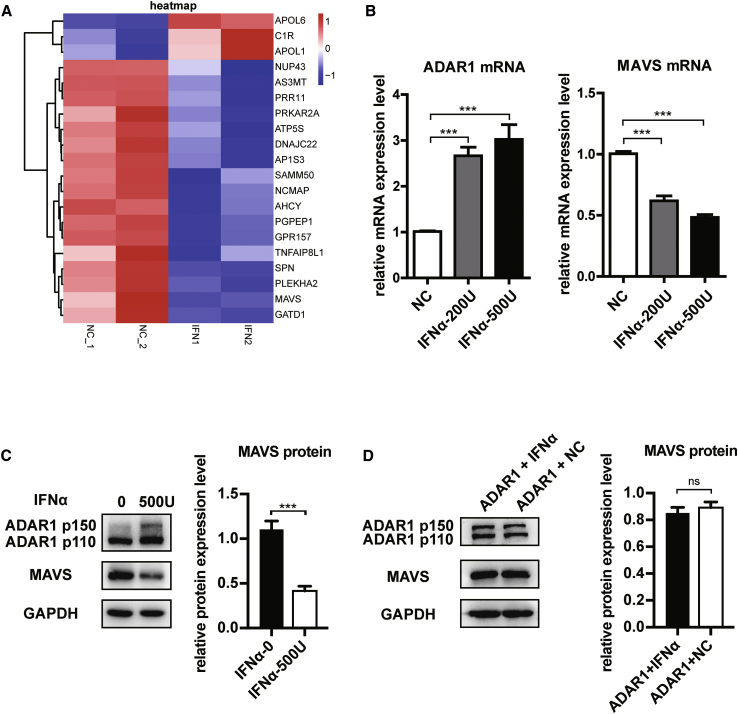
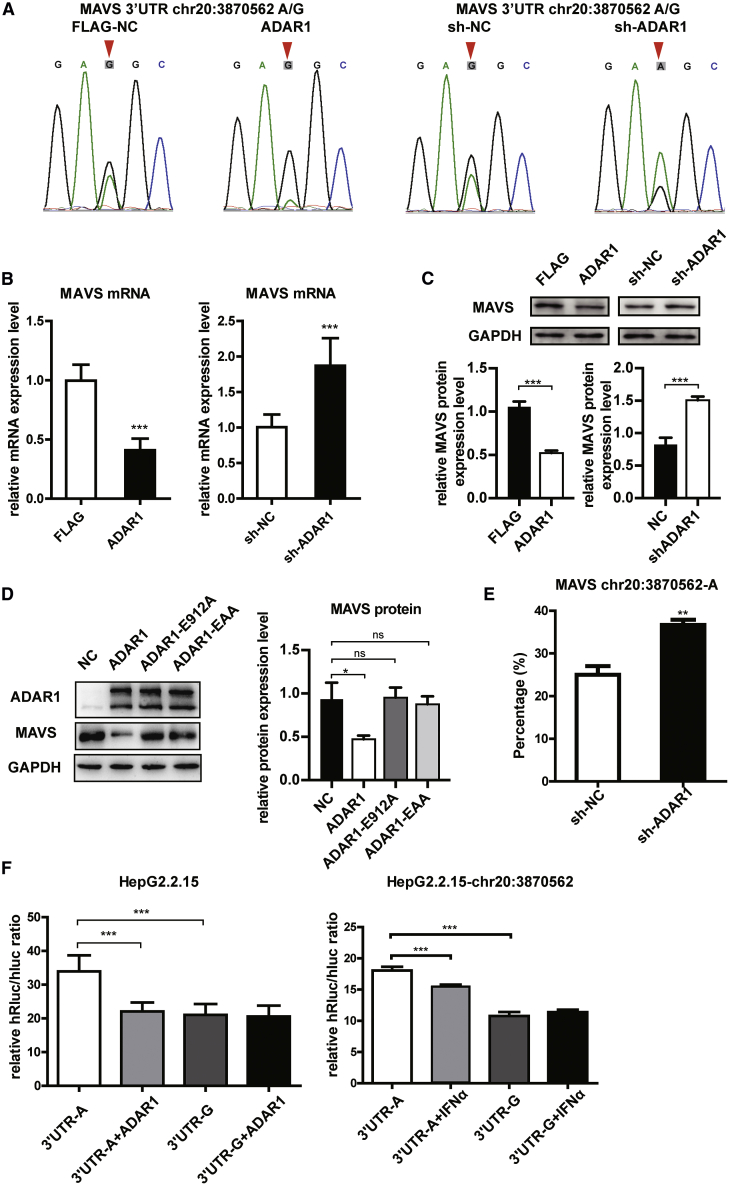
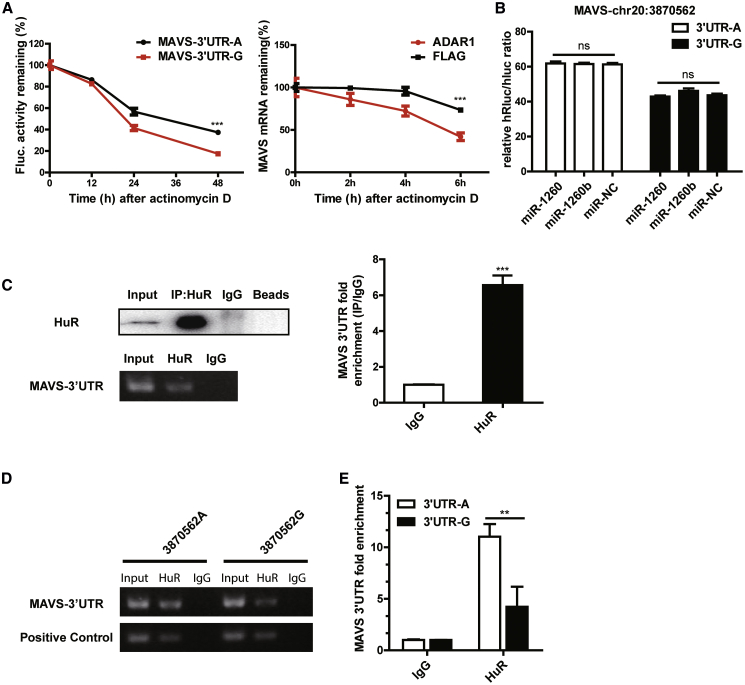
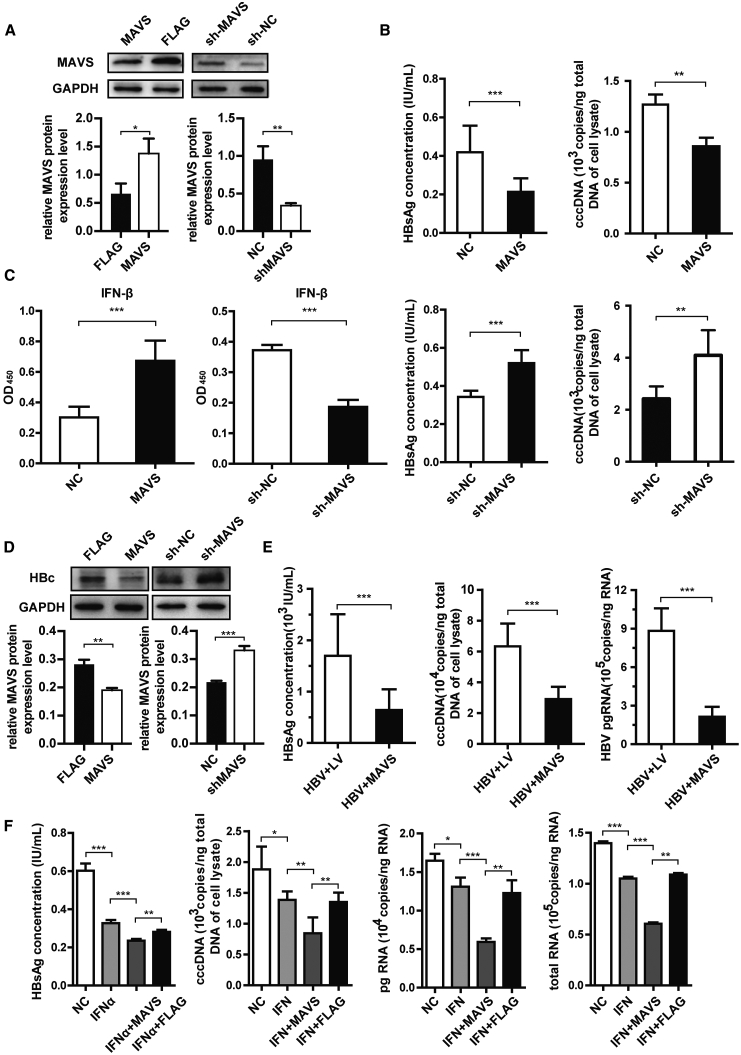
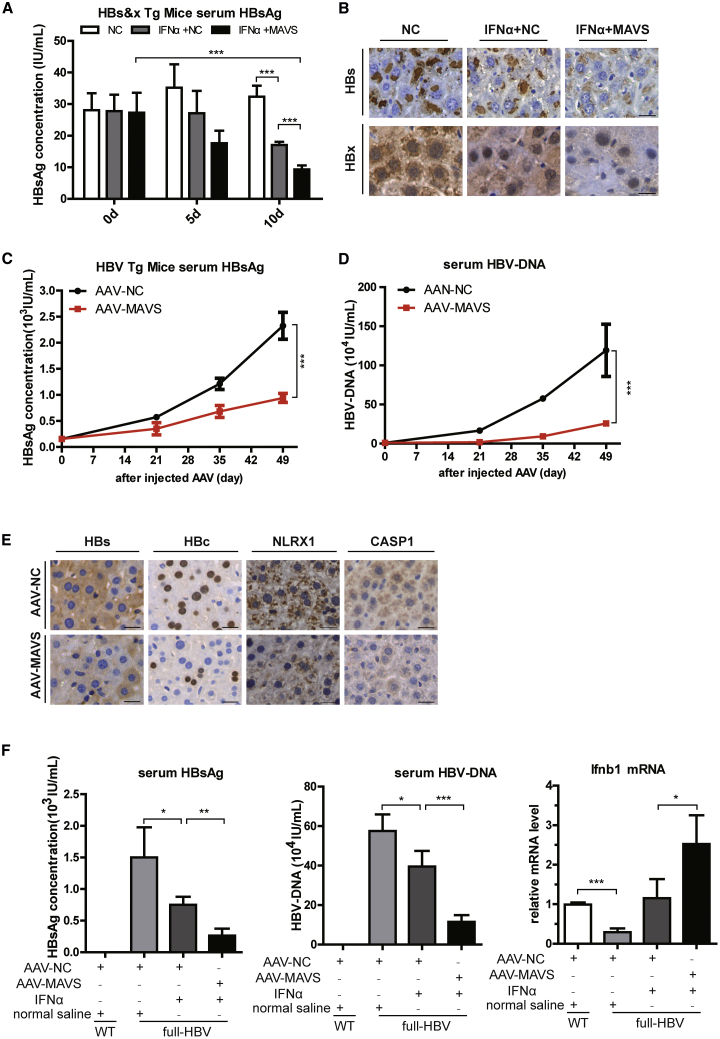
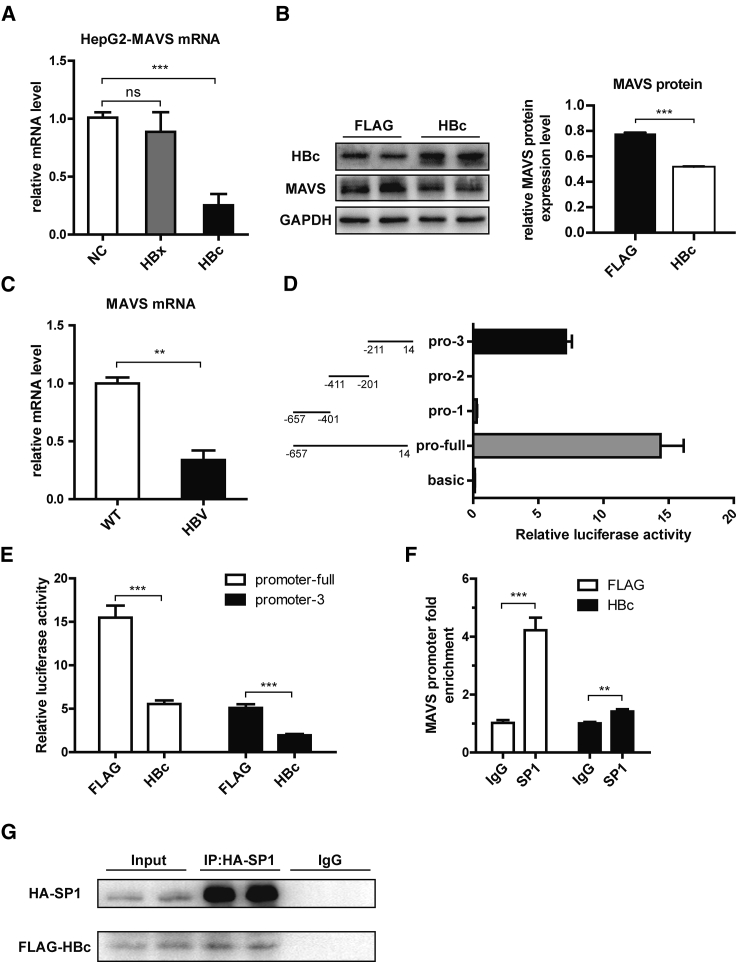
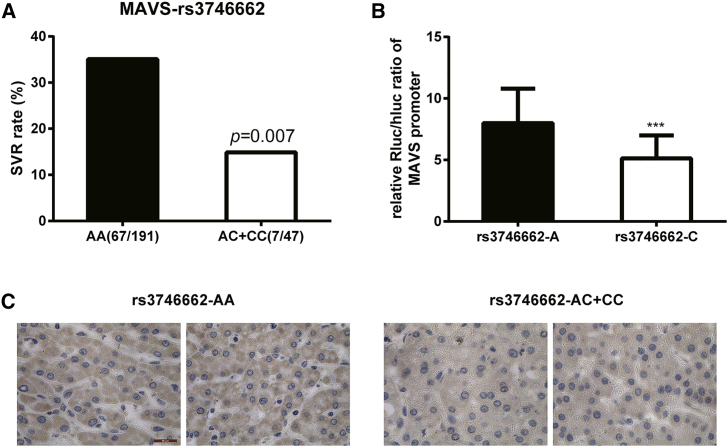
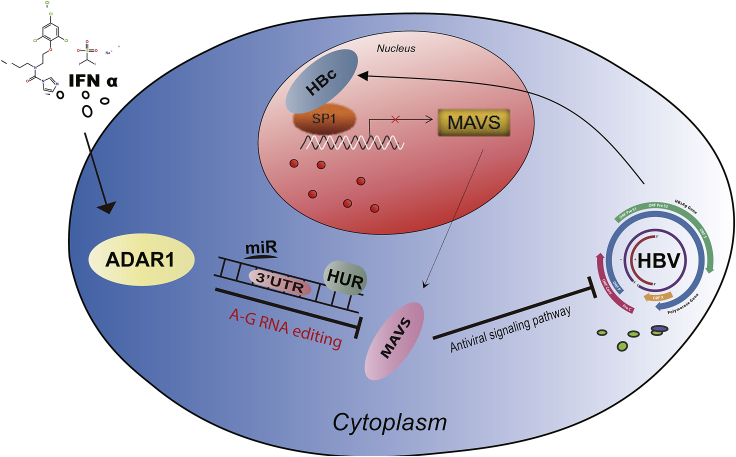
The partial response of chronic hepatitis B virus (CHB) patients to interferon-α (IFN-α) therapy remains elusive, which requires a better understanding of the involved molecular mechanism. In our study, bioinformatics analysis was applied to relate IFN-α regulated candidate genes and RNA editing sites by RNA sequencing. Mitochondrial antiviral signaling protein (MAVS) antiviral effect was confirmed in HepG2.2.15 cells and in two mouse models. The associations between polymorphisms in MAVS gene and response to IFN-α therapy were confirmed in CHB patients. We found that IFN-α downregulates MAVS via RNA editing that was mediated by adenosine deaminase acting on RNA (ADAR1). ADAR1 inhibited MAVS expression via a human antigen R (HuR)-mediated post-transcriptional regulation. MAVS exerted an antiviral activity and reduced the level of hepatitis B virus (HBV) markers in vitro and in vivo. IFN-α antiviral effects were significantly enhanced by MAVS co-transfection. Hepatitis B core protein (HBc) interacted with SP1 to inhibit the promoter activity of MAVS that regulates its expression. CHB patients with a rs3746662A allele had higher MAVS expression and thus were more responsive to IFN-α treatment. In this work, we demonstrated that the decrease of MAVS expression is mediated by the IFN-α-ADAR1 axis. This study also highlighted the potential for the clinical application of MAVS in combination with IFN-α for the treatment of HBV infection.

Keywords: RNA editing; adenosine deaminase acting on RNA; hepatitis B virus; mitochondrial antiviral signaling protein; polymorphism.


Conflict of interest statement

The authors declare no competing interests.

Figures

None
Graphical abstract
Figure 1
Figure 1
IFN-α Inhibited the Expression of MAVS in HepG2.2.15 Cells (A) Twenty candidate genes for differential expression analysis and potential RNA editing screening of ADAR1 via sequence analysis of transcription group. (B) qPCR analysis of mRNA levels of ADAR1 and MAVS at different concentrations of IFN-α. (C) Western blot analysis of ADAR1 P150 and MAVS protein expression at different concentrations of IFN-α normalized to GAPDH. Right panel shows quantification from three replicates. (D) Western blot analysis and quantification of protein levels of ADAR1 and MAVS in ADAR1 overexpressing HepG2.2.15 cells at different concentrations of IFN-α. Data represent the mean ± SD of three independent experiments. ∗p < 0.05, ∗∗p < 0.01, ∗∗∗p < 0.001.
Figure 2
Figure 2
ADAR1 Inhibited MAVS Expression by RNA Editing (A) ADAR1-P150, FLAG-NC, sh-ADAR1, and sh-NC were overexpressed in HepG2.2.15 cells, Sanger sequencing was used to detect the chr20:3870562 site of MAVS 3′UTR. (B) HepG2.2.15 cells were transfected with ADAR1-overexpressing or knockdown (sh-ADAR1) plasmids. qPCR analysis of mRNA levels of MAVS. (C) Western blot analysis and quantification of MAVS protein expression. (D) HepG2.2.15 cells were transfected with NC-FLAG, ADAR1, ADAR1 EAA, and ADAR1 E912A plasmid. Western blot analysis and quantification of ADAR1 and MAVS. (E) Pyrosequencing results of RNA editing rates in ADAR1 overexpression, NC-FLAG, sh-ADAR1, and sh-NC groups. (F) HepG2.2.15 cells were transfected with ADAR1 or NC-FLAG plasmid (left) or treatment with IFN-α or PBS negative control (right) and normal A allele or edited G allele reporter plasmid, respectively. NC, non-specific control. Analyzed for relative luciferase activity. Data represent the mean ± SD of three independent experiments. ∗p < 0.05, ∗∗p < 0.01, ∗∗∗p < 0.001.
Figure 3
Figure 3
ADAR1 Inhibits MAVS Expression by HuR-Mediated Post-transcriptional Regulation (A) The decay rate of relative luciferase activity of normal A allele or edited G allele after using actinomycin D (1 μg/mL) in HepG2.2.15 cells. HepG2.2.15 cells were transfected with NC-FLAG and ADAR1 plasmid. The decay rate of mRNA was detected at prescribed time points after using actinomycin D (1 μg/mL) is shown. (B) Luciferase assay of A or G alleles after transfected miRNAs in HepG2.2.15 cells. (C) The interaction of HuR with the MAVS 3′UTR by RNA immunoprecipitation (RIP) in HepG2.2.15 cells. Western blot analysis for HuR protein following RIP with a HuR-specific antibody or an IgG control and qPCR analysis of MAVS 3′UTR mRNA in HepG2.2.15 cells are shown. (D and E) RIP analysis after transiently transfecting with 3870562-A and 3870562-G luciferase reporter plasmids via gel electrophoresis and qPCR. Data represent the mean ± SD of three independent experiments. ∗p < 0.05, ∗∗p < 0.01, ∗∗∗p < 0.001.
Figure 4
Figure 4
MAVS Inhibits the Expression Levels of HBV Markers In Vitro (A) HepG2.2.15 cells were transfected with MAVS-overexpressing or knockdown (sh-MAVS) plasmid. Western blot analysis of MAVS protein expression normalized to GAPDH, which served as a protein loading control and IHC of cell-attached slides assay detected the HBx protein expression level are shown. (B) ELISA analysis of HBsAg in HepG2.2.15 cell supernatants and qRT-PCR determination of HBV cccDNA levels. Cells were transfected with the MAVS overexpression or knockdown plasmid. (C) ELISA analysis of IFN-β expression in HepG2.2.15 cells in MAVS overexpression, NC-FLAG, sh-MAVS, and sh-NC groups. (D) Western blot analysis and quantification of HBc expression in HepG2.2.15 cells in MAVS overexpression, NC-FLAG, sh-MAVS, and sh-NC groups. (E) ELISA analysis of HBsAg in HepG2.2.15 cell supernatants and qRT-PCR determination of HBV DNA, cccDNA, and pgRNA levels. Cells were co-transfected with the HBV and MAVS overexpression or NC plasmid. (F) HepG2.2.15 cells were transfected with MAVS-overexpressing plasmid or the empty FLAG vector and treated with or without IFN-α. ELISA analysis of HBsAg in HepG2.2.15 cell supernatants and qRT-PCR determination of HBV cccDNA and HBV pgRNA levels are shown. Data represent the mean ± SD of three independent experiments. ∗p < 0.05, ∗∗p < 0.01, ∗∗∗p < 0.001.
Figure 5
Figure 5
MAVS Inhibits HBV Replication in Two HBV Tg Mouse Strains (A) ELISA analysis of HBsAg in serum after hydrodynamic injection and treatment of IFN-α (105 U/kg) and MAVS DNA 20 μg (n = 6). (B) IHC assay of HBsAg and HBx in the liver of HBV mouse (n = 6). Scale bar, 50 μm. (C and D) Continuous ELISA analysis of HBsAg and qPCR analysis of HBV DNA level in serum after AAV injection (n = 8). (E) IHC assay of HBs, HBc, NLRX1, and CASP1 in the liver of HBV mouse. (F) Analysis of HBsAg and HBV DNA levels in serum of the full HBV Tg mouse after AAV-NC or AAV-MAVS injection and treated with or without IFN-α (n = 4). Analysis of the full HBV Tg mouse liver Ifnb1 mRNA level after AAV-NC or AAV-MAVS injection and treated with or without IFN-α (n = 4) is shown. Scale bar, 50 μm. Data represent the mean ± SD. ∗p < 0.05, ∗∗p < 0.01, ∗∗∗p < 0.001.
Figure 6
Figure 6
SP1 Regulates the Expression of MAVS by Interacting with HBc (A) HepG2 cells were transfected with FLAG-NC, HBx, or HBc plasmid. qPCR analysis of MAVS mRNA expression is shown. (B) HepG2.2.15 cells were transfected with FLAG-NC or HBc plasmid. Western blot analysis and quantification of MAVS protein expression is shown. (C) MAVS mRNA level in liver tissues of the full HBV Tg mouse was detected by qPCR. (D) Detection of the activity of MAVS promoter fragment by dual luciferase reporter gene assay. (E) The relative luciferase activity of promoter-full and promoter-3 was detected after overexpression of HBc and FLAG. (F) After overexpression of HBc and FLAG, the level of MAVS promoter-3 enriched by SP1 was detected. (G) After the overexpression of HBc and SP1 in the HepG2.2.15 cells, they were detected by coIP. Data represent the mean ± SD. ∗p < 0.05, ∗∗p < 0.01, ∗∗∗p < 0.001.
Figure 7
Figure 7
Polymorphisms in the MAVS Gene Affect Response to IFN Therapy for Chronic Hepatitis B in Han Chinese (A) SVR rate between AG (or GG) and AA genotypes. (B) The luciferase assay of rs3746662C allele and rs3746662A allele. (C) IHC assay of MAVS in human liver tissues. Scale bar, 50 μm. Data represent the mean ± SD. ∗p < 0.05, ∗∗p < 0.01, ∗∗∗p < 0.001.
Figure 8
Figure 8
Schematic Representation of Present Study

References

    1. Ganem D., Prince A.M. Hepatitis B virus infection--natural history and clinical consequences. N. Engl. J. Med. 2004;350:1118–1129. - PubMed
    1. World Health Organization . 2017. Global Hepatitis Report, 2017.https://extranet.who.int/iris/restricted/handle/10665/255016
    1. Ghany M.G. Current treatment guidelines of chronic hepatitis B: The role of nucleos(t)ide analogues and peginterferon. Best Pract. Res. Clin. Gastroenterol. 2017;31:299–309. - PubMed
    1. Rang A., Bruns M., Heise T., Will H. Antiviral activity of interferon-alpha against hepatitis B virus can be studied in non-hepatic cells and Is independent of MxA. J. Biol. Chem. 2002;277:7645–7647. - PubMed
    1. Perrillo R. Benefits and risks of interferon therapy for hepatitis B. Hepatology. 2009;49(5, Suppl):S103–S111. - PubMed

Publication types

MeSH terms