

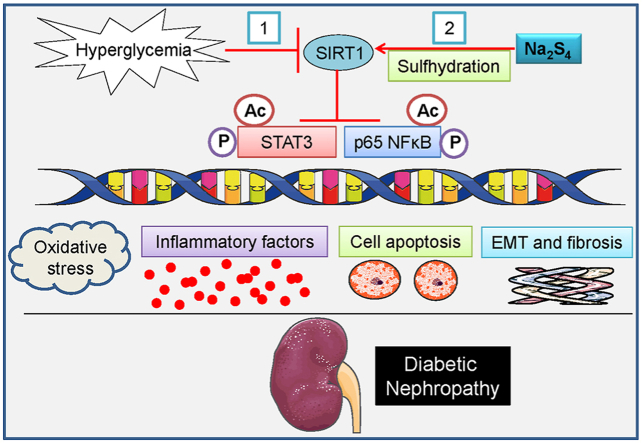
Polysulfide-mediated sulfhydration of SIRT1 prevents diabetic nephropathy by suppressing phosphorylation and acetylation of p65 NF-κB and STAT3
- PMID: 33279869
- PMCID: PMC7718489
- DOI: 10.1016/j.redox.2020.101813
Polysulfide-mediated sulfhydration of SIRT1 prevents diabetic nephropathy by suppressing phosphorylation and acetylation of p65 NF-κB and STAT3
Abstract
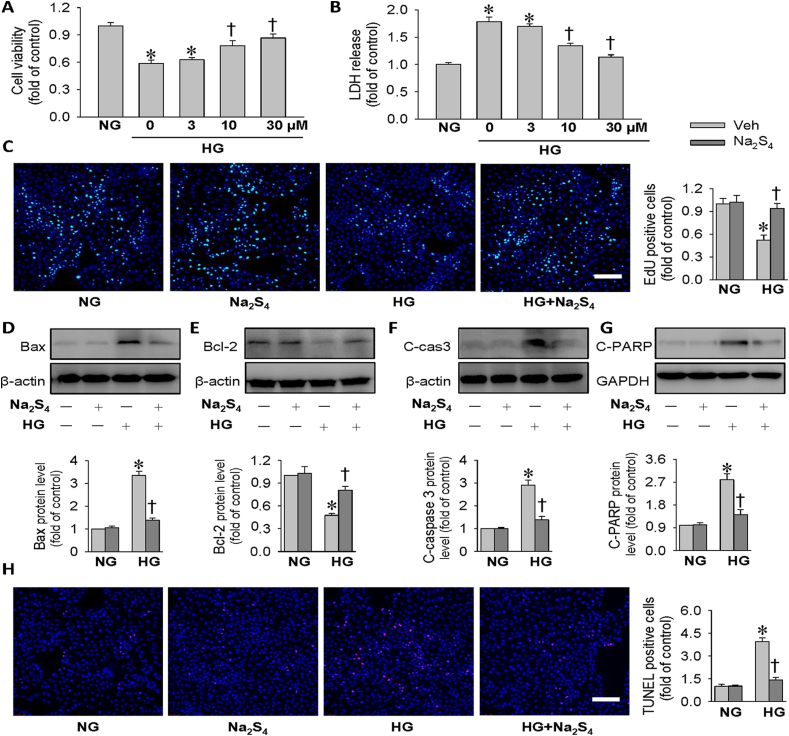
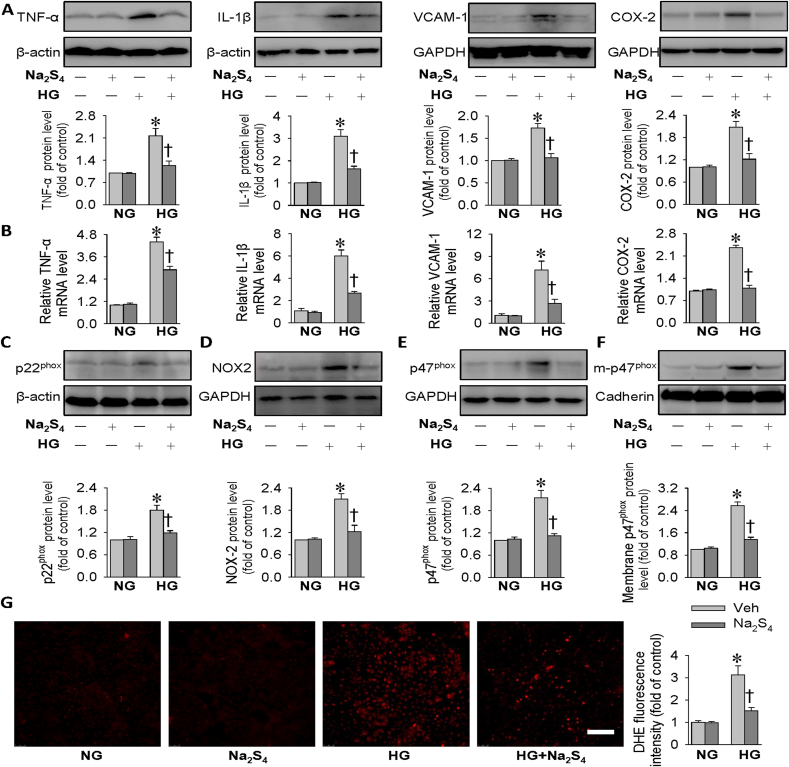
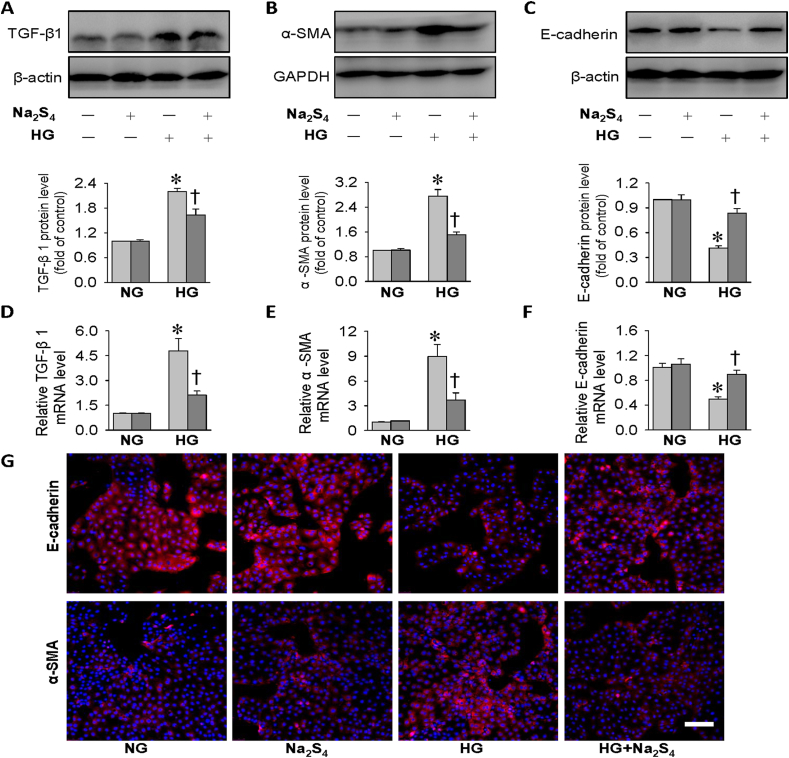
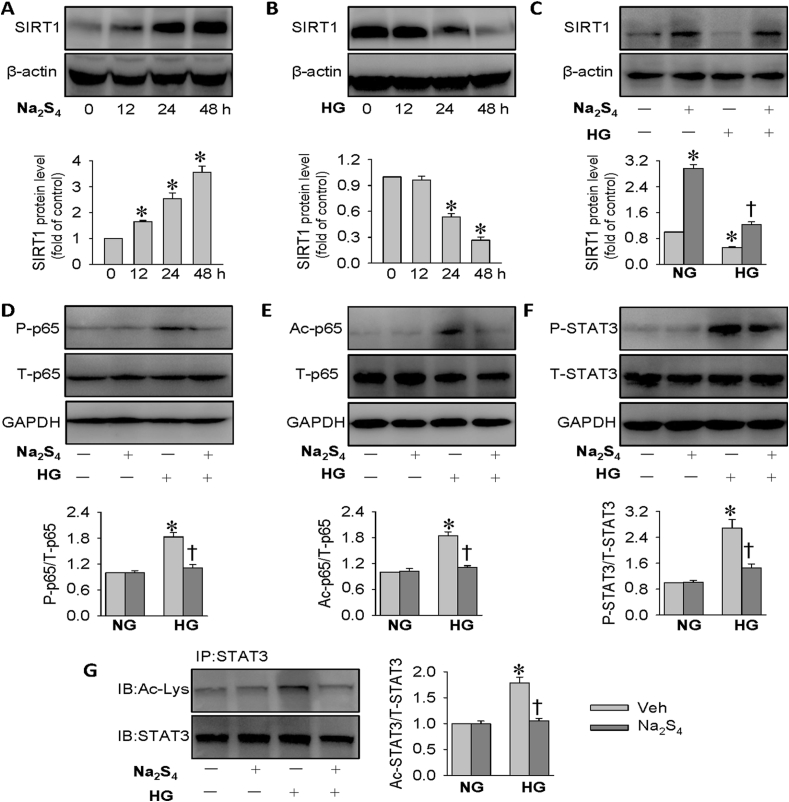
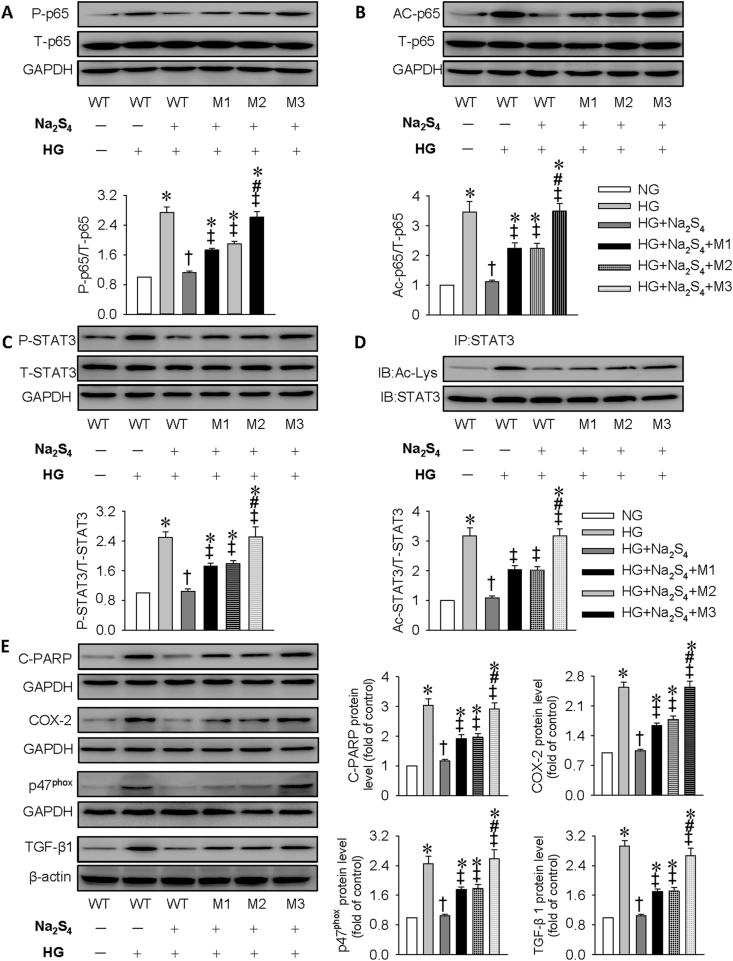
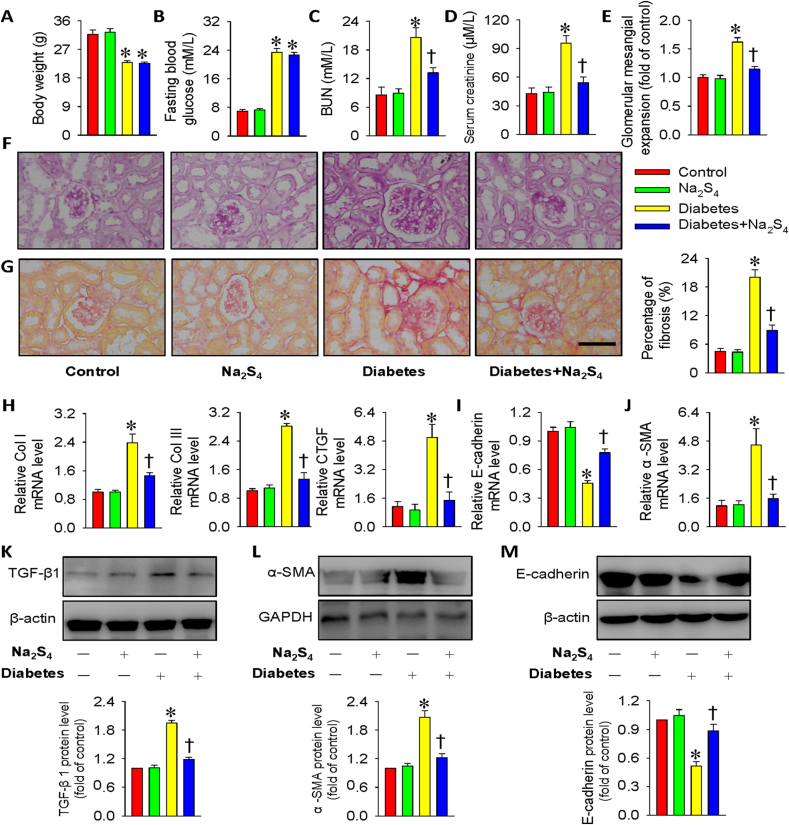
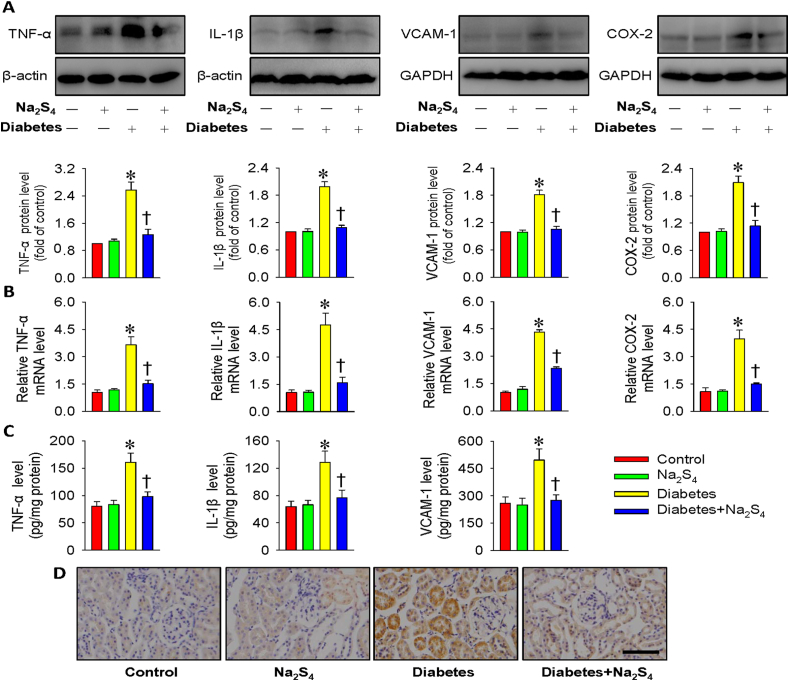
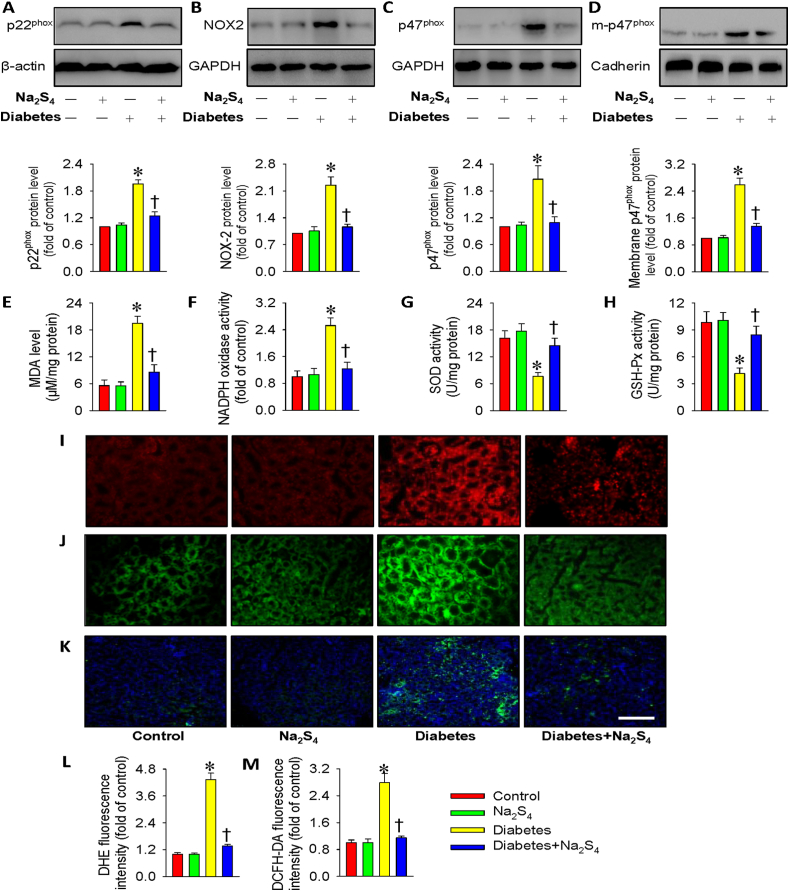
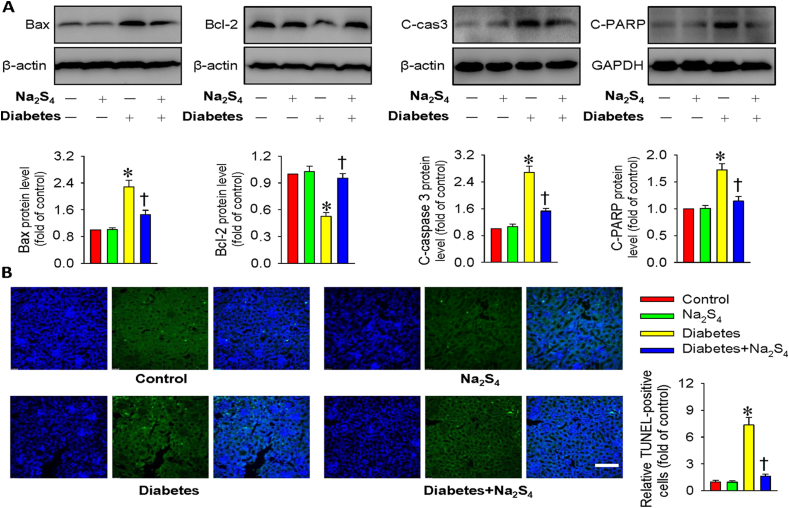
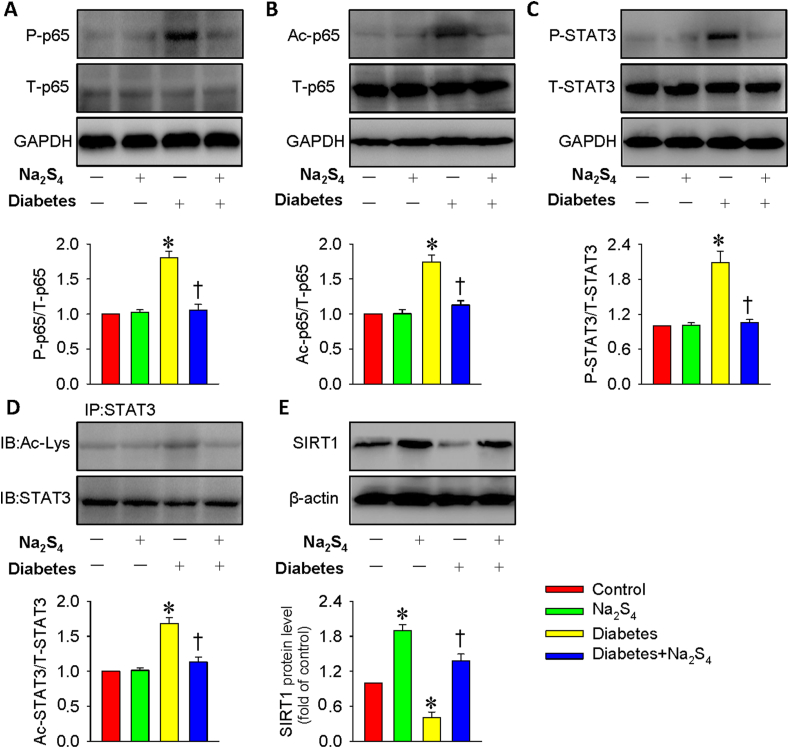
Diabetic kidney disease is known as a major cause of chronic kidney disease and end stage renal disease. Polysulfides, a class of chemical agents with a chain of sulfur atoms, are found to confer renal protective effects in acute kidney injury. However, whether a polysulfide donor, sodium tetrasulfide (Na2S4), confers protective effects against diabetic nephropathy remains unclear. Our results showed that Na2S4 treatment ameliorated renal dysfunctional and histological damage in diabetic kidneys through inhibiting the overproduction of inflammation cytokine and reactive oxygen species (ROS), as well as attenuating renal fibrosis and renal cell apoptosis. Additionally, the upregulated phosphorylation and acetylation levels of p65 nuclear factor κB (p65 NF-κB) and signal transducer and activator of transcription 3 (STAT3) in diabetic nephropathy were abrogated by Na2S4 in a sirtuin-1 (SIRT1)-dependent manner. In renal tubular epithelial cells, Na2S4 directly sulfhydrated SIRT1 at two conserved CXXC domains (Cys371/374; Cys395/398), then induced dephosphorylation and deacetylation of its targeted proteins including p65 NF-κB and STAT3, thereby reducing high glucose (HG)-caused oxidative stress, cell apoptosis, inflammation response and epithelial-to-mesenchymal transition (EMT) progression. Most importantly, inactivation of SIRT1 by a specific inhibitor EX-527, small interfering RNA (siRNA), a de-sulfhydration reagent dithiothreitol (DTT), or mutation of Cys371/374 and Cys395/398 sites at SIRT1 abolished the protective effects of Na2S4 on diabetic kidney insulting. These results reveal that polysulfides may attenuate diabetic renal lesions via inactivation of p65 NF-κB and STAT3 phosphorylation/acetylation through sulfhydrating SIRT1.
Keywords: Diabetic nephropathy; Hydrogen sulfide; Polysulfides; Reactive oxygen species; SIRT1.
Copyright © 2020. Published by Elsevier B.V.
Figures
References
-
- Dugbartey G.J. Diabetic nephropathy: a potential savior with 'rotten-egg' smell. Pharmacol. Rep. 2017;69:331–339. - PubMed
-
- Gruden G., Perin P.C., Camussi G. Insight on the pathogenesis of diabetic nephropathy from the study of podocyte and mesangial cell biology. Curr. Diabetes Rev. 2005;1:27–40. - PubMed
Publication types
MeSH terms
Substances
LinkOut - more resources
Full Text Sources
Other Literature Sources
Medical
Miscellaneous
