

Hierarchical Complexity of the Macro-Scale Neonatal Brain
- PMID: 33280008
- PMCID: PMC7945030
- DOI: 10.1093/cercor/bhaa345
Hierarchical Complexity of the Macro-Scale Neonatal Brain
Abstract
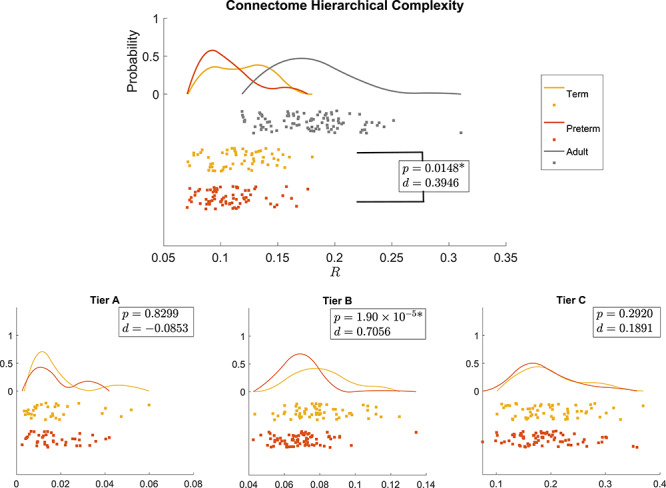
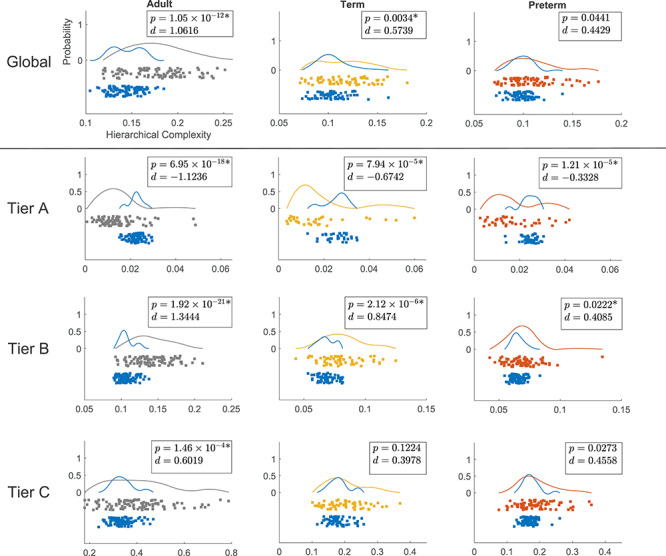
The human adult structural connectome has a rich nodal hierarchy, with highly diverse connectivity patterns aligned to the diverse range of functional specializations in the brain. The emergence of this hierarchical complexity in human development is unknown. Here, we substantiate the hierarchical tiers and hierarchical complexity of brain networks in the newborn period, assess correspondences with hierarchical complexity in adulthood, and investigate the effect of preterm birth, a leading cause of atypical brain development and later neurocognitive impairment, on hierarchical complexity. We report that neonatal and adult structural connectomes are both composed of distinct hierarchical tiers and that hierarchical complexity is greater in term born neonates than in preterms. This is due to diversity of connectivity patterns of regions within the intermediate tiers, which consist of regions that underlie sensorimotor processing and its integration with cognitive information. For neonates and adults, the highest tier (hub regions) is ordered, rather than complex, with more homogeneous connectivity patterns in structural hubs. This suggests that the brain develops first a more rigid structure in hub regions allowing for the development of greater and more diverse functional specialization in lower level regions, while connectivity underpinning this diversity is dysmature in infants born preterm.
Keywords: dMRI; developing brain; hierarchical complexity; network analysis; newborn; structural connectome.
© The Author(s) 2020. Published by Oxford University Press.
Figures
References
-
- Alexander B, Murray AL, Loh WY, Matthews LG, Adamson C, Beare R, Chen J, Kelly CE, Rees S, Warfield SK, et al. 2017. A new neonatal cortical and subcortical brain atlas: the Melbourne Children’s Regional Infant Brain (m-crib) atlas. NeuroImage. 147:841, 851. doi: 10.1016/j.neuroimage.2016.09.068. - DOI - PubMed
-
- Andersson JL, Graham MS, Zsoldos E, Sotiropoulos SN. 2016. Incorporating outlier detection and replacement into a non-parametric framework for movement and distortion correction of diffusion MR images. NeuroImage. 141:556–572. doi: 10.1016/j.neuroimage.2016.06.058. - PubMed
-
- Andersson JL, Skare S, Ashburner J. 2003. How to correct susceptibility distortions in spin-echo echo-planar images: application to diffusion tensor imaging. NeuroImage. 20:870–888. doi: https://doi.org/10.1016/S1053-8119(03)00336-7. - PubMed
Publication types
MeSH terms
Grants and funding
- Chief Scientist Office [UK]
- BHF_/British Heart Foundation/United Kingdom
- MR/N022556/1/MRC_/Medical Research Council/United Kingdom
- MR/R024065/1/MRC_/Medical Research Council/United Kingdom
- MR/K026992/1/MRC_/Medical Research Council/United Kingdom
- R380R/1114/DMT_/The Dunhill Medical Trust/United Kingdom
- U54 MH091657/MH/NIMH NIH HHS/United States
- G1002033/MRC_/Medical Research Council/United Kingdom
- R01 AG054628/AG/NIA NIH HHS/United States
- MR/S004122/1/MRC_/Medical Research Council/United Kingdom
- G0700704/MRC_/Medical Research Council/United Kingdom
- WT_/Wellcome Trust/United Kingdom
LinkOut - more resources
Full Text Sources
Medical
