Transceive phase corrected 2D contrast source inversion-electrical properties tomography
- PMID: 33280166
- PMCID: PMC7898605
- DOI: 10.1002/mrm.28619
Transceive phase corrected 2D contrast source inversion-electrical properties tomography
Abstract
Purpose: To remove the necessity of the tranceive phase assumption for CSI-EPT and show electrical properties maps reconstructed from measured data obtained using a standard 3T birdcage body coil setup.
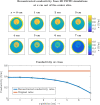
Methods: The existing CSI-EPT algorithm is reformulated to use the transceive phase rather than relying on the transceive phase assumption. Furthermore, the radio frequency (RF)-shield is numerically implemented to accurately model the RF fields inside the MRI scanner. We verify that the reformulated two-dimensional (2D) CSI-EPT algorithm can reconstruct electrical properties maps given 2D electromagnetic simulations. Afterward, the algorithm is tested with three-dimensional (3D) FDTD simulations to investigate if the 2D CSI-EPT can retrieve the electrical properties for 3D RF fields. Finally, an MR experiment at 3T with a phantom is performed.
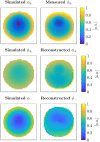
Results: From the results of the 2D simulations, it is seen that CSI-EPT can reconstruct the electrical properties using MRI accessible quantities. For 3D simulations, it is observed that the electrical properties are underestimated, nonetheless, CSI-EPT has a lower standard deviation than the standard Helmholtz based methods. Finally, the first CSI-EPT reconstructions based on measured data are presented showing comparable accuracy and precision to reconstructions based on simulated data, and demonstrating the feasibility of CSI-EPT.
Conclusions: The CSI-EPT algorithm was rewritten to use MRI accessible quantities. This allows for CSI-EPT to fully exploit the benefits of the higher static magnetic field strengths with a standard quadrature birdcage coil setup.
Keywords: EPT; MRI; RF-shield; contrast source inversion; dielectric tissue mapping; electrical properties tomography; transceive phase.
© 2020 The Authors. Magnetic Resonance in Medicine published by Wiley Periodicals LLC on behalf of International Society for Magnetic Resonance in Medicine.
Figures


References
-
- Katscher U, van den Berg C. Electric properties tomography: biochemical, physical and technical background, evaluation and clinical applications. NMR Biomed. 2017;30:e3729. - PubMed
-
- Holder D. Breast cancer screening with electrical impedance tomography In: Electrical Impedance Tomography: Methods, History and Applications. 1st ed. London: Institute of physics publishing; 2015, vol. 32, 167–182.
-
- Kim SY, Shin J, Kim DH, et al. Correlation between electrical conductivity and apparent diffusion coefficient in breast cancer: effect of necrosis on magnetic resonance imaging. EUR Radiol. 2018;28:3204‐3214. - PubMed
-
- Shin J, Kim MJ, Lee J, et al. Initial study on in vivo conductivity mapping of breast cancer using MRI. J Magn Reson Imaging. 2015;42:371‐378. - PubMed
-
- Kim SY, Shin J, Kim DH, et al. Correlation between conductivity and prognostic factors in invasive breast cancer using magnetic resonance electric properties tomography (MREPT). EUR Radiol. 2016;26:2317‐2326. - PubMed
MeSH terms
LinkOut - more resources
Full Text Sources
Other Literature Sources
Medical

