

Complement C5 activation promotes type 2 diabetic kidney disease via activating STAT3 pathway and disrupting the gut-kidney axis
- PMID: 33280239
- PMCID: PMC7812276
- DOI: 10.1111/jcmm.16157
Complement C5 activation promotes type 2 diabetic kidney disease via activating STAT3 pathway and disrupting the gut-kidney axis
Abstract
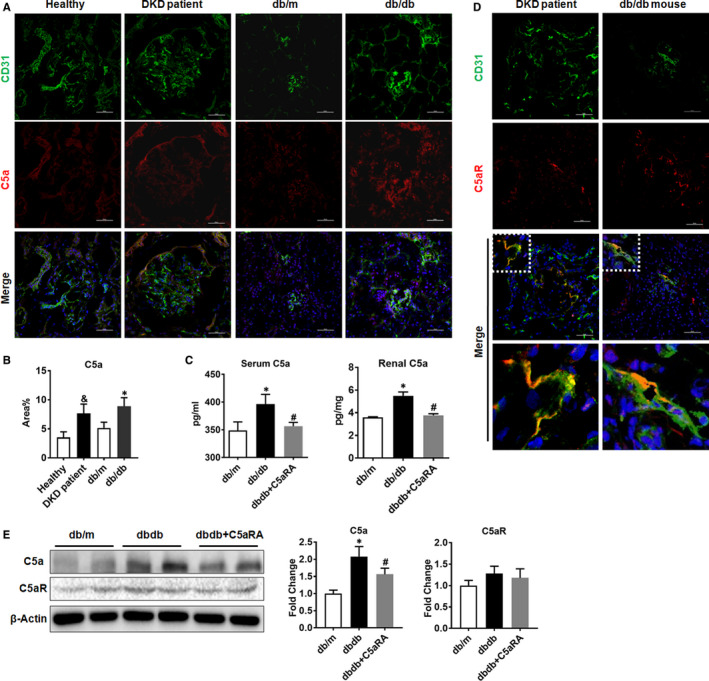
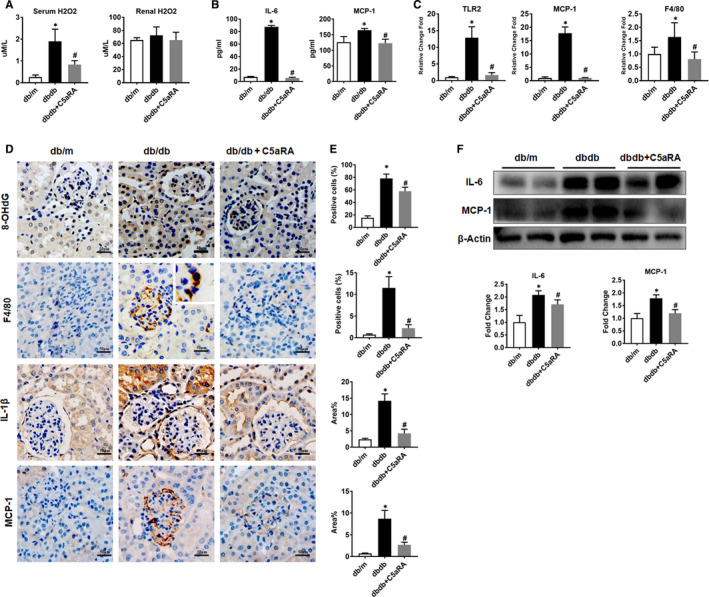
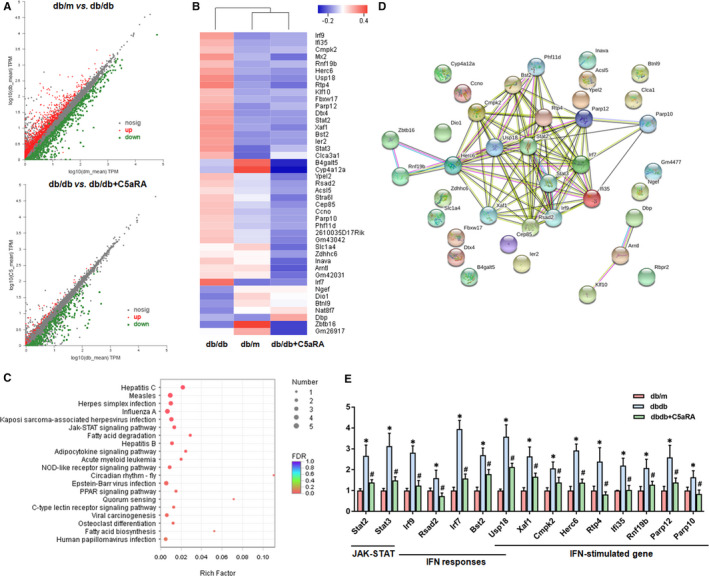
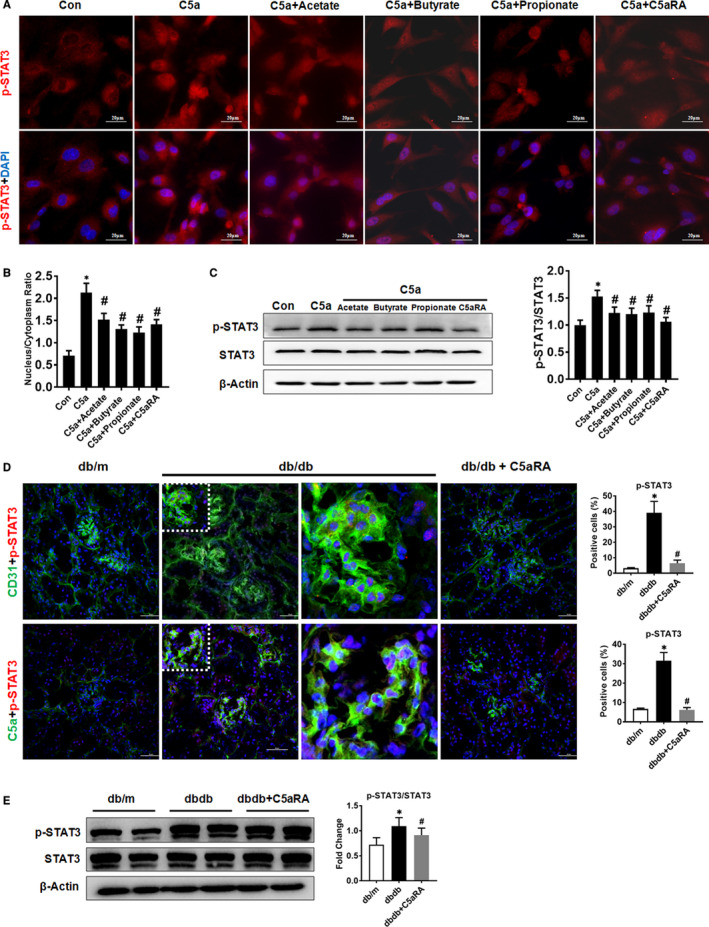
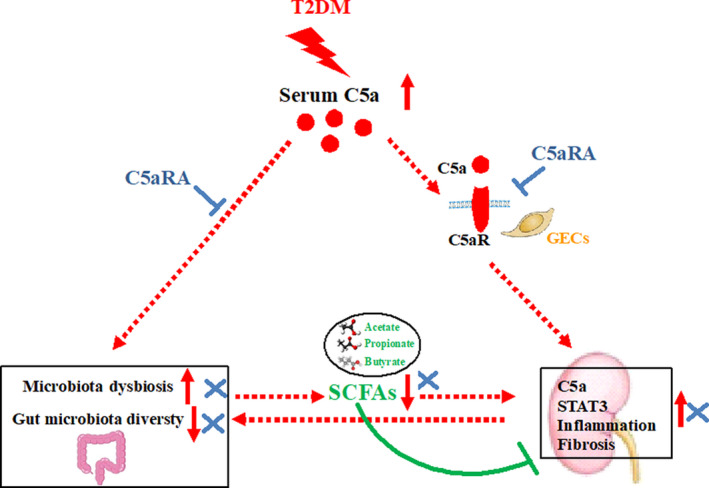
Diabetic kidney disease (DKD) is a severe DM complication. While complement C5 up-regulation and gut dysbiosis are found in T2DM, their roles in DKD are unclear. Here, we investigated the effect of C5 on the gut microbiota during DKD development. Renal C5a/C5a receptor (C5aR) expression changes were measured in T2DM patients and db/db mice. Db/db mice were treated with a C5aR antagonist (C5aRA), and renal function, gut microbiota and renal genome changes were analysed. The effects of C5a and short-chain fatty acids (SCFAs) on the signal transducer and activator of transcription 3 (STAT3) pathway were examined in vitro. C5a was up-regulated in glomerular endothelial cells (GECs) of T2DM patients and db/db mice. Although glucose and lipid metabolism were unchanged, C5aR blockade alleviated renal dysfunction, ECM deposition, macrophage infiltration and proinflammatory factor expression in db/db mice. C5aRA partly reversed the declines in gut microbiota diversity and abundance and gut SCFA levels in db/db mice. C5aRA down-regulated the expression of many immune response-related genes, such as STAT3, in db/db mouse kidneys. C5aRA and SCFAs suppressed C5a-induced STAT3 activation in human renal glomerular endothelial cells (HRGECs). Based on our results, C5 hyperactivation promotes DKD by activating STAT3 in GECs and impairing the gut-kidney axis, suggesting that this hyperactivation is a potential target for the treatment of DKD.
Keywords: SCFA; STAT3; complement C5; diabetic kidney disease; gut microbiota; inflammation.
© 2020 The Authors. Journal of Cellular and Molecular Medicine published by Foundation for Cellular and Molecular Medicine and John Wiley & Sons Ltd.
Conflict of interest statement
The authors report no conflicts of interest in this work.
Figures


Similar articles
-
C3a and C5a receptor antagonists ameliorate endothelial-myofibroblast transition via the Wnt/β-catenin signaling pathway in diabetic kidney disease.Metabolism. 2015 May;64(5):597-610. doi: 10.1016/j.metabol.2015.01.014. Epub 2015 Jan 29. Metabolism. 2015. PMID: 25682062
-
Complement C5a Induces Renal Injury in Diabetic Kidney Disease by Disrupting Mitochondrial Metabolic Agility.Diabetes. 2020 Jan;69(1):83-98. doi: 10.2337/db19-0043. Epub 2019 Oct 17. Diabetes. 2020. PMID: 31624141
-
Effect of liraglutide on the Janus kinase/signal transducer and transcription activator (JAK/STAT) pathway in diabetic kidney disease in db/db mice and in cultured endothelial cells.J Diabetes. 2019 Aug;11(8):656-664. doi: 10.1111/1753-0407.12891. Epub 2019 Feb 28. J Diabetes. 2019. PMID: 30575282
-
The Role of the Gut Microbiome in Diabetes and Obesity-Related Kidney Disease.Int J Mol Sci. 2021 Sep 6;22(17):9641. doi: 10.3390/ijms22179641. Int J Mol Sci. 2021. PMID: 34502562 Free PMC article. Review.
-
The role and mechanism of gut microbiota-derived short-chain fatty in the prevention and treatment of diabetic kidney disease.Front Immunol. 2022 Dec 19;13:1080456. doi: 10.3389/fimmu.2022.1080456. eCollection 2022. Front Immunol. 2022. PMID: 36601125 Free PMC article. Review.
Cited by
-
Gut microbiota, key to unlocking the door of diabetic kidney disease.Nephrology (Carlton). 2021 Aug;26(8):641-649. doi: 10.1111/nep.13874. Epub 2021 Mar 18. Nephrology (Carlton). 2021. PMID: 33715272 Free PMC article. Review.
-
The Complement System in Metabolic-Associated Kidney Diseases.Front Immunol. 2022 Jul 18;13:902063. doi: 10.3389/fimmu.2022.902063. eCollection 2022. Front Immunol. 2022. PMID: 35924242 Free PMC article. Review.
-
A Transcriptome Array-Based Approach to Link SGLT-2 and Intrarenal Complement C5 Synthesis in Diabetic Nephropathy.Int J Mol Sci. 2023 Dec 2;24(23):17066. doi: 10.3390/ijms242317066. Int J Mol Sci. 2023. PMID: 38069385 Free PMC article.
-
The potential mechanism of gut microbiota-microbial metabolites-mitochondrial axis in progression of diabetic kidney disease.Mol Med. 2023 Oct 31;29(1):148. doi: 10.1186/s10020-023-00745-z. Mol Med. 2023. PMID: 37907885 Free PMC article. Review.
-
C5a-C5aR1 axis controls mitochondrial fission to promote podocyte injury in lupus nephritis.Mol Ther. 2024 May 1;32(5):1540-1560. doi: 10.1016/j.ymthe.2024.03.003. Epub 2024 Mar 6. Mol Ther. 2024. PMID: 38449312 Free PMC article.
References
-
- Dei Cas A, Gnudi L. VEGF and angiopoietins in diabetic glomerulopathy: how far for a new treatment? Metabolism. 2012;61(12):1666‐1673. - PubMed
-
- Navarro‐González JF, Mora‐Fernández C. The role of inflammatory cytokines in diabetic nephropathy. J Am Soc Nephrol. 2008;19(3):433‐442. - PubMed
-
- Tuttle KR. Linking metabolism and immunology: diabetic nephropathy is an inflammatory disease. J Am Soc Nephrol. 2005;16(6):1537‐1538. - PubMed
Publication types
MeSH terms
Substances
Grants and funding
- 81700634/National Natural Science Foundation of China
- 82070711/National Natural Science Foundation of China
- Z20192002/National Clinical Research Center for Geriatrics, West China Hospital, Sichuan University.
- 2019YFS0279/Key Research and Development (R&D) Project funded by Science and Technology Department of Sichuan Province
LinkOut - more resources
Full Text Sources
Medical
Miscellaneous
